

Justin Sullivan
Shares of Walgreens Boots Alliance (NASDAQ:WBA) have disappointed shareholders lately, declining -31.88% over the past year and -33.53% YTD. It’s been a rough road as WBA started 2022 at $53.06, and shares have slid to $35.27. Not even the enormous 5.45% dividend yield can get shareholders excited as new 52-week lows were just made. The market isn’t rewarding many companies these days, but WBA generates billions in profits unlike many popular companies. Nobody knows when the market will, and the current weakness is creating some attractive opportunities for long-term investors. WBA has been in a perpetual decline as shares have lost -56.67% of their value over the previous 5-years. With shares yielding over 5%, I think it’s time to consider shares of WBA for an income-focused portfolio.
Seeking Alpha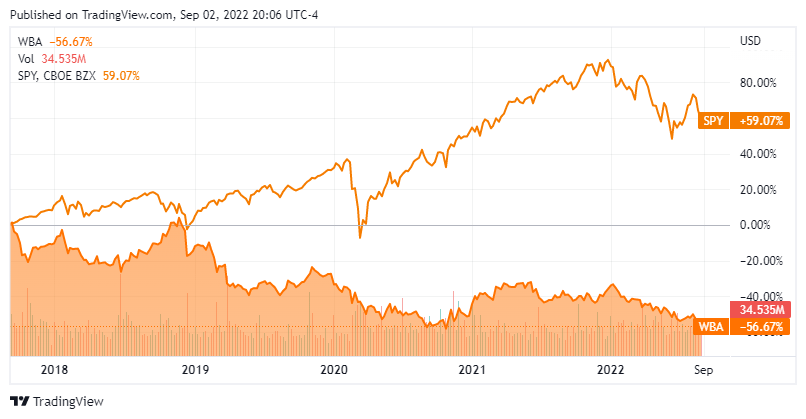
Walgreens is trading at an attractive valuation even though the market continues to punish its shares
This may not be the best environment to pick winners and losers or see which companies investors are overlooking as the majority of stocks are declining. The Nasdaq is in a bear market, while the S&P is on the verge of crossing over into bear market territory once again. WBA has declined -33.53%, underperforming the major indices in 2022. It’s market cap has declined to $30.3 billion, which is now less than the total equity on WBA’s balance sheet. WBA is also getting close to trading at a 1:1 ratio to its book value. Many news articles and segments on financial news networks have discussed profitless tech and how companies with non-existent EPS and FCF will continue to be punished in a rising rate environment. Looking at WBA’s financials, there are a lot of reasons why I am getting bullish on WBA.
Free Cash Flow (FCF) is often looked at as one of the best measures of profitability as FCF excludes the non-cash expenses of the income statement and includes spending on equipment and assets as well as changes in working capital from the balance sheet. To some investors, FCF is more important to analyze than net income because it’s harder to manipulate as it is a true indication of the company’s cash. FCF is also the pool of capital that companies can utilize to repay debt, pay dividends, buy back shares, make acquisitions, or reinvest in the business. With every share of stock purchased, you’re getting an equity share of the business in return, and your shares represent a portion of the revenue and earnings generated. In my opinion, businesses that generate large amounts of FCF should be rewarded, not discarded.
When it comes to the FCF multiple, I like to pay between 18-22 times FCF for a company’s stock, and if I can find good companies trading at less than 18x FCF, my interest immediately elevates. The FCF multiple that the market places on a company can be found by dividing a company’s market cap by the FCF produced over the trailing twelve months (TTM). Apple (AAPL), for instance, trades at an FCF multiple of 23.28x ($2.5 trillion / $107.58 billion). I am willing to pay more for a company’s FCF if they have a larger growth rate, and AAPL at 23.28x FCF looks very intriguing.
WBA has generated $5.06 billion in cash from operations and allocated $1.62 billion to CapEx putting its FCF at $3.44 billion over the TTM. WBA’s market cap is $30.3 billion, which means its trading at 8.86x its FCF. WBA trades at one of the lowest FCF ratios of all the Dividend Aristocrats. International Business Machines (IBM) trades at a FCF multiple of 14.08x ($115.42 billion market cap / $8.2 billion FCF), Johnson & Johnson (JNJ) trades at a FCF multiple of 21.45x ($427.87 billion market cap / $19.95 billion FCF), Kimberly-Clark (KMB) trades at a FCF multiple of 23.59x ($42.7 billion market cap / $1.81 billion FCF), and Caterpillar (CAT) trades at a FCF multiple of 31.28x ($95.46 billion market cap / $3.05 billion FCF).
Looking further through WBA’s financials, I found two metrics that were also interesting. WBA has $31.16 billion of total equity on its balance sheet. As WBA’s market cap is $30.3 billion, it’s currently trading at a -2.75% discount to the equity on its balance sheet. Most companies trade at a premium to equity, and WBA has now fallen below a 1:1 ratio. The other aspect that looks interesting is WBA’s book value. On WBA’s balance sheet, its book value per share is $30.38. WBA currently trades at a 16.1% premium to its book value. For value investors, the P/B ratio is a timeless method for finding stocks that could be mispriced. A P/B ratio of less than 1 could be an indicator that the market has misunderstood a company and undervalued it. As WBA is trading close to a 1:1 book value, there could be an underlying opportunity in its shares.
WBA is approaching Dividend King status and continues to allocate capital back to shareholders
WBA is a Dividend Aristocrat approaching Dividend King status as it increased its annual dividend for 46 consecutive years. WBA’s share price has been declining, but that hasn’t stopped WBA from rewarding its shareholders with a growing dividend and buybacks. WBA generates billions in FCF and puts that pool of capital to work. With every share repurchased, shareholders own a larger part of the equity in WBA, and with every dividend increase, shareholders receive a larger portion of the earnings each share generates.
Since WBA’s last stock split in 1999, its quarterly dividend has increased by 1,377% going from $0.0325 to $0.48. WBA pays a dividend of $1.92 per share, which is a 5.45% yield. In the TTM, WBA has generated $6.22 in EPS, placing its annual payout ratio at 30.87% of its earnings. WBA’s dividend has a 5-year growth rate of 4.63%, with 46 years of consecutive increases. At today’s prices, WBA is generating considerable amounts of income and, after 4 more increases, will be considered a Dividend King.
Seeking Alpha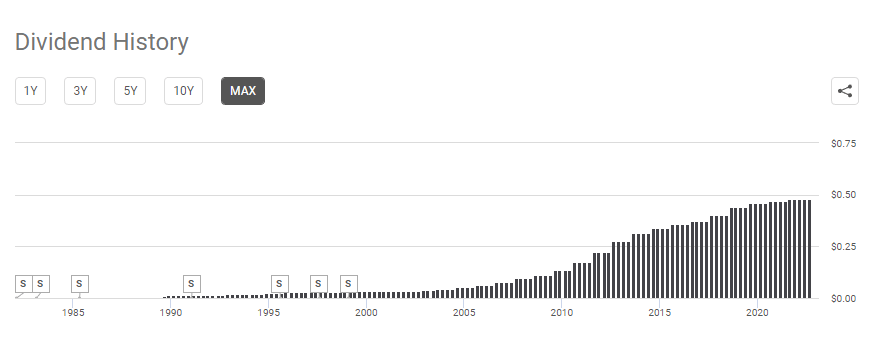
WBA has also used its profits to buy back shares. In 2015 WBA had 1.09 billion shares outstanding. Since then, WBA has used its FCF to buy back 224.5 million shares, reducing its outstanding shares by -20.62%. With each buyback, WBA increases the amount of equity its remaining shares represent, and its EPS and revenue per share are spread among a lower float. While many companies continue to issue shares and dilute shareholders, WBA not only increases equity for its investors but has provided decades of dividend increases. I think this is something that is overlooked and that companies who create value for shareholders through buybacks and dividends should be rewarded, not discounted. WBA is doing this from a position of financial stability, not weakness.
Conclusion
I believe shares of WBA have gotten too cheap and lost in the havoc created by the declining indices. Today, WBA trades at 8.86x FCF, trades at a discount to its equity, and is getting close to a 1:1 P/B. WBA generates $134.52 billion in revenue and billions in profits. Today you are able to pick shares up at a steep discount and get paid a dividend that exceeds 5% while you wait for a turnaround. I think WBA could be a great income stock and a capital appreciation generator if you take a long-term approach. For investors who WBA has burned, maybe now is the time to consider dollar cost averaging into the position and reinvesting the dividend. WBA’s track record suggests that future buybacks and dividend increases will occur as they have an impeccable track record of generating FCF. When the markets finally recover, I could see WBA trading over $50 per share once again.
Be the first to comment