

djmilic/iStock via Getty Images
Recently, I have written articles reviewing multiple high-yielding exchange-traded funds (“ETFs”) such as the Schwab U.S. Dividend Equity ETF (SCHD), the Proshares S&P500 Dividend Aristocrats ETF (NOBL), and the SPDR Portfolio S&P 500 High Dividend ETF (SPYD). I found that the SCHD ETF has the highest historical returns, as well as the most sensible strategy that balances dividend yield and financial strength. How does the Vanguard High Dividend Yield ETF (NYSEARCA:NYSEARCA:VYM) compare against SCHD?
The VYM ETF is a solid high-yielding fund by itself, but my conclusion is that the SCHD has better historical returns and risk metrics, not to mention a higher distribution yield that has been growing at a faster pace. I also feel more comfortable knowing the weighting methodology of SCHD vs. the proprietary screens employed by the VYM.
Fund Overview
The Vanguard High Dividend Yield ETF aims to provides a low-cost vehicle for investors to gain exposure to stocks that are forecasted to pay above-average dividend yields. The VYM ETF currently has $58 billion in assets under management (“AUM”).
Strategy
The VYM ETF seeks to achieve its investment objective by tracking the FTSE High Dividend Yield Index (the “Index”), which measures the investment return of companies that are forecasted to pay high dividend yields. The investment universe excludes REITs and companies currently not paying dividends and forecasted to not pay a dividend in the next 12 months. The index also applies additional proprietary screens, although this is not disclosed. The index is reviewed annually.
Portfolio Holdings
The VYM ETF holds a total of 443 stocks in its portfolio, with a median market cap of $132 billion. Style-wise, the VYM ETF skew towards large-cap value (Figure 1).
Figure 1 – VYM Portfolio composition (vanguard.com)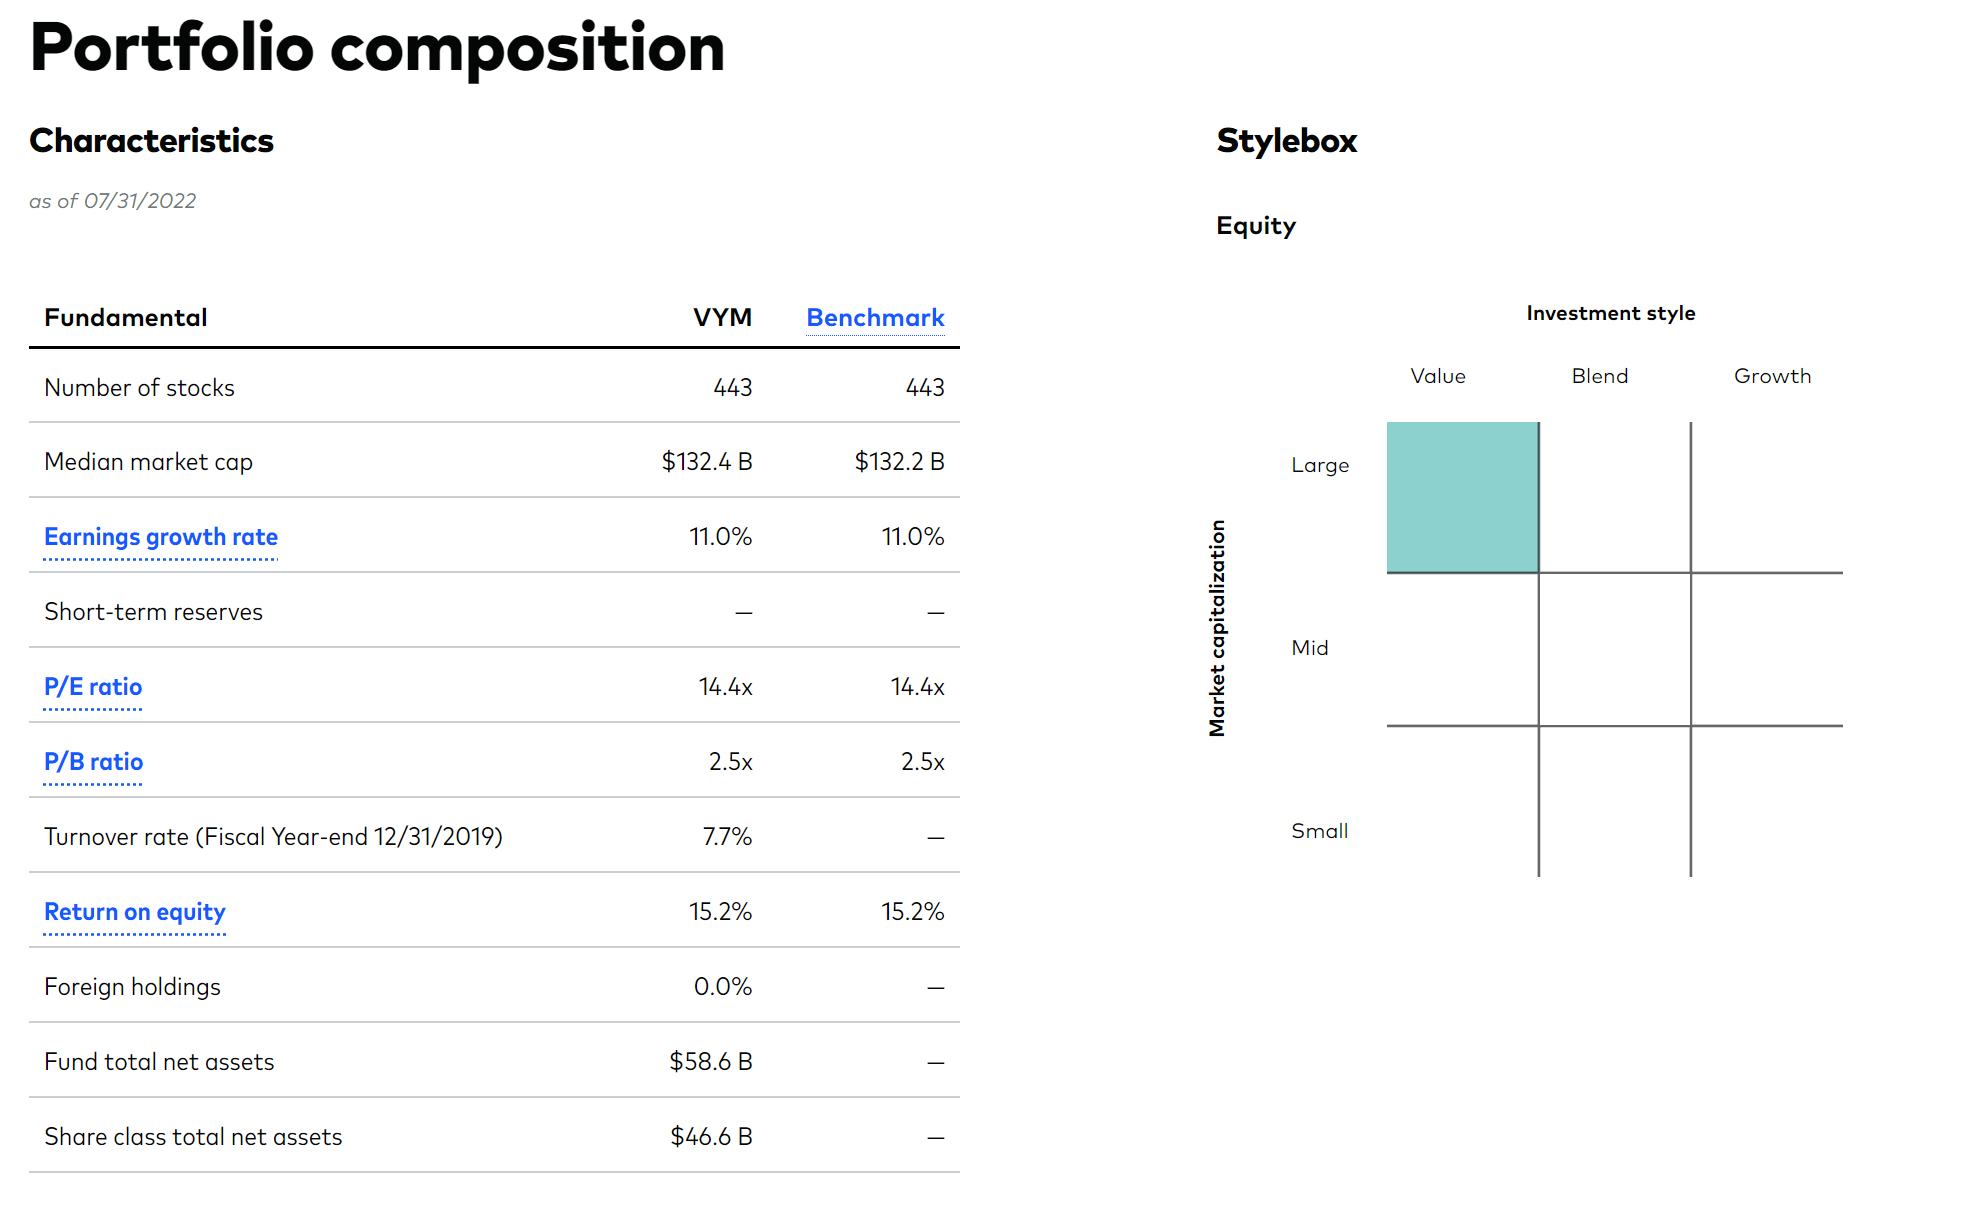
The defensive skew means the VYM ETF has higher than market weights in consumer staples and utilities. It is also overweight cyclical energy, financials, and industrials and severely underweight technology (Figure 2).
Figure 2 – VYM sector breakdown (vanguard.com)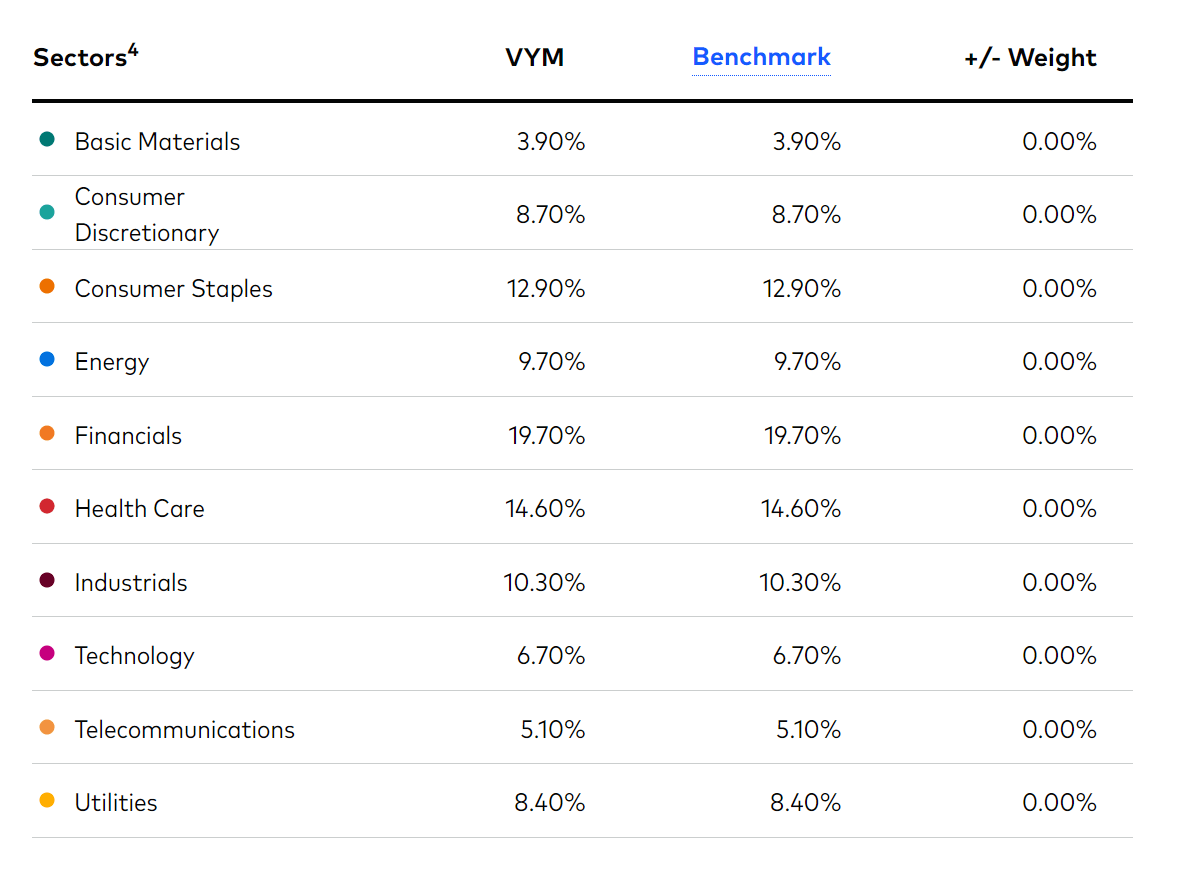
The fund’s top 10 positions are shown in Figure 3 and account for 23% of the fund. Interestingly, the largest weight of the fund is Johnson & Johnson (JNJ), despite it not having the highest dividend yield or dividend growth rate of the top 10 positions. It is unclear what additional factors the VYM ETF team ranks securities by.
Figure 3 – VYM Top 10 positions (vanguard.com)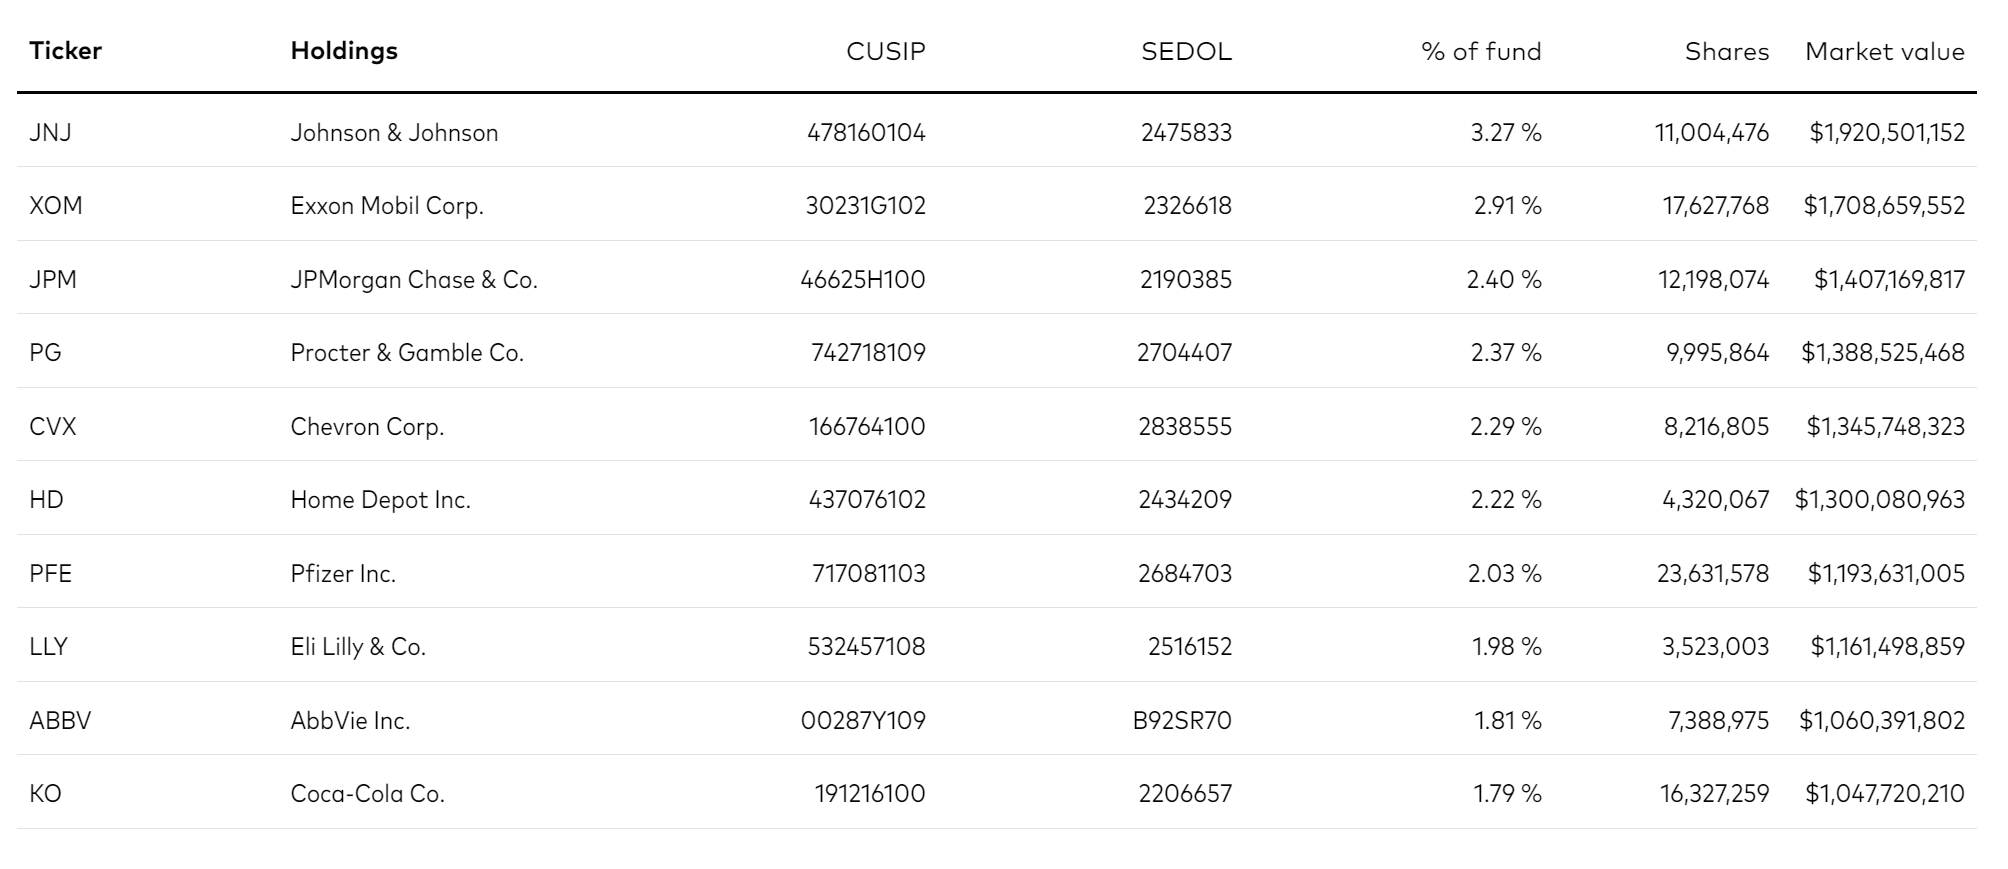
Returns
The VYM ETF has delivered solid historical performance, with 3/5/10 Yr annual returns of 9.8%, 8.9%, and 11.1%, respectively. This compares to 12.4%, 11.8%, and 13.0% for the S&P 500 Index.
Figure 4 – VYM Returns (vanguard.com)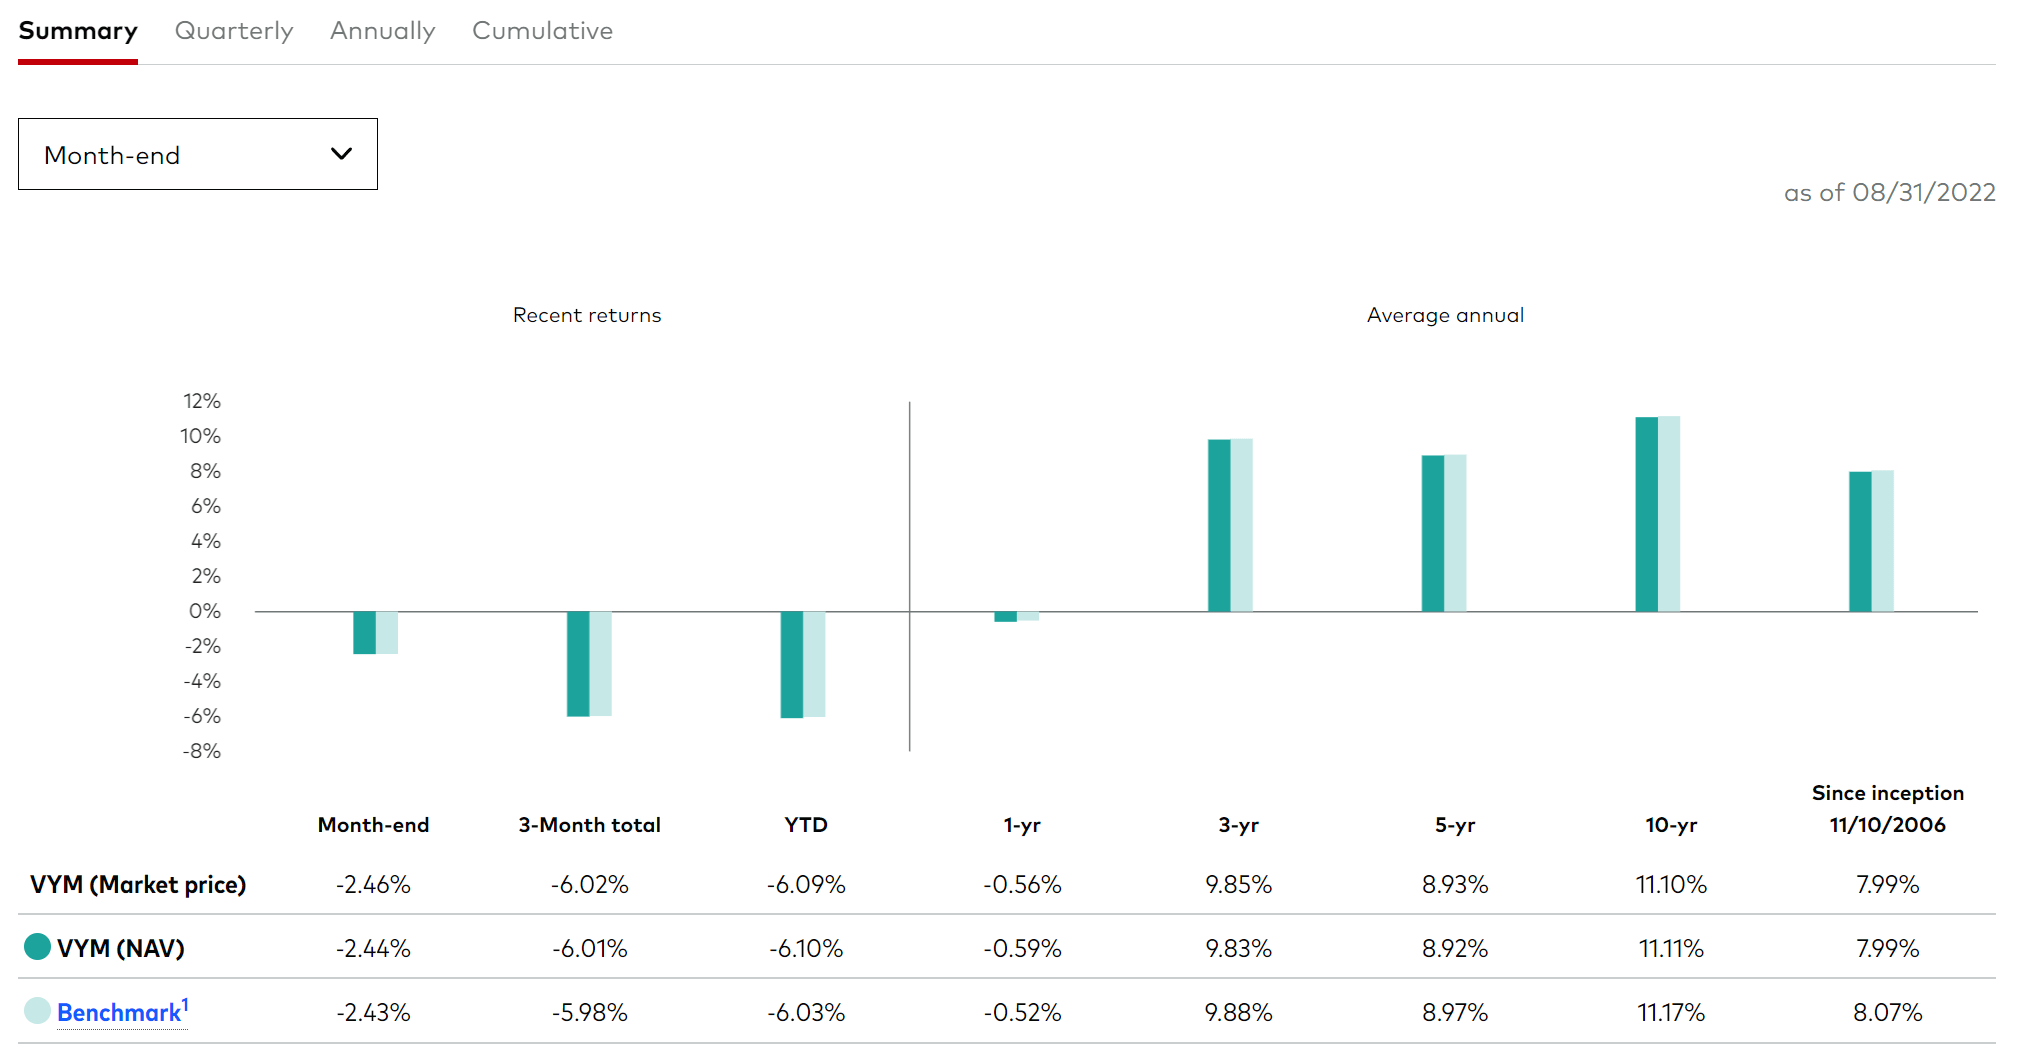
Importantly, VYM’s performance has been achieved with relatively lower volatility than the market. VYM’s 10 Yr Stdev of returns is 12.9% versus 14.0% for the S&P 500 Index. Drawdown-wise, VYM’s max drawdown of 24.0% is larger than the S&P 500’s 20.0% max drawdown (Figure 5). The VYM has a 10 Yr 0.86 Beta to the market.
Figure 5 – VYM Risk Metrics (morningstar.com)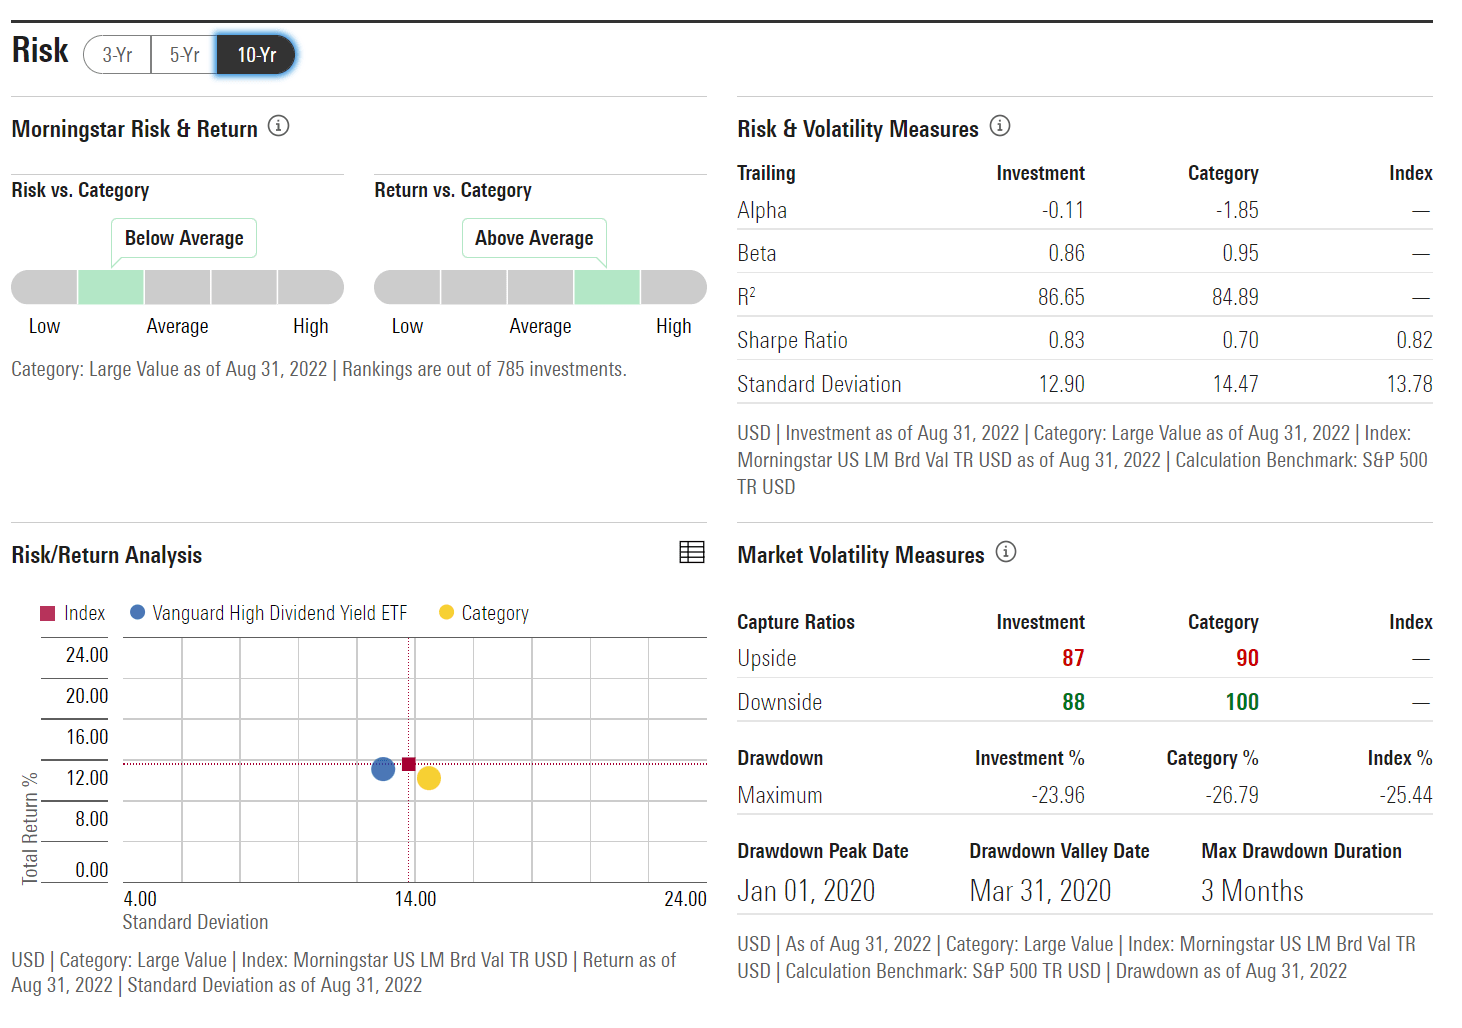
Distribution & Yield
As the name suggests, the VYM ETF pays a high distribution yield, currently at 3.0%. The fund’s distribution has grown at a 5Yr CAGR of 7.0% (Figure 6). VYM’s distribution is paid quarterly and is variable. It’s latest distribution of $0.8479 / share was paid on June 24.
Figure 6 – VYM Dividend growth (Seeking Alpha)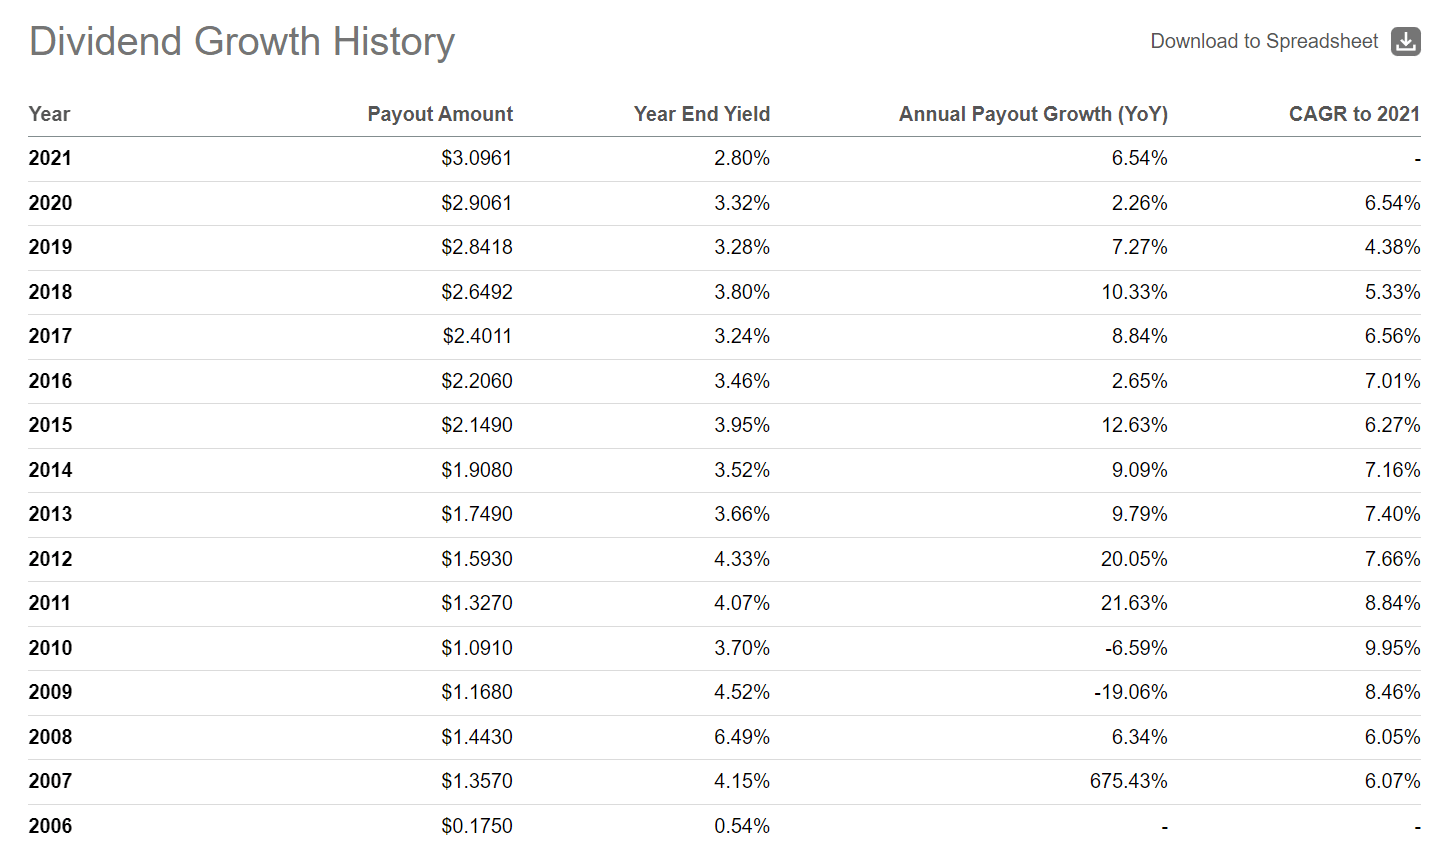
Fees
True to the Vanguard ethos, VYM is a very low cost fund. It has an expense ratio of 0.06%, among the lowest for comparable funds.
Comparing VYM To SCHD
Using Portfolio Visualizer to compare between VYM and my current high yield pick, SCHD ETF, we can see that SCHD has a higher CAGR return in the period analyzed (November 2011 to August 2022) of 13.4% vs. 11.7%. Max drawdown also favors SCHD, at 21.5% for SCHD vs. 24.0% for VYM. SCHD has a better Sharpe ratio of 0.98 vs. VYM’s 0.90. However, VYM does have lower volatility of 12.6% Stdev vs. 13.1% for SCHD, and VYM’s YTD return of -6.1% is better than SCHD’s -8.9%.
Figure 7 – VYM vs. SCHD (Author created using Portfolio Visualizer)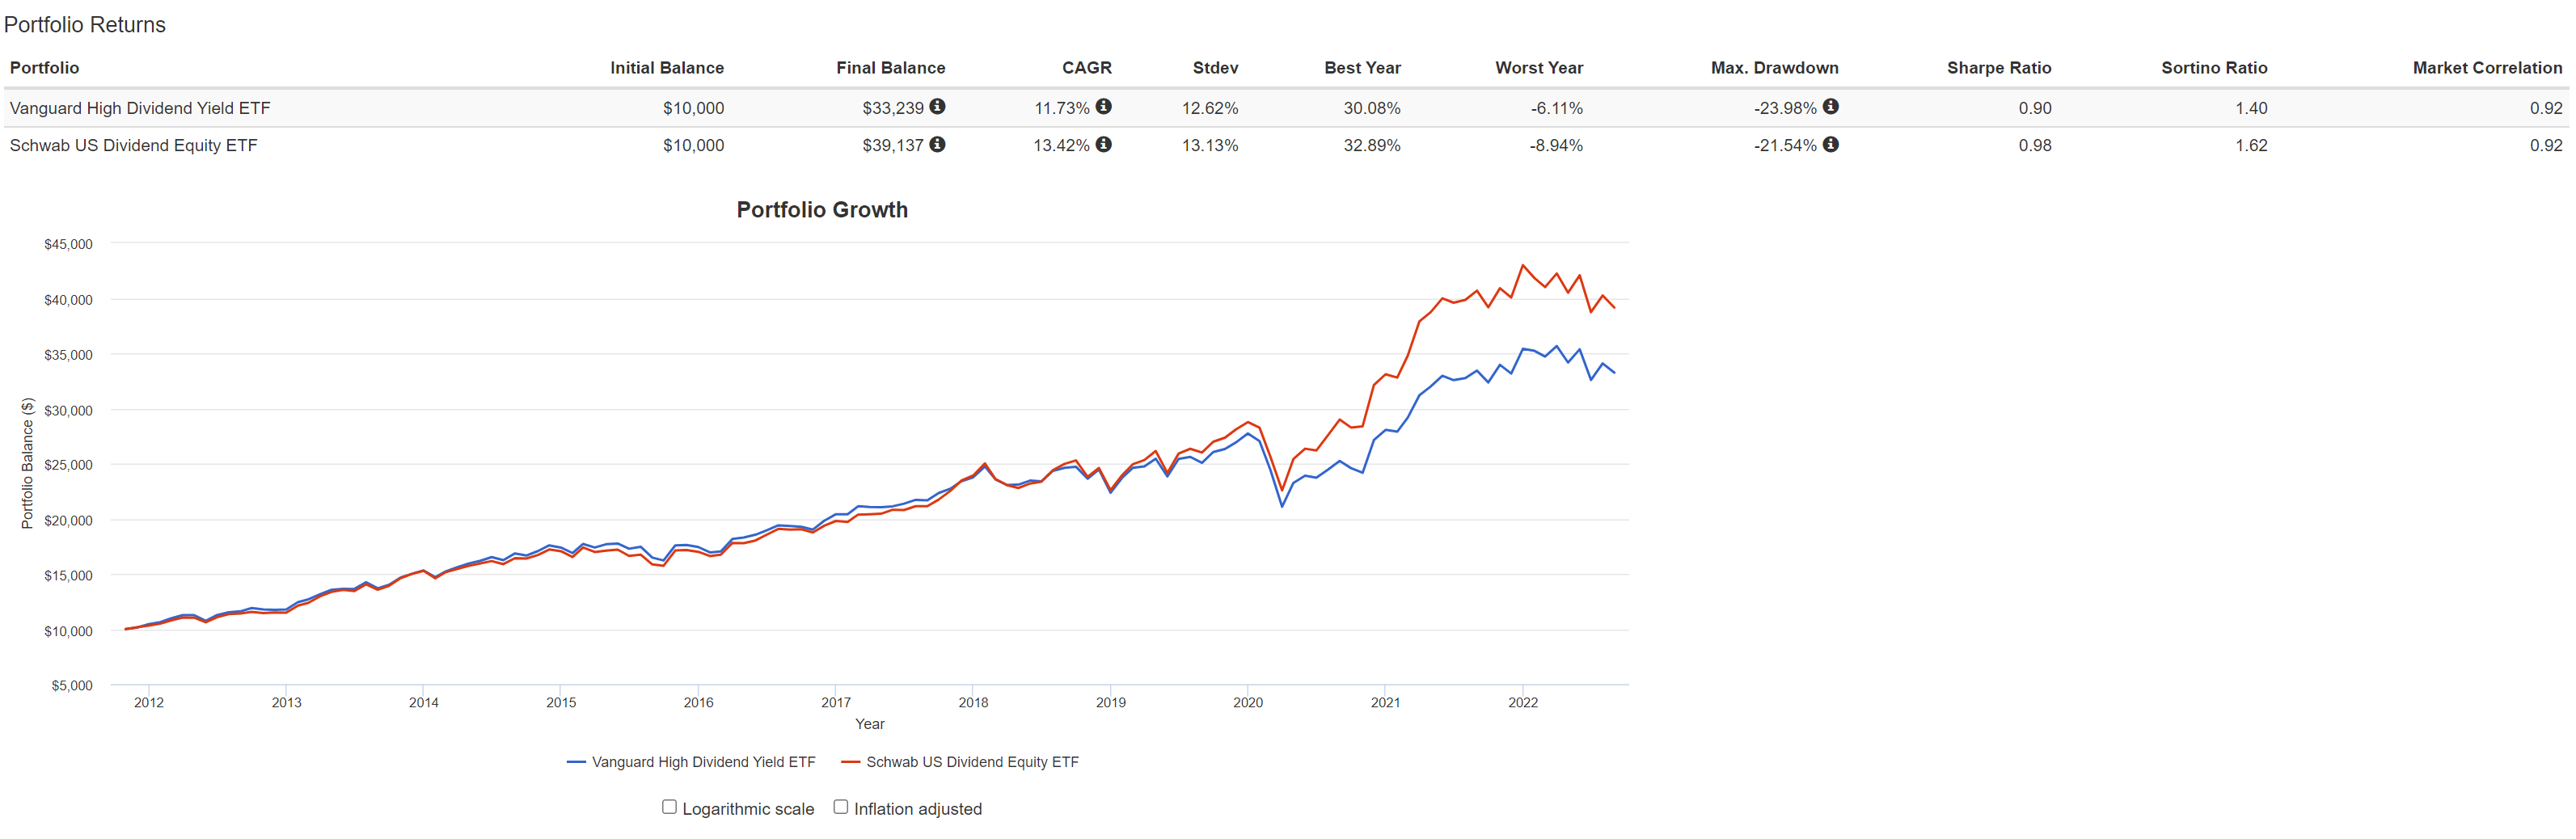
Comparing fees, the contest is a tie, with both having a 0.06% expense ratio.
In terms of the distribution, SCHD is slightly ahead, with a current 3.3% distribution yield vs. 3.0% for VYM. SCHD has also been growing its distribution at a faster rate than VYM, with a 5Yr CAGR of 12.3% vs. VYM’s 7.0%.
Figure 8 – SCHD Dividend Growth (Seeking Alpha)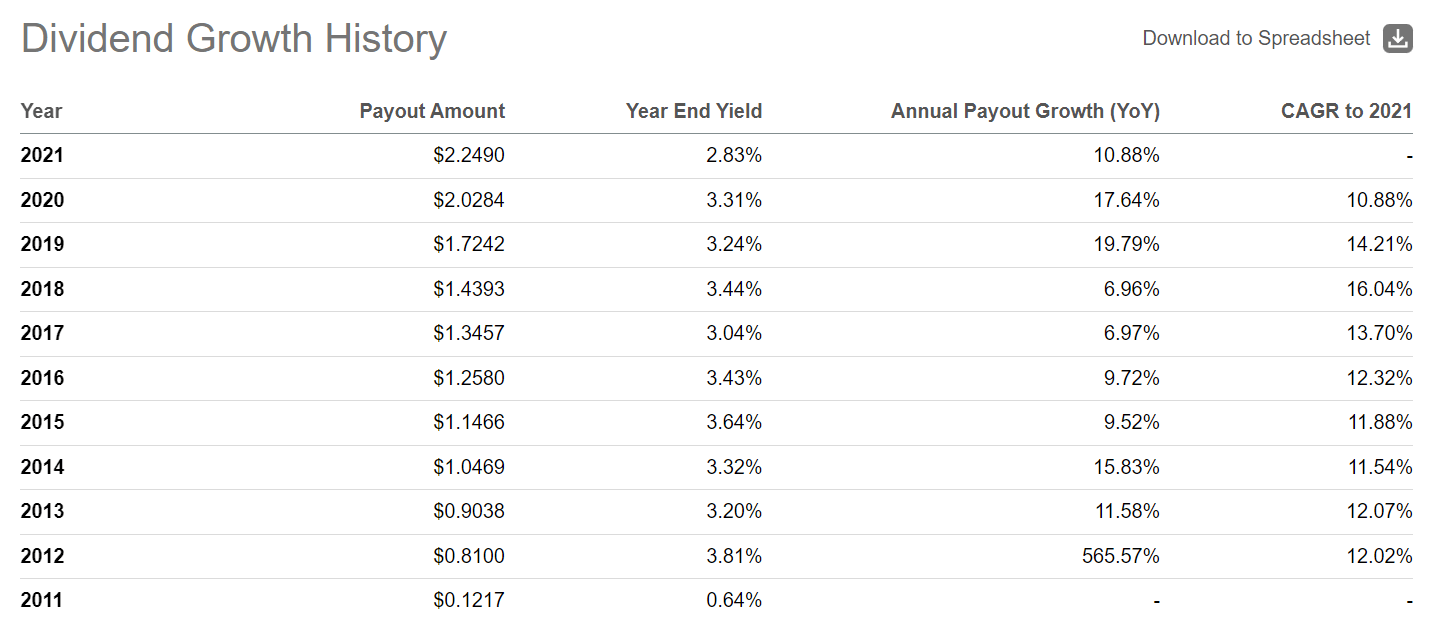
Comparing the strategies, I also prefer SCHD’s simple and transparent strategy. As I understand it, SCHD screens companies for cash flow to debt, return on equity, dividend yield, and 5-year dividend growth rate. These 4 factors tend to return companies that have shown financial strength, high returns, and increasing distributions over time. In contrast, VYM’s strategy is a little harder to discern, as I have commented above regarding the top 10 positions. It begins with a universe of stocks with high forecasted dividend yields, but it adds proprietary screens that is hard for analysts to figure out.
Conclusion
In summary, while the VYM ETF is a solid high-yielding value fund by itself, I find SCHD has better historical returns and risk metrics, not to mention a higher distribution yield that has been growing at a faster pace. I also feel more comfortable knowing the weighting methodology of SCHD vs. the proprietary screens employed by the VYM.
Be the first to comment