

Thapana Onphalai/iStock via Getty Images
Investment Thesis
The Vanguard Value ETF (NYSEARCA:VTV) is a leading large-cap value ETF with an ultra-low 0.04% expense ratio and $99 billion in assets under management. Most investors own it for its robust value features, including a 17.10x forward earnings valuation and overweight positions in defensive sectors like Consumer Staples and Health Care. However, this article describes how VTV has closed the growth gap in recent months relative to the Vanguard Large Cap ETF (VV) and the Vanguard Growth ETF (VUG). VTV’s expected earnings growth is now only 1.67% and 3.31% less than VV and VUG compared to 4.99% and 9.67% six months ago. To be sure, the valuation gap has also closed. However, these changes suggest VTV can perform relatively well in a market rebound, which is why I’ve rated it a buy. I look forward to describing the changes in all three ETFs next.
ETF Overview
Strategy and Key Exposures
Vanguard offers three straightforward large-cap style ETFs: VTV, VV, and VUG. VTV is the largest of the three by total assets ($99.34 billion), but they all have 0.04% expense ratios, as summarized below.
Morningstar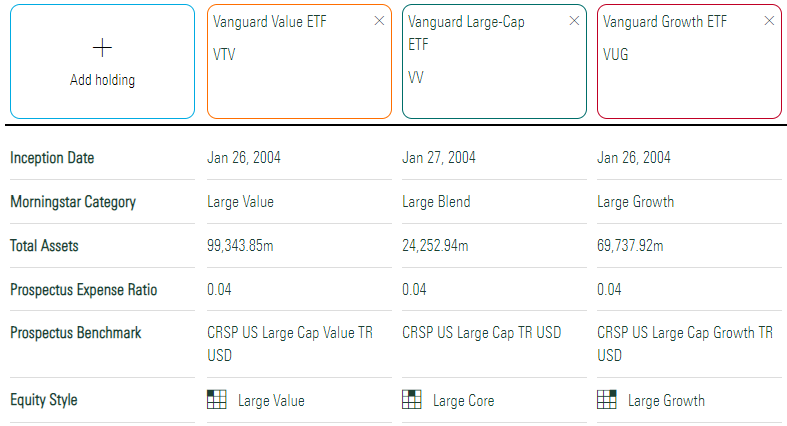
VTV tracks the CRSP US Large Cap Value Index, using five factors to rank large-cap stocks:
- Book To Price Ratio
- Future Earnings To Price Ratio
- Historical Earnings To Price Ratio
- Dividend To Price Ratio
- Sales To Price Ratio
The Index is free-float market-cap-weighted and uses dynamic breakpoints to assign a company to a particular size segment. In addition, the Index has some buffer rules to prevent unnecessary turnover. For example, 66/336 constituents are below this quarter’s current $13.39 billion market cap breakpoint. However, they only account for 3% of Index weight, and there’s no real benefit to swapping out these negligible stocks to satisfy an arbitrary breakpoint figure.
VTV’s sector exposures are listed below. As mentioned in the introduction, it overweights Consumer Staples and Healthcare, two defensive sectors that usually outperform in market downturns. Financials are also significant at 20.25%, typical for a selection process that does not differentiate between companies in different sectors. Other rules-based ETFs apply the concept of relative value by sector or even industry, but not VTV.
Morningstar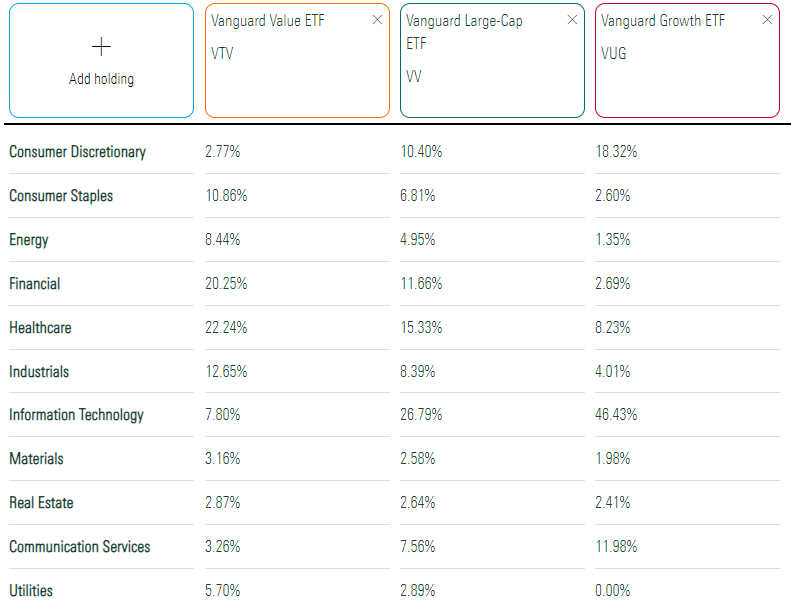
Notice how VTV has 7.80% Technology exposure compared to 46.43% for VUG. Given the sector’s success in the past decade, you might assume VUG’s growth rate is substantially better. However, the key message in this article is that it’s no longer the case. I’ll discuss this in detail later when comparing the changes in each ETF’s growth estimates, but keep that in mind for now.
Finally, VTV’s top ten holdings are below, totaling 22.23%. They include Berkshire Hathaway (BRK.A) (BRK.B), UnitedHealth Group (UNH), and Johnson & Johnson (JNJ). Exxon Mobil (XOM) and Chevron (CVX) provide solid Energy exposure, a sector key to the style’s relative outperformance this year. For reference, VV and VUG’s top ten holdings total 25.89% and 48.40%, so VTV has the diversification advantage at the company level.
Vanguard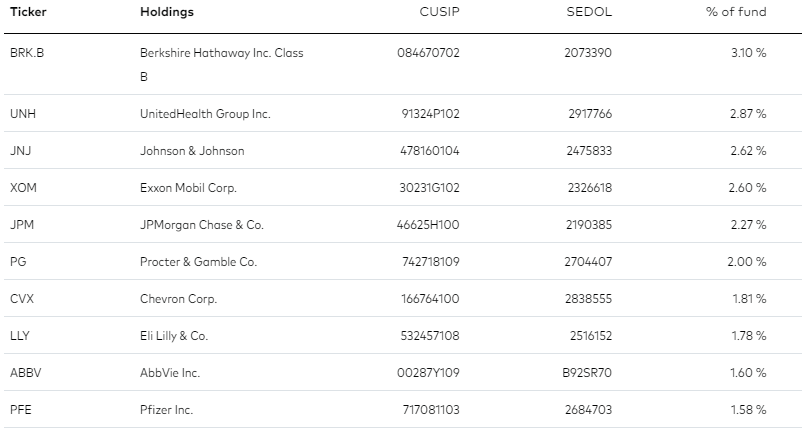
Performance Analysis
VTV previously tracked the S&P 500 Value Index through May 16, 2003, and the MSCI US Prime Market Value Index through April 16, 2013. Therefore, I’ll evaluate its performance beginning in May 2013. VTV gained an annualized 10.59% compared to 11.34% and 12.11% for VV and VUG. Volatility, measured by annualized standard deviation, was relatively low at 14.58%, and VTV’s worst year was in 2018 when it declined by 5.44%.
Portfolio Visualizer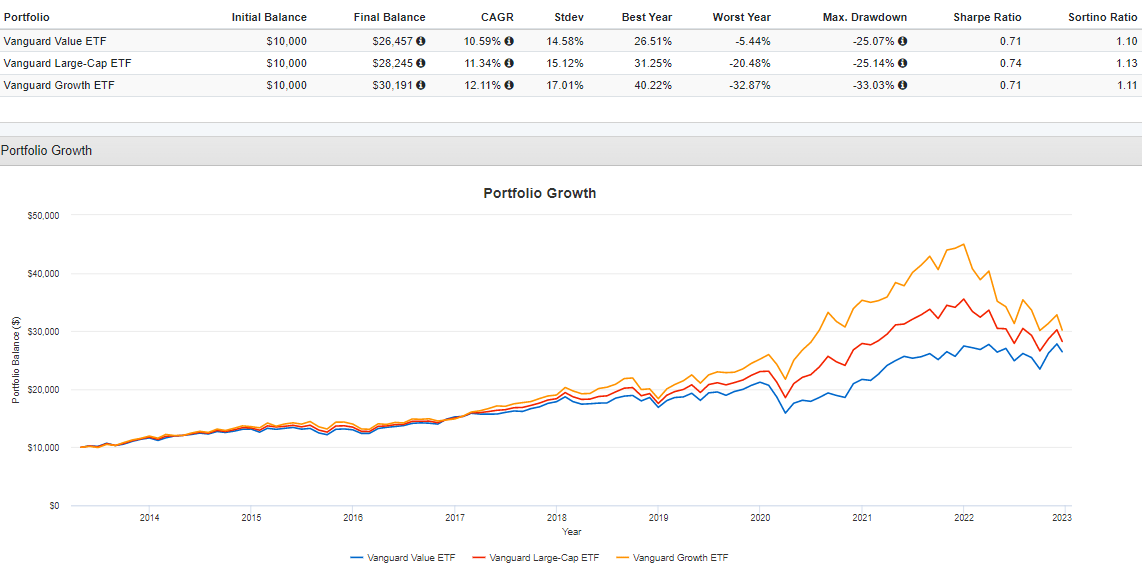
Through December 19, 2022, VTV is down an admirable 3.60% YTD compared to 20.48% and 32.87% declines for VV and VUG. Some investors may look at the three ETFs, note their high correlation coefficients with the market (0.94, 0.99, and 0.94), and conclude that all equity ETFs will rise and fall together, so there’s no point diversifying by style. However, these returns illustrate why that’s not true. Growth stocks do well when market sentiment is high, like in 2009 and 2020. Given how S&P 500 quarterly earnings surprises are below their long-term average of 5-7%, I think the reversal of growth will continue.
Is Value The New Growth?
The table below details selected fundamental metrics for VTV’s top 25 industries. The bolded rows at the bottom summarize the entire fund alongside VV and VUG.
The Sunday Investor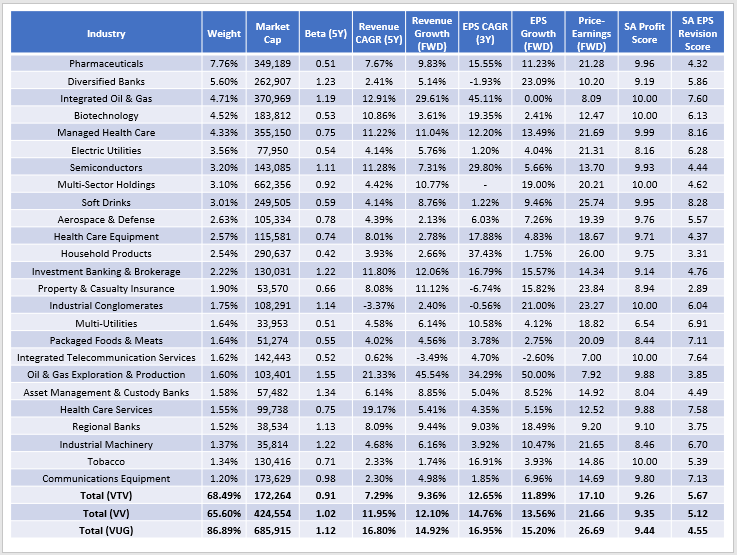
This table summarizes what you expect, as VV’s metrics are roughly equidistant from VTV and VUG. For example, its 1.02 five-year beta fits nicely between VTV’s 0.91 and 1.12. Its 13.56% estimated earnings growth rate is between VTV’s 11.89% and VUG’s 15.20%. Finally, VV trades at 21.66x forward earnings, 4.56 points higher than VTV and 5.03 points less than VUG.
However, the most interesting aspect is how close VTV’s growth metrics are to VUG. VTV’s constituents are estimated to grow sales and earnings by 9.36% and 11.89%, respectively, compared to 14.92% and 15.20% for VUG. This 3.31% earnings growth gap with VUG is much smaller than the 9.67% growth gap (14.35% vs. 24.02%) on July 1, 2022. The following table summarizes the compression over the last six months.
The Sunday Investor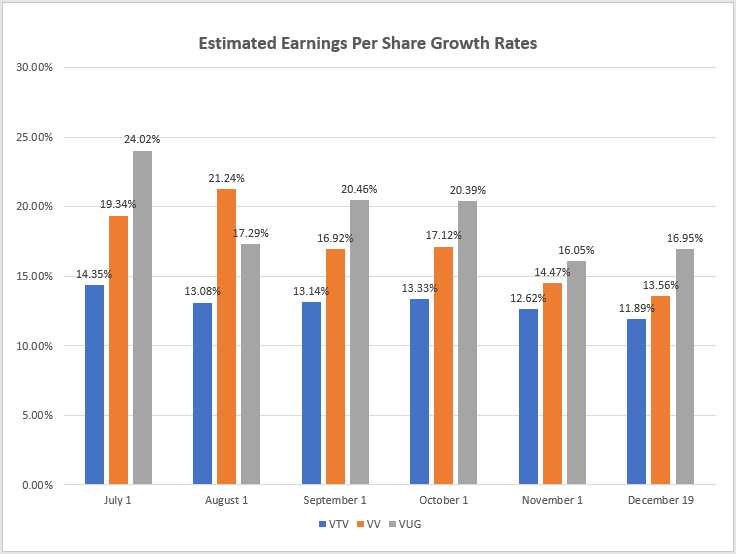
So is value the new growth? Not quite, but it’s getting close, and growth investors should ask themselves how much of a premium they are willing to pay for what’s now just 3.31% more growth. VTV, VV, and VUG traded at 16.27x, 23.12x, and 29.78x forward earnings in July compared to 17.10x, 21.66x, and 26.69x today. While VTV’s earnings valuation was the only one to increase, the deal is arguably better today. Growth-at-a-reasonable-price investors may divide the estimated earnings growth rate into the forward price-earnings ratio and observe the following changes from July to today:
- VTV: 1.13 to 1.44 (+0.31)
- VV: 1.20 to 1.60 (+0.40)
- VUG: 1.24 to 1.76 (+0.52)
VTV’s ratio increase is the smallest of the three, and while any increase is unfavorable, it’s still the most attractive from a GARP perspective. So what’s driving this? We can look at the market’s most prominent companies and their estimated earnings growth changes to find out. In the table below, I’ve highlighted companies with around negative double-digit earnings growth changes or worse, and they’re all overweight in VUG.
The Sunday Investor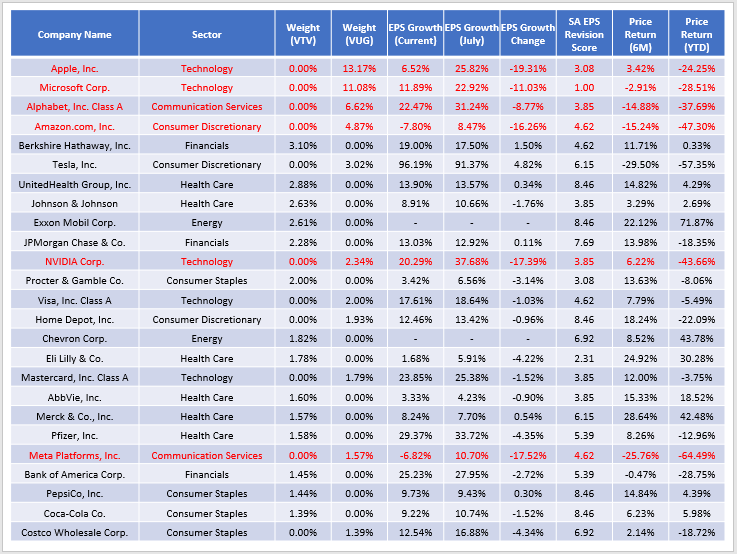
All five companies whose estimated growth rates have improved have outperformed the market since July. Then there’s Tesla (TSLA), but that issue is mainly linked to Elon Musk’s many distractions and an unusually high price-earnings ratio.
Seeking Alpha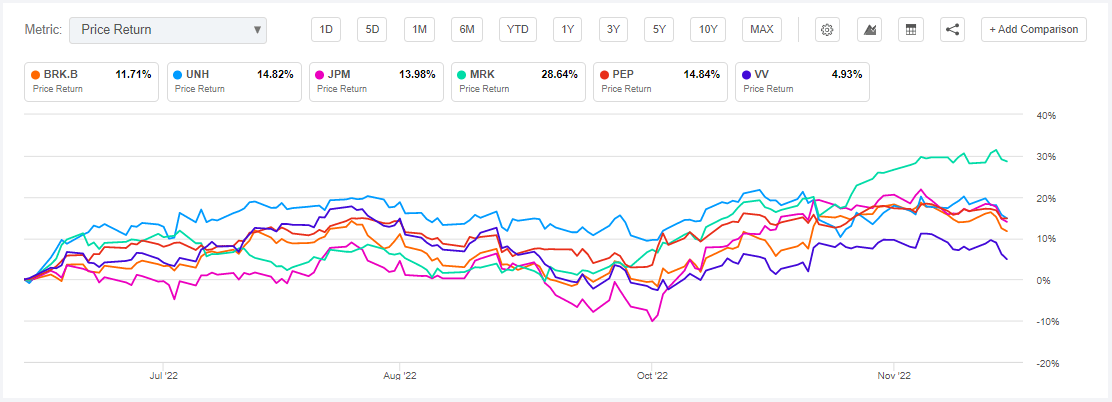
Investment Recommendation
VTV is a suitable fund for multiple investor types, including growth-focused ones. In the last six months, VTV’s earnings per share growth estimates declined by only 2.46% vs. 7.07% for VUG. Today’s difference is a scant 3.31% for a 9.59-point discount on forward earnings, suggesting that VTV is the more reasonable choice. Furthermore, analyst momentum favors value stocks, as indicated by VTV’s superior EPS Revision Score (5.67/10 vs. 4.55/10). These are concrete reasons why VTV has outperformed VUG by 29% YTD and why it will probably continue until traditional growth companies give investors a reason to be bullish again. Thank you for reading, and I look forward to discussing these ETFs further in the comments below.
Be the first to comment