

Oskanov
This dividend ETF article series aims at evaluating products regarding the relative past performance of their strategies and quality metrics of their current portfolios. Holdings and their weights change over time: reviews are updated when necessary.
DGS strategy and portfolio
The WisdomTree Emerging Markets SmallCap Dividend Fund (NYSEARCA:DGS) has been tracking the WisdomTree Emerging Markets SmallCap Dividend Index since 10/30/2007. It has 978 holdings, a 12-month distribution yield of 5.08% and a total expense ratio of 0.58%. Distributions are paid quarterly.
As described by WisdomTree, eligible companies must:
- Be investable by foreign institutions regarding corporate, industry and country rules.
- Have a market capitalization of at least $100 million, an average daily dollar volume of at least $100,000 for three months preceding the annual index reconstitution and a monthly volume above 250,000 shares for six months.
- Not be in the bottom decile of a risk score based on quality (profitability ratios) and momentum (6 and 12 months risk-adjusted returns).
- Not be in the top 5% of the stock universe in yield and in the riskiest half regarding the above-mentioned score.
- Be in the bottom 25% of the stock universe in market capitalization.
- Have paid regular cash dividends in the 12 months preceding the annual reconstitution.
The index uses a modified capitalization-weighted methodology.
The two heaviest countries are Taiwan (25.2% of asset value) and China (18.9%). They weigh about 44% together, which represents a too large geopolitical risk in my opinion. Then, come South Korea and South Africa, with about 11% each. Other countries are below 7%. The next chart lists the top ten countries, with an aggregate weight of 93%.
DGS countries (chart: author; data: WisdomTree)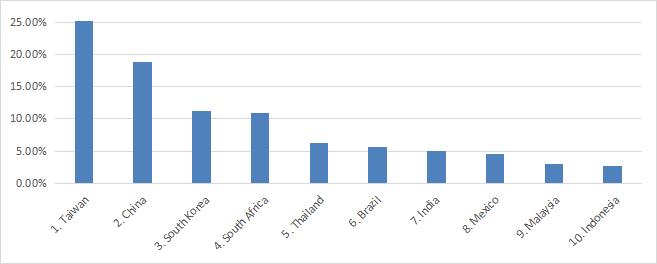
The top 3 sectors are technology, financials and industrials (each between 14% and 17%). Materials and consumer discretionary weigh between 10% and 12%. Other sectors are below 7% individually and 31% in aggregate.
DGS sector breakdown (chart: author; data: WisdomTree)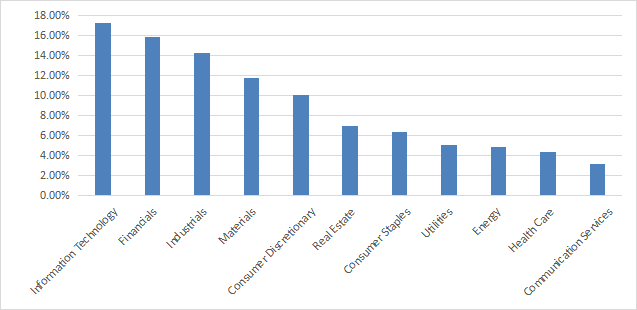
The top 10 holdings, listed below, represent 9% of asset value. The top name is below 1.5%, so risks related to individual stocks are very low.
|
Name |
Ticker |
Weight |
|
Growthpoint Properties Ltd. |
GRT SJ |
1.46% |
|
Thungela Resources Ltd. |
TGA SJ |
1.27% |
|
Banco Del Bajio Sa |
BBAJIOO MM |
1.03% |
|
China Galaxy Securities Co., Ltd. |
6881 HK |
0.88% |
|
Transmissora Alianca de Energia Eletrica SA |
TAEE11 BS |
0.80% |
|
Old Mutual Ltd. |
OMU SJ |
0.77% |
|
China Minsheng Banking Corp Ltd. |
1988 HK |
0.71% |
|
Truworths International Ltd. |
TRU SJ |
0.71% |
|
African Rainbow Minerals Ltd. |
ARI SJ |
0.70% |
|
GS Holdings Corp. |
078930 KS |
0.65% |
Aggregate valuation ratios look cheap: the P/E ratio is about 7, and the price-to-book is close to 1. It doesn’t mean it is cheap. Compared to developed countries, and especially to the U.S., emerging markets trade at large discounts because of higher political and economic risks. Unless these risks disappear, the gap has no reason to close. And if they disappear in a country, it will not be emerging any more.
Past performance
The next table compares DGS since inception with 3 emerging markets ETFs: the Vanguard Emerging Markets Stock Index Fund (VWO), the iShares MSCI Emerging Markets ETF (EEM) and the SPDR Portfolio Emerging Markets ETF (SPEM).
|
since DGS inception |
Total Return |
Annual Return |
Drawdown |
Sharpe |
Volatility |
|
DGS |
61.63% |
3.21% |
-60.17% |
0.23 |
21.75% |
|
VWO |
17.62% |
1.07% |
-66.27% |
0.11 |
21.61% |
|
EEM |
9.26% |
0.58% |
-65.35% |
0.08 |
21.94% |
|
SPEM |
24.32% |
1.44% |
-63.35% |
0.13 |
21.43% |
Data calculated with Portfolio123
DGS beats them all. In this time interval, emerging markets have lagged the S&P 500 by a wide margin: SPY shows a total return of 263% (8.9% annualized).
DGS vs emerging markets ETFs since inception (Portfolio123)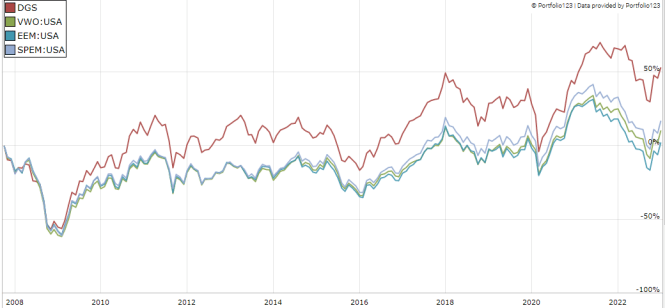
DGS has also been leading this list in the last 12 months:
DGS vs emerging markets ETFs, last 12 months (Portfolio123)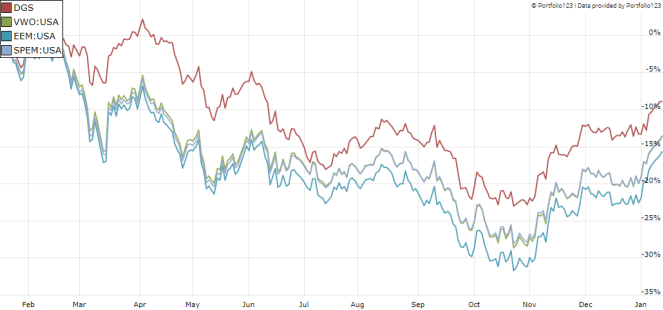
DGS share price is close to flat since inception (see next chart). However, in inflation-adjusted value, it has lost over 40%: the cumulative inflation since 2008 is about 38%.
DGS share price (TradingView on SeekingAlpha)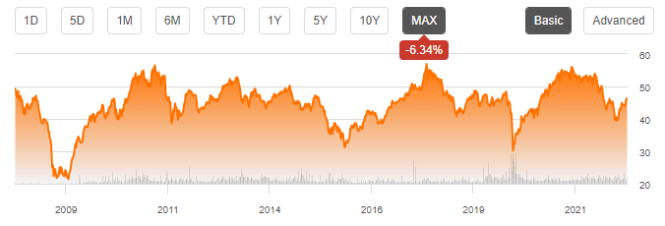
The sum of annual distributions has increased from $1.46 to $2.35 between 2012 and 2022. The 10-year annualized dividend growth rate is 4.9%. It is a bit below a US dividend benchmark: the SPDR S&P Dividend ETF (SDY) has an annualized dividend growth rate of 5.3% for the same period. The Vanguard Dividend Appreciation ETF (VIG) is at 7.7%.
Takeaway
DGS is a small-cap dividend ETF in emerging markets. It seeks to avoid some yield traps by eliminating the worst companies regarding a risk score based on momentum and quality. The sector breakdown is quite balanced: no sector weigh more than 17%. However, the fund has a very large exposure to geopolitical risks related to China: Taiwan and China weigh over 44% together. Moreover, despite beating emerging markets benchmarks, total return and dividend growth are underwhelming. On the short-term, DGS may benefit from a bullish pattern in emerging markets, this is why I don’t rate it a “sell” now.
For transparency, a dividend-oriented part of my equity investments is split between a passive ETF allocation and my actively managed Stability portfolio (14 stocks), disclosed and updated in Quantitative Risk & Value.
Be the first to comment