

NicoElNino
Vanguard is one of the most well-known investment houses offering low-cost ETFs and mutual funds. The Vanguard Total Stock Market ETF (NYSEARCA:VTI) and Vanguard S&P 500 ETF (VOO) are 2 of Vanguard’s largest ETF products. Between the two, there is almost $2 trillion in assets under management (AUM), as VTI has $1.1 trillion in AUM while VOO has $778.21 billion in AUM. Both are quality funds, but when it comes to choosing VTI or VOO, the devil is in the details. These products are similar in many ways, but just because they are similar doesn’t mean their outcomes are the same. While VTI has a larger AUM pool of $321.79 billion, I prefer VOO between the 2 funds. VTI has been a great investment vehicle, but I am cheap and don’t like leaving anything on the table when it comes to index and total market funds. I will go through all of the numbers and outline how VOO has been a slightly better investment over the years.
Total market and S&P 500 index funds, what’s the difference?
Many investment houses offer total market and S&P 500 index funds. It’s important to know the difference between the two as just the premise of the fund could align more with how an investor is looking to invest their capital or diversify their investments.
VTI (Total Market Fund)
VTI employs an indexing investment approach designed to track the performance of the CRSP US Total Market Index, which represents approximately 100% of the investable U.S. stock market and includes large-, mid-, small-, and micro-cap stocks.
VOO (S&P 500 Index Fund)
VOO employs an indexing investment approach designed to track the performance of the Standard & Poor’s 500 Index. The S&P 500 is made up of 500 of the largest companies whose stocks trade on the NYSE, Nasdaq, or Cboe. To be included in the S&P 500 a company’s market cap must be a specific size, most of its shares are in the public hands, there is a track record of positive earnings going back 4 quarters, and at least 250,000 of its shares trade in each of the previous 6 months. As of March, the minimum market cap to be included in the S&P 500 was $14.6 billion.
S&P 500 index funds are much more concentrated funds than total market funds. VTI currently has 4,098 stocks within its portfolio with a median market cap of $114.7 billion. VOO has 503 stocks within its portfolio with a median market cap of $161.1 billion.
Vanguard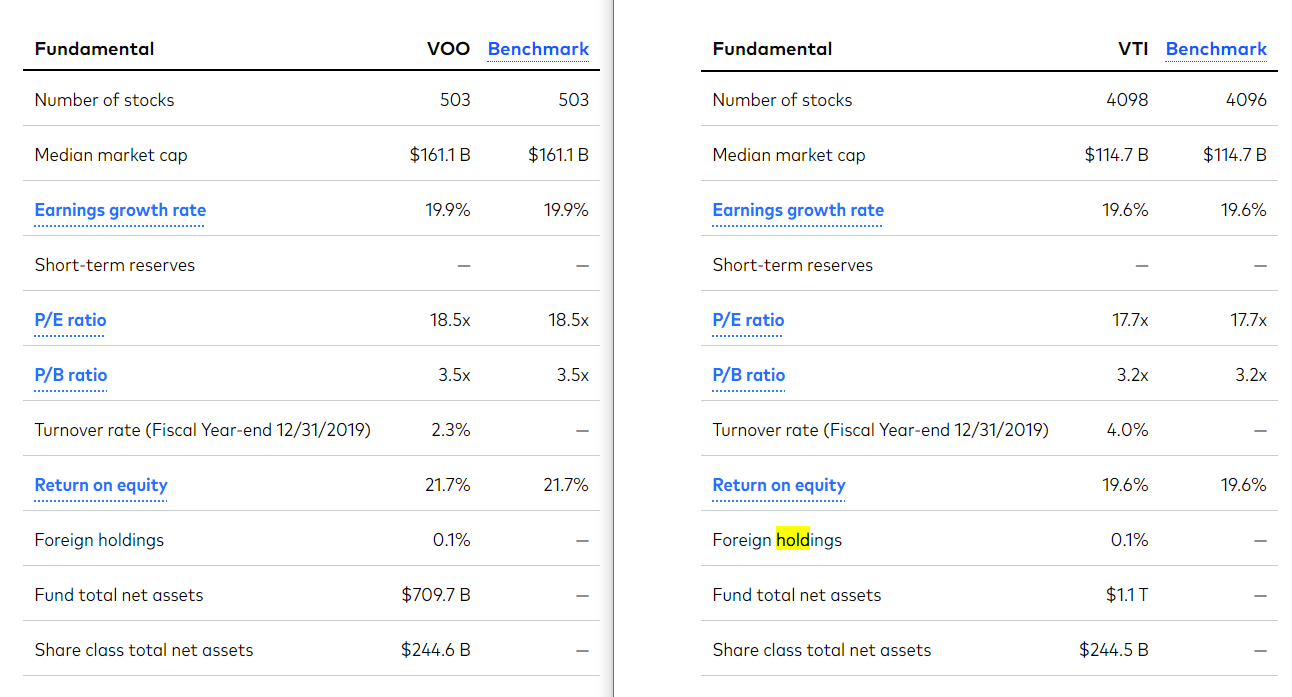
Comparing VTI to VOO across their previous performance
As investors, we allocate capital in public markets to generate a positive return on investment through capital appreciation. VTI and VOO have almost mirrored each other over the previous decade, tracking the market cycles in lockstep, but VOO has slightly outperformed VTI. Since July 2012, VOO has appreciated by 184.21%, while VTI has appreciated by 176.20%. Both have been stellar investments but several percent here and there certainly add up and can make a difference.
Seeking Alpha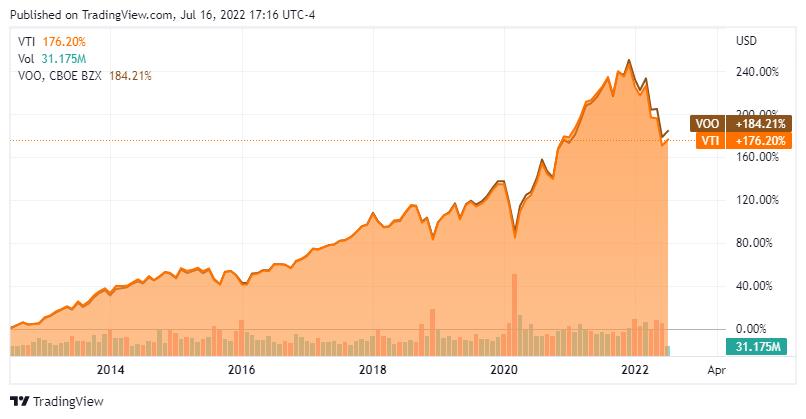
I am taking the following data directly from Vanguard’s website utilizing their comparison tool. As of the end of Q2 (June 30th, 2022), VOO has had an average annual return of 12.92% over the previous decade, while VTI’s average annual return has been 12.52%. Over a 5-year period, VOO has appreciated at an annualized rate of 11.28% compared to 10.52% from VTI. The differences may be small when comparing the percentages, but every percentage point counts. On $100,000 a 10.52% return would be $10,520 whereas an 11.28% return would be $11,280. That’s a $760 annual difference, and over 5 years that becomes a difference of $3,800.
The recent year hasn’t been great as many funds are in the red. The first half of 2022 was the worst start for stocks in 50 years. Over the past year, VTI has declined by -14.23% compared to -10.61% for VOO. Looking at 2022, YTD VTI has declined by -21.36%, while VOO declined by -19.98%.
Based strictly on performance, VOO comes out on top. VTI has trailed VOO in annualized rate of return and declined further during this bear market. Both a great funds, managed by one of the best investment houses, but the numbers don’t lie, and VTI comes up short on both metrics.
Vanguard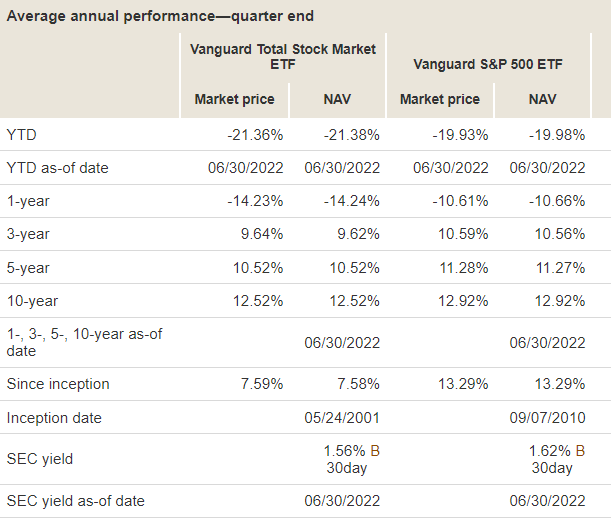
Comparing VTI and VOO’s characteristics
Both VTI and VOO have an expense ratio of 0.03%. It doesn’t get better than this, as 0.03% is incredibly cheap. The average expense ratio of similar funds is 0.80%. If you were to invest $10,000 in VTI, you would pay $3 in year 1 as opposed to $80 in management fees based on the average of similar funds. Assuming a 5% annual return, you would end up paying $39 over 10 years in management fees with both VTI or VOO. Vanguard has one of the most attractive expense ratios for an ETF product.
Vanguard
VTI has 22.47% of its assets concentrated in its top 10 positions, while VOO has 26.5% of its assets spread throughout its top 10 positions. The top 10 lists are almost identical, except VTI has Meta Platforms (META) in the #10 spot while VOO has Nvidia (NVDA). Other than that, these are identical lists except for where some holdings show up.
Steven Fiorillo, Vanguard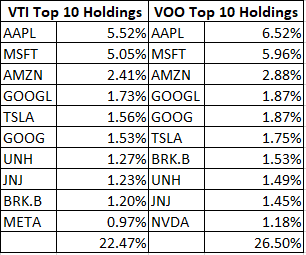
As of 6/30/22, the 30-day SEC yield on VTI was 1.56%, while it was 1.62% for VOO. This is another scenario where someone may look at the.06% differential and think it’s not a big deal, but over time it could be. Many investors have their dividends reinvested with funds such as VTI and VOO. I, for one, want my dividends to buying as many shares as possible when they are reinvested. On a $100,000 investment, prior to compounding, VTI’s yield would generate $1,560 in dividends while VOO generates $1,620 in dividends. Yield isn’t everything $60 here and $60 there matter over the long run.
I built out two tables, VTI is the 1st table, and VOO is the 2nd table below. Without compounding the quarterly dividends, I will show how much of a difference .06% on the yield and 0.76% on the annualized return really makes. The way these tables are constructed is simple, I am using $100,000 as the initial investment, multiplying that by the 5-year annualized return and the dividend yield, then adding all 3 figures together for the ending balance for that year. $100,000 invested in VTI would have grown to $176,864.48, while $100,000 in VOO would have grown to $183,429.72. In year 1 alone, the difference is $820, while over a 5-year period, the difference is $6,565.25.
Please keep in mind that past history is not a guarantee of future performance. This can only be used as historical information to aid in the decision-making process. These are the types of things I would look at if I was putting new capital to work and deciding on a fund to invest it in. It’s hard to make a case for VTI when VOO is slightly better in many different categories, which historically has led to slightly larger gains.
Steven Fiorillo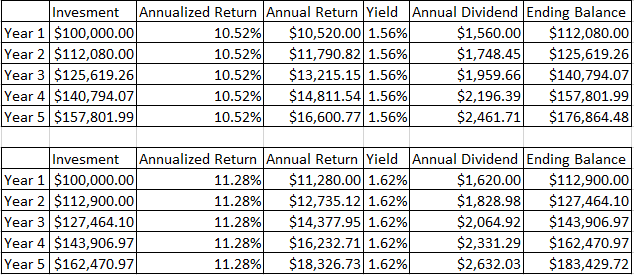
If you go back to the table I inserted from Vanguard, VTI had an annualized return of 12.52% over a 10-year period, while VOO’s was 12.92%. This is a difference of 0.4% rather than 0.76% in the 5-year figures. If I use this rate of return in the same table and keep the yield the same, there is still a $3,927.07 difference between VTI and VOO over the first 5 years.
Steven Fiorillo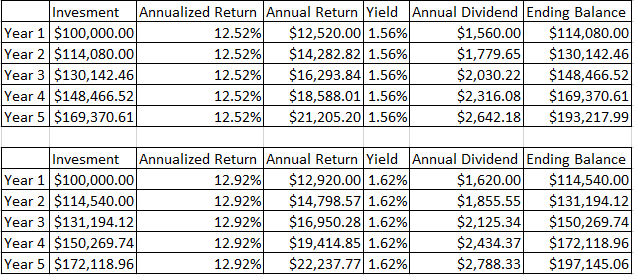
Conclusion
VTI is a great investment product that has generated substantial gains for investors. After comparing VTI, which is a total market fund, to VOO, which is a concentrated S&P 500 index fund, it’s hard to make a case for investing in VTI when VOO is an option. The diversification outside of the S&P across all the investable companies within the U.S hasn’t mitigated downside risk during the bear market as VTI has declined further than VOO in the past year and YTD periods. Over the past 5- & 10-year periods, VTI has slightly appreciated less than VOO and has slightly less yield from its dividend. After comparing VTI to VOO an investor would have left a few percentage points on the table over the years of investing in VTI. If I was putting new capital to work and selecting a new ETF, it would be hard to select VTI over VOO as the historical data would sway my decision. I am not bearish on VTI by any means, but I am more bullish on VOO for the reasons I outlined in this article.
Be the first to comment