

Scott Olson
It’s been a rough year thus far for the restaurant industry, and some weakness was to be expected in H1 2022, with the industry having to come up against re-opening traffic and government stimulus in some markets. These difficult comps were worsened by commodity/labor inflation which impacted margins. Still, the two newest headwinds which could lead to degradation in demand are higher gasoline prices and mortgage payments. This does not bode well for casual diners like Bloomin’ Brands (NASDAQ:BLMN), and its FY2022 guidance mid-point looks like it could be on the optimistic side. So, while the stock is cheap, I think investors would be wise to be patient for a better entry point.
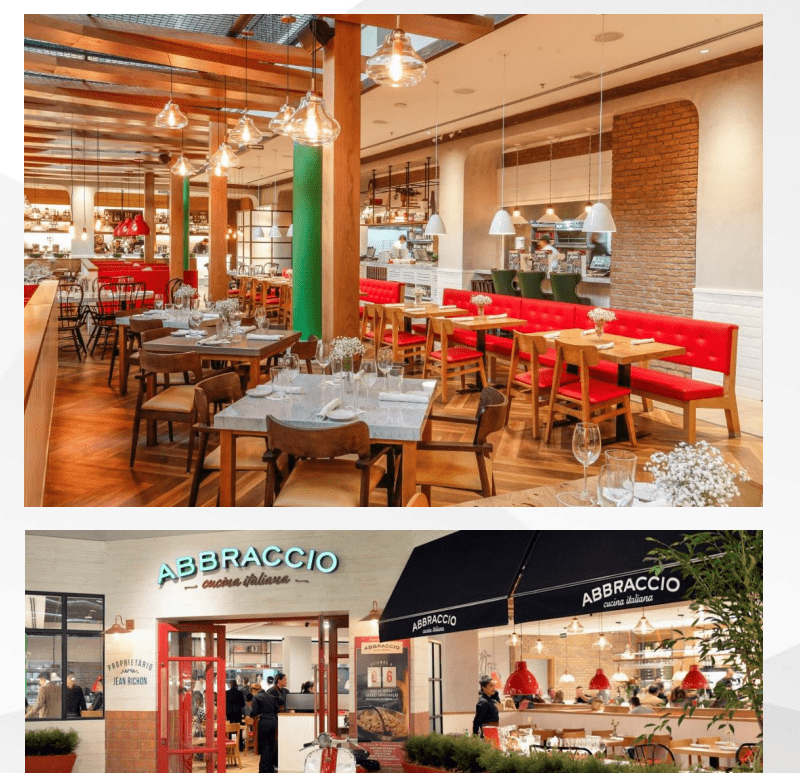
Abbracio’s Restaurant (Company Website)
Just over five months ago, I wrote on Bloomin’ Brands (“Bloomin”), noting that the stock’s valuation was becoming more attractive after a 45% decline and that dips below $1.30 would offer low-risk buying opportunities. The decline in late May below this level offered a 25% rally in a week, but the stock has begun to change its character a little recently. This is based on the stock decisively breaking below $17.30 and putting together a relatively lethargic bounce since this breakdown (compared to the May support test). Given this change of character and what appear to be less favorable traffic trends, I have moved from Bullish at $17.30 to Neutral. Let’s take a closer look below:
Q1 Results
Bloomin’ put together a solid quarter in Q1, reporting quarterly revenue of ~$1.14 billion, a 16% increase from the year-ago period. This was driven by a 5.6% increase in pricing, a 6.9% increase in its mix, and a 1.5% increase in traffic, translating to 14% same-restaurant comps in the United States (Outback, Fleming’s, Bonefish, Carrabba’s). Notably, this was despite what was estimated to be a 300 basis point headwind from the Omicron variant and unfavorable weather. Overall, these were very solid results and were helped by continued stickiness in off-premise as well as a return to dining in for guests within some markets. In Brazil, results were also solid at Abbracio’s, with comps up 36%, albeit lapping very easy comps due to restrictions in the year-ago period.
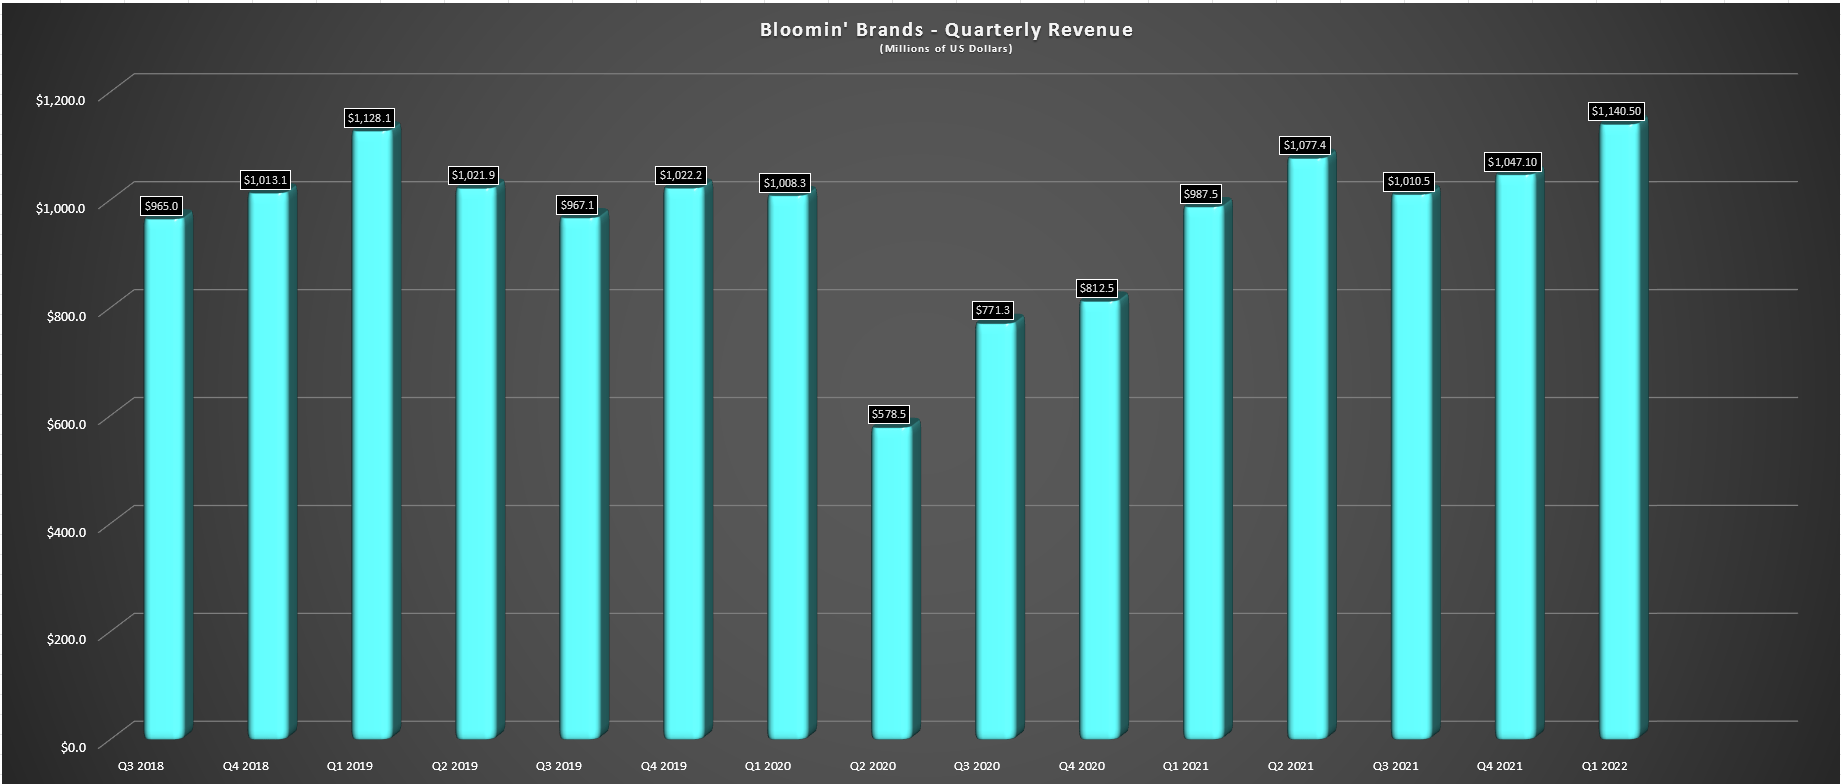
Bloomin Brands – Quarterly Revenue (Company Filings, Author’s Chart)
Most importantly, while the company’s Q1 results were strong, Bloomin’ emphasized that its consumer was healthy, and it was actually seeing check growth from switching up to higher-ticket menu items and also the benefit of the switch back to in-restaurant dining, which carries a slightly higher average check. While this certainly benefited same-store sales on the back of relatively flat traffic (1.5%), this could be a difficult benefit to sustain with what appears to be a much weaker macro environment. Despite staring down what could end up being a tougher environment, the company guided for $505 million to $525 million in annual EBITDA, representing only a slight decline from FY2021 levels despite elevated commodity and labor inflation.
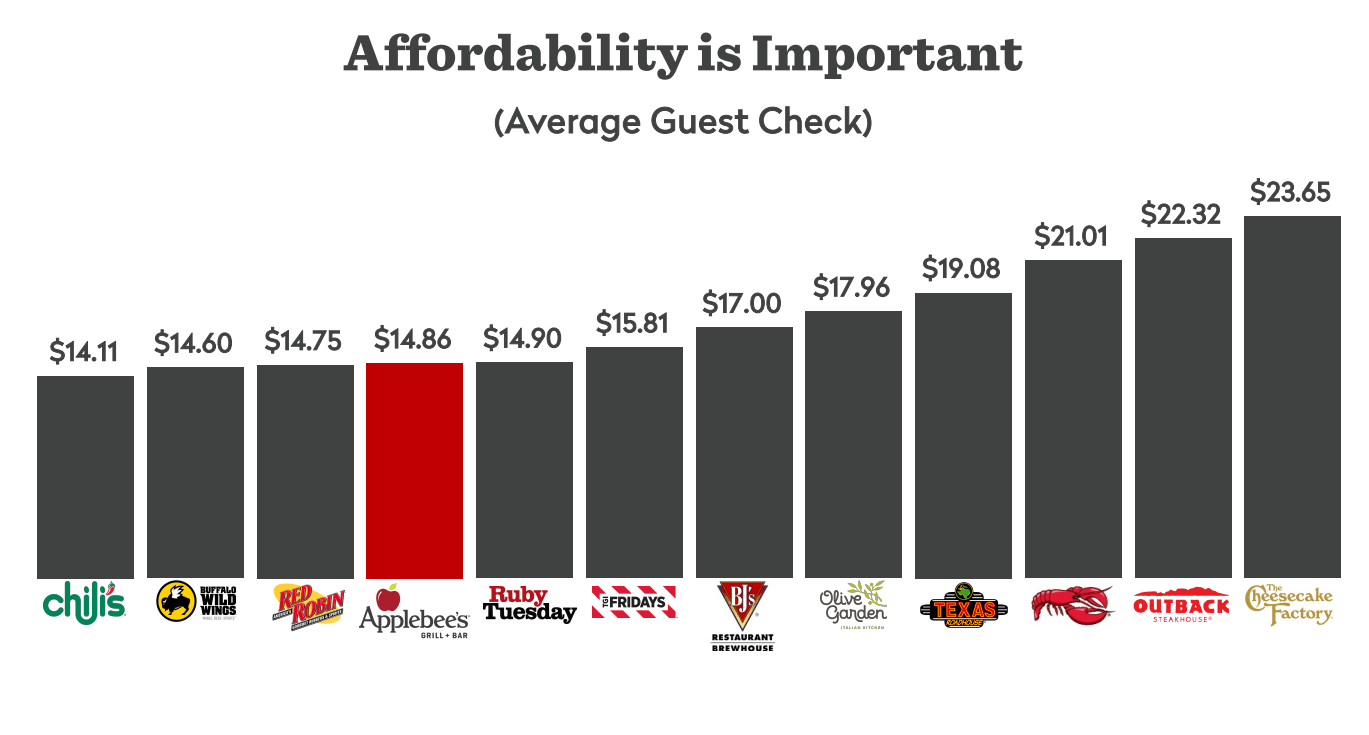
Casual Dining Average Check Historical (Dine Brands Presentation)
Bloomin’ has made it clear that it’s been conservative on pricing and is pricing at or below the competition on items, with menu prices 5.6% higher in Q1 and closer to ~6.0% in Q2/Q3. Theoretically, this should make it an attractive choice within the upper casual dining space, even if it is in the higher portion of the industry on average guest check, closer to Cheesecake Factory (CAKE) and Red Lobster. However, while pricing at or below competition on menu items is important, especially if the quality is there, it doesn’t help if some consumers decide to trade down or cut out a casual dining visit altogether as discretionary budgets shrink. Hence, it will be essential to see if the commentary is as ebullient in the Q2 results.
Industry Headwinds and Q2 Trends
While the Q1 results and accompanying commentary were quite positive, one could argue that a lot has changed since late April. In addition to rising gasoline prices in the United States ($4.60/gallon vs. $4.20/gallon), mortgage rates have continued to increase, and the Consumer Price Index soared to 9.1% in June. This increase in grocery prices, gas prices, and mortgage payments is painting a picture of a weaker average consumer, especially when combined with personal savings rates that have dwindled from their spikes during the lockdowns.
United States Personal Savings Rates (TradingEconomics.com, BLS)
This increase in everyday costs for consumers is likely to lead to a shrinking discretionary budget, which might not be a huge issue if casual dining brands were working from a position of strength. However, with commodity inflation up double-digit levels and what’s continued to be a tight labor market in the hospitality industry, several brands are being forced to raise menu prices to protect their margins. So, what appears to be a weaker average consumer is coming up against ~3-7% higher menu prices across the casual dining category. So, as budgets are shrinking and consumers might look to cut expenses a little, dine-out occasions are becoming more expensive.
As discussed in my June article on Dutch Bros (BROS), I noted that this could lead to weaker traffic trends, giving restaurant companies less leverage than they enjoyed in Q4 2021 and Q1 2022 on the back of solid Q1 results. Based on the recent research from Black Box Intelligence, this appears to be the case. In fact, Black Box reported that half of all states experienced negative sales growth in the third week of June, and this marked the 15th consecutive week of negative sales growth. While check growth continued, helped by higher menu pricing across the board, casual dining and family were the two segments that reported negative sales growth during the week.
It’s important to note that negative sales growth means that traffic was down so significantly that it actually outpaced the menu price increases for the segment, which were up close to 5% across the board based on Q1 commentary. This is a significant degradation in traffic, and these statistics were ahead of the recent 9.1% CPI figure, and we haven’t seen much moderation in gasoline prices since late June. For this reason, I would not expect to see much improvement in traffic in July, which could set up restaurants for a satisfactory Q2, but what I would imagine will be more cautious commentary for Q3.
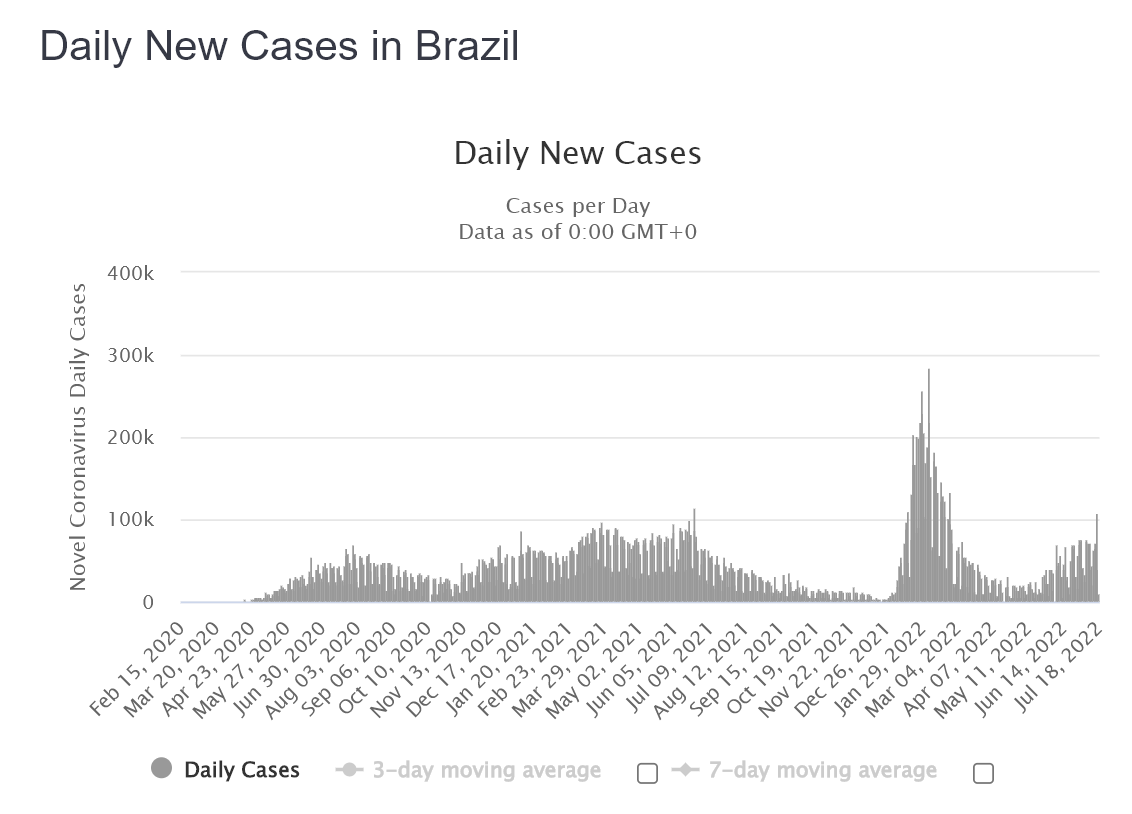
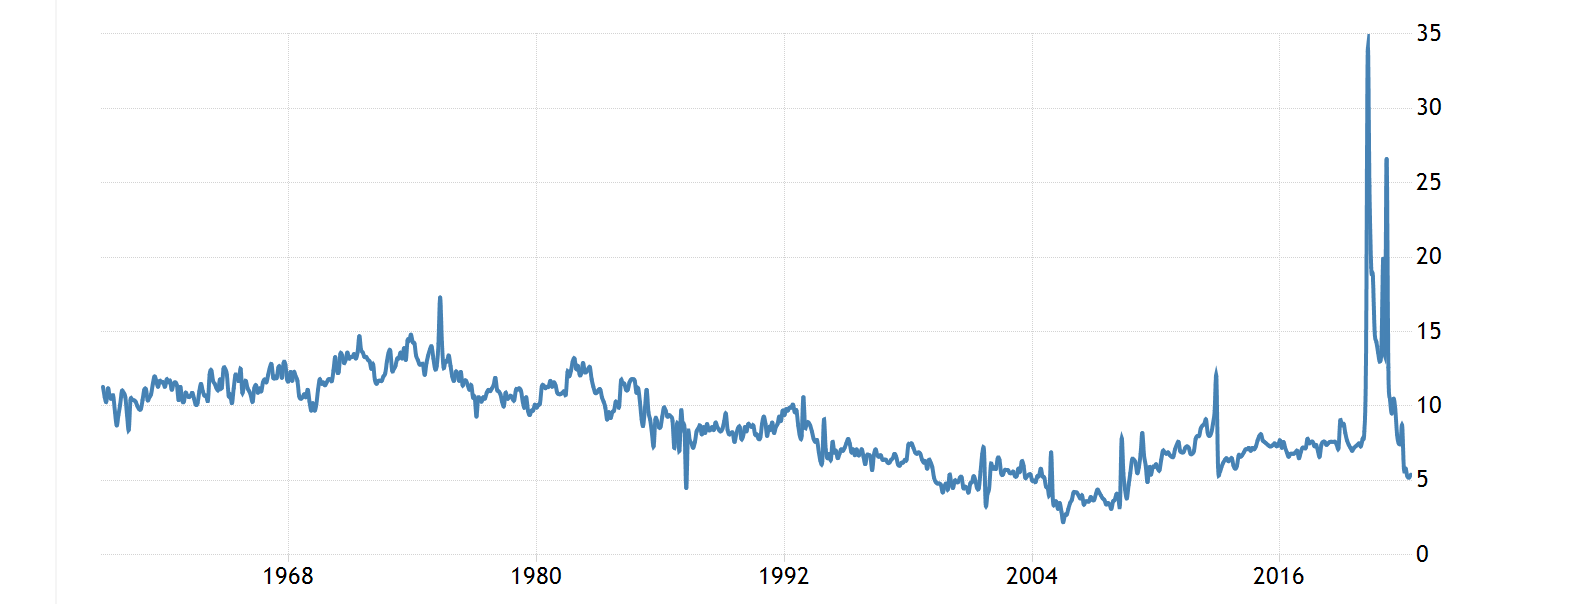
Brazil COVID-19 Cases (Worldometers.Info)
For brands that didn’t guide higher and were ultra-conservative, this might not be an issue. However, Bloomin’ came out of the gate in Q1 strong, prompting it to raise its full-year guidance. If Bloomin’ can buck the trend despite a higher average check, this could end up not being a mistake. However, based on what we see from industry traffic trends, I would be quite surprised if this was the case. Meanwhile, with COVID-19 cases steadily rising in Brazil since May (~55,000 cases vs. ~10,000 cases), this could be a further headwind for Abbracio’s (Brazilian Carrabba’s) and Outback Brazil. Let’s look at Bloomin’s valuation to see if this looks priced into the stock:
Valuation
Based on ~89 million shares and a share price of $17.90, Bloomin’ Brands trades at a market cap of ~$1.59 billion (enterprise value: ~$3.6 billion), a 50% off sale from its highs made in Q2 2021. This has left the stock trading at an EV/EBITDA ratio of ~7.0, which is down substantially from its long-term average of ~10.0x EV/EBITDA. However, with this being one of the most difficult environments for restaurants in years, I don’t see any reason that Bloomin’ would trade at its historical EV/EBITDA multiple. Instead, I believe a more conservative multiple is 8x EV/EBITDA, a 20% discount to this multiple to factor in the challenging operating environment for casual dining names.
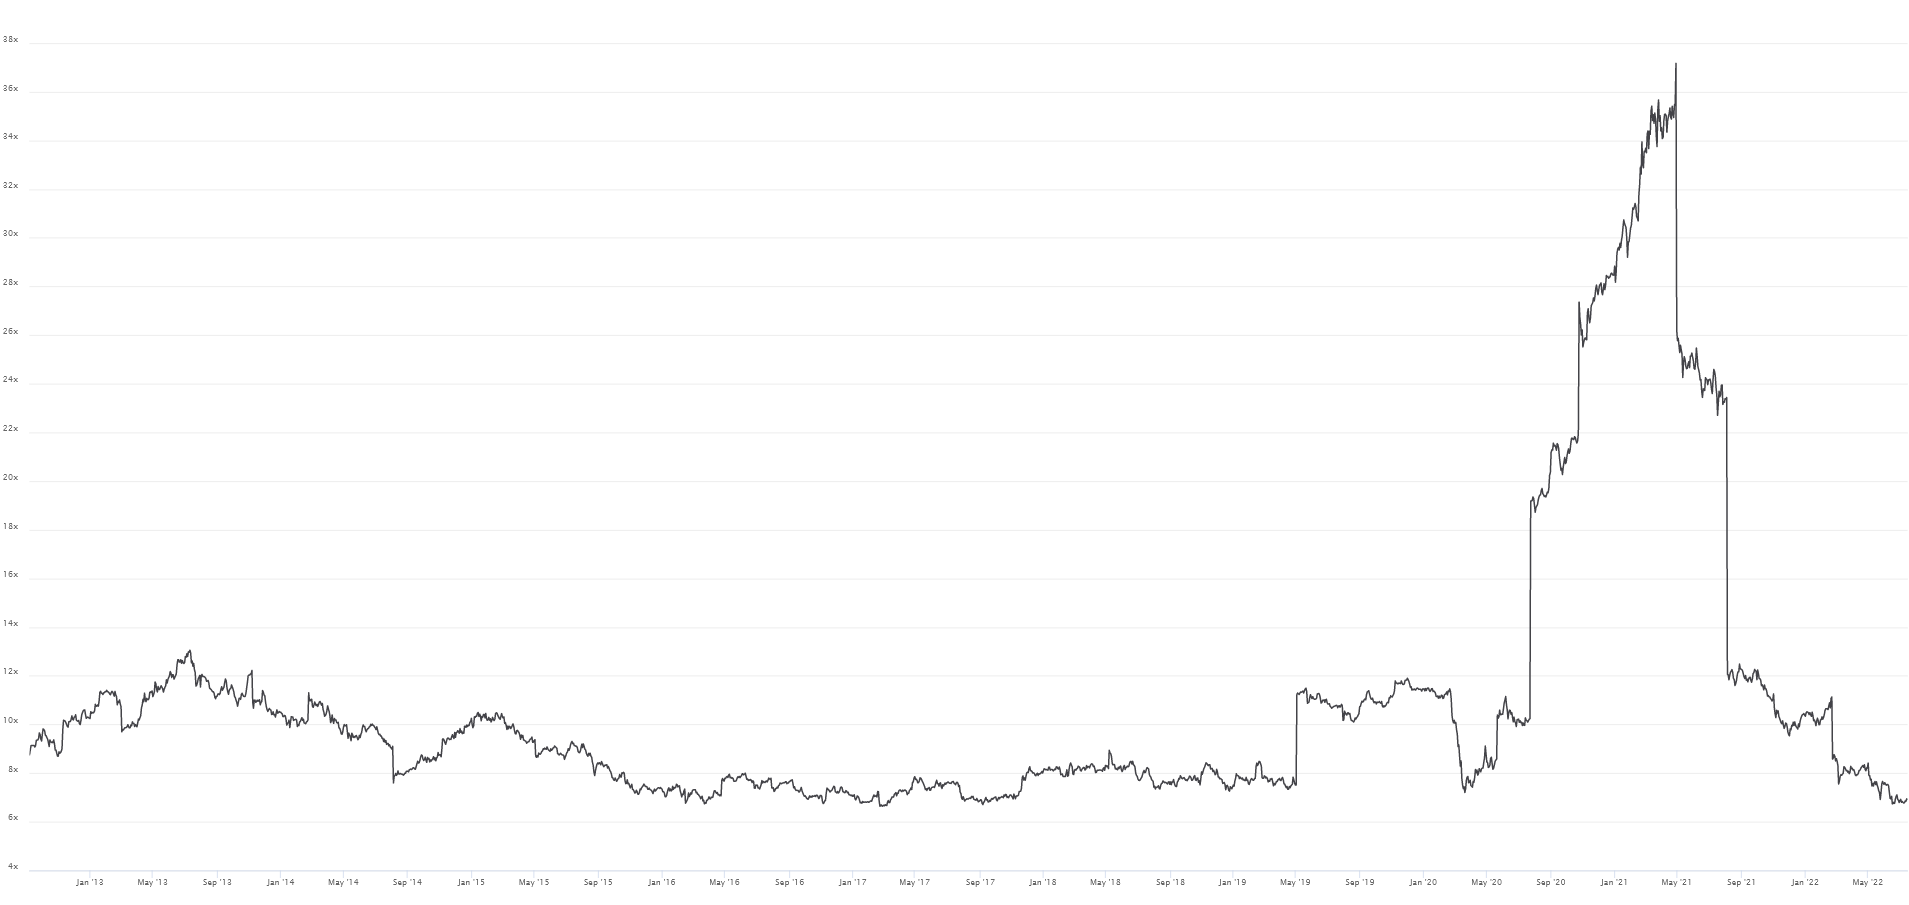
Bloomin Brands – Historical EBITDA Multiple (TIKR.com)
Based on FY2022 annual EBITDA estimates of ~$505 million, this would translate to an enterprise value of $4.0 billion, pointing to less than 20% upside from current levels (~$22.80 per share). In my view, this isn’t nearly enough margin of safety to justify being long the stock, especially with traffic trends continuing to worsen for casual dining. In fact, when it comes to mid-cap stocks that are not industry leaders, I prefer a minimum 35% discount to fair value to bake in a margin of safety, which would require a dip below $14.70 per share.
Technical Picture
Looking at BLMN’s technical picture, there’s not a lot to like here, with BLMN recently breaking below a major support level at $17.20 – $17.90. This support area was prior resistance in Q3 2020 and was a major support level from 2017 through 2019 on any sharp pullbacks. Often, prior support levels, once broken, will become new resistance levels. This is because investors buying off this key support area could become anxious to sell once they return to break even or a profit. So, not only has this taken away the one major support level left below the stock potentially, but it’s created a potential new resistance area overhead.
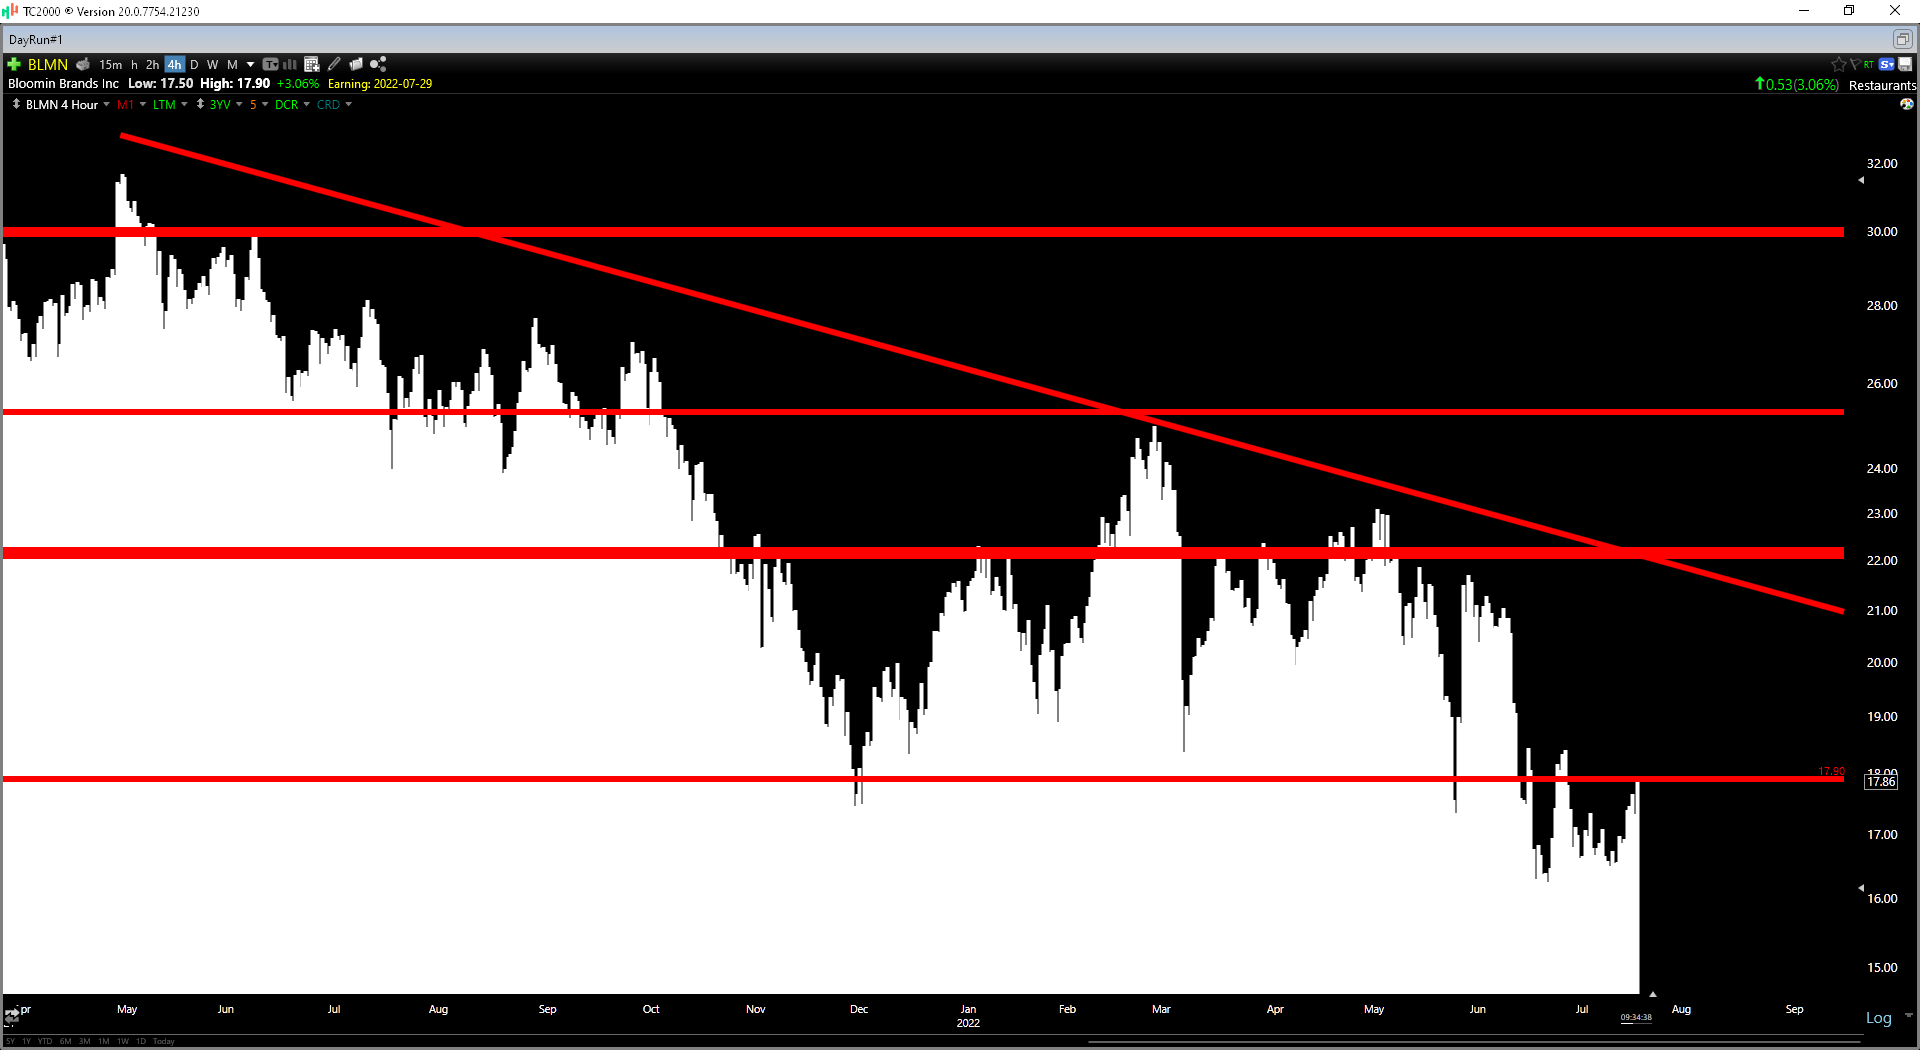
BLMN Daily Chart (TC2000.com)
As the chart above shows, Bloomin’ broke down from this key support area and has now rallied back to re-test this area just ahead of its Q2 results in the next couple of weeks. Given the high short interest (~13%), it’s certainly possible that the stock could put together a bounce if its Q2 report comes in better than expected. However, I would view any sharp rallies above $21.00 as an opportunity to book profits. In addition, I don’t see the reward/risk as compelling heading into earnings, with the potential that negative traffic trends could make it a little more difficult to meet guidance provided in Q1 ($515 million mid-point).
Summary
Bloomin’ Brands appears like one of the most attractive value plays in the sector currently, trading at barely 7x EV/EBITDA and less than 8x FY2022 earnings estimates. However, with traffic trends flipping negative and things not appearing to be any easier for the average consumer, I’m less optimistic that BLMN can meet its guidance mid-point, and I would not be surprised to see a lower low in the stock (below $16.00) before year-end. So, for investors looking to buy the stock to lock in a ~3.0% dividend yield, I believe patience is the best course of action, and I would expect sharp rallies to provide profit-taking opportunities.
Be the first to comment