

Chris Ryan
This dividend ETF article series aims at evaluating products regarding the relative past performance of their strategies and quality metrics of their current portfolios. As holdings and weights change over time, I post updated reviews when necessary.
VSDA strategy and portfolio
The VictoryShares Dividend Accelerator ETF (NASDAQ:VSDA) has been tracking the Nasdaq Victory Dividend Accelerator Index since 04/18/2017. It has a portfolio of 74 stocks, a 12-month distribution yield of 1.73%, and a net expense ratio of 0.35%. Distributions are paid monthly.
As described by Victory Capital:
The Index screens companies in the Parent Index using a number of proprietary fundamental factors that have been identified by a quantitative multi-factor selection process to identify dividend paying companies with a higher probability of future dividend growth. Within this smaller set of companies, the Index weights the constituent securities using a methodology designed to maximize dividend growth, measured at a portfolio level, within established portfolio constraints (such as maximum weightings of index constituents and sectors). The Index is reconstituted every April and rebalanced quarterly.”
VSDA is exclusively invested in U.S. companies, 60.6% in large companies, 36% in mid-caps, and 3.4% in small caps.
The heaviest sector is industrials (29.2%), followed by consumer staples (18.8%), technology (13%) and healthcare (11.6%). Other sectors are below 10%. Compared to the S&P 500 index (SPY), VSDA overweights industrials, consumer staples, and materials. It underweights the most technology, communication, energy and totally ignores real estate.
Sector breakdown in % (Chart: author – data: Victory Capital)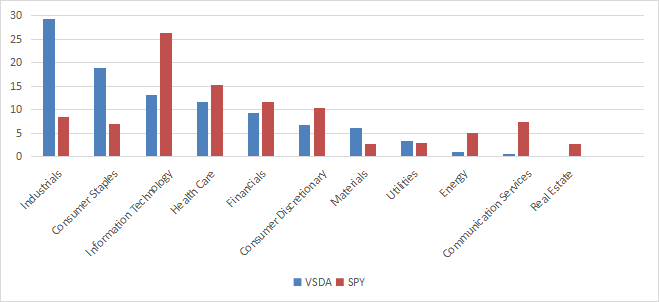
The top 10 holdings, listed below, weigh 27.9% of asset value. The top name is under 4%, so risk related to individual stocks is moderate:
|
Ticker |
Name |
Weight% |
EPS growth %TTM |
P/E TTM |
P/E fwd |
Yield% |
|
3M Co. |
3.46 |
12.68 |
11.25 |
12.66 |
4.62 |
|
|
Lincoln Electric Holdings, Inc. |
3.39 |
67.25 |
21.19 |
19.13 |
1.63 |
|
|
Aon plc |
3.06 |
226.82 |
24.24 |
23.70 |
0.72 |
|
|
Cisco Systems, Inc. |
2.81 |
2.87 |
17.79 |
13.87 |
3.09 |
|
|
Emerson Electric Co. |
2.68 |
41.56 |
18.13 |
24.05 |
2.12 |
|
|
Consolidated Edison, Inc. |
2.63 |
42.49 |
20.69 |
21.74 |
3.20 |
|
|
Elevance Health, Inc. |
2.60 |
14.38 |
18.85 |
16.55 |
1.07 |
|
|
Donaldson Co., Inc. |
2.50 |
16.48 |
22.17 |
20.46 |
1.51 |
|
|
Mastercard, Inc. |
2.43 |
23.12 |
37.74 |
35.87 |
0.60 |
|
|
Apple, Inc. |
2.37 |
8.83 |
21.88 |
21.63 |
0.69 |
Performance
The next table compares VSDA since inception in April 2017 with SPY and several dividend growth ETFs:
|
Total Return |
Annual Return |
Drawdown |
Sharpe ratio |
Volatility |
|
|
VSDA |
95.53% |
12.45% |
-32.11% |
0.7 |
16.42% |
|
SPY |
83.30% |
11.18% |
-33.72% |
0.59 |
17.66% |
|
90.49% |
11.93% |
-31.72% |
0.69 |
15.77% |
|
|
89.84% |
11.87% |
-35.10% |
0.67 |
16.62% |
|
|
94.70% |
12.36% |
-32.04% |
0.7 |
16.37% |
|
|
88.48% |
11.73% |
-40.60% |
0.53 |
21.56% |
|
|
84.07% |
11.26% |
-35.43% |
0.62 |
16.75% |
Data calculated with Portfolio123
VSDA is the best performer by a very short margin, almost on par with the WisdomTree U.S. Dividend Growth Fund (DGRW). All dividend growth funds in the list beat SPY.
VSDA has been ahead of both SPY and DGRW in the last 12 months:
VSDA vs. SPY and DGRW, last 12 months (Portfolio123)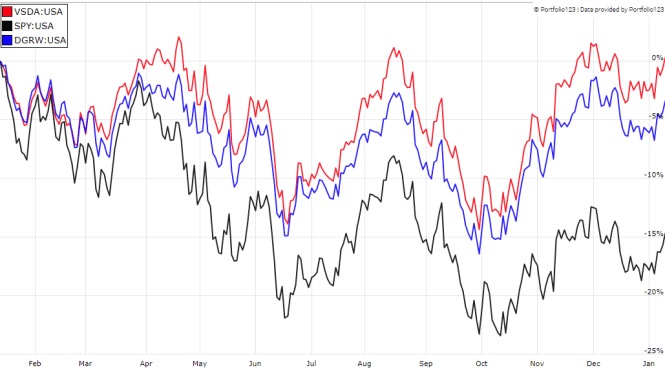
The sum of annual distributions has increased from $0.47 to $0.82 per share between 2018 and 2022. The annualized dividend growth rate during this period is 14.9%, which is excellent. As a reference, the Vanguard Dividend Appreciation Fund (VIG), very popular among dividend-growth investors, shows an annualized dividend growth rate of 9.9% at the same time.
Comparing VSDA with a reference strategy based on dividend and quality
In previous articles, I have shown how three factors may help cut the risk in a dividend portfolio: Return on Assets, Piotroski F-score, and Altman Z-score.
The next table compares VSDA since inception with a subset of the S&P 500: stocks with a dividend yield above the average of their respective indexes, an above-average ROA, a good Altman Z-score, a good Piotroski F-score and a sustainable payout ratio. It is rebalanced quarterly to make it comparable with VSDA index.
|
Total Return |
Annual Return |
Drawdown |
Sharpe ratio |
Volatility |
|
|
VSDA |
95.53% |
12.45% |
-32.11% |
0.7 |
16.42% |
|
Dividend quality subset |
98.67% |
12.76% |
-34.26% |
0.65 |
18.37% |
Past performance is not a guarantee of future returns. Data Source: Portfolio123
VSDA slightly lags the S&P 500 dividend and quality subset. However, the difference in annualized returns is insignificant, which is a good point for the fund. My core portfolio holds 14 stocks selected in this subset (more info at the end of this post).
Valuation and Quality
Valuation metrics are mixed. The fund is more expensive than the S&P 500 regarding the price-to-book and price-to-cash-flow ratios.
|
VSDA |
SPY |
|
|
P/E TTM |
19.5 |
20.05 |
|
Price/Book |
4.61 |
3.79 |
|
Price/Sales |
1.92 |
2.4 |
|
Price/Cash Flow |
18.03 |
14.97 |
Data: Fidelity
In my ETF reviews, risky stocks are companies with at least 2 red flags: bad Piotroski score, negative ROA, unsustainable payout ratio, bad or dubious Altman Z-score, excluding financials and real estate where these metrics are unreliable. VSDA has only one risky stock regarding these criteria: Walgreens Boots Alliance (WBA). It weighs 0.76% of asset value, which is negligible.
Regarding my preferred quality metrics, VSDA is superior to the S&P 500 (see weighted averages in the next table). The return on assets is significantly above the benchmark.
|
VSDA |
SPY |
|
|
Atman Z-score |
4.70 |
3.48 |
|
Piotroski F-score |
5.85 |
5.64 |
|
ROA % TTM |
11.11 |
7.8 |
Takeaway
VSDA is a dividend growth fund with a portfolio of 74 large and mid-cap stocks. Industrials and consumer staples are the heaviest sectors. The fund is better balanced than the S&P 500 between cyclical and defensive sectors. It is also more attractive regarding quality metrics. It beats the benchmark and the most popular dividend growth ETFs in total return since inception (DGRW is almost tie). VSDA has the maximum five-star rating at Morningstar. Its only inconvenience is low liquidity: it may be a problem for short-term trades, but not for long-term positions. Anyway, limit orders are always recommended. For transparency, a dividend-oriented part of my equity investments is split between a passive ETF allocation and my actively managed Stability portfolio (14 stocks), disclosed and updated in Quantitative Risk & Value.
Be the first to comment