

gorodenkoff/iStock via Getty Images
Dear Partners,
In Q3 2022, the Voss Value Fund, LP and the Voss Value Offshore Fund, Ltd. (collectively, the “Funds”), returned +1.7% and +1.3% to investors net of fees and expenses, respectively, compared to -2.2% total return for the Russell 2000, -4.6% total return for the Russell 2000 Value, and -4.9% total return for the S&P 500.
As of September 30th, 2022, the Fund’s total gross exposure stood at 145.6% and the net long exposure was 82.9%. Our top 10 longs had a weight of 76.3%, and our top 10 shorts had a weight of 26.9%.
Long/short strategy[1] assets under management stood at approximately $271.2 million and Firm assets stood at approximately $347.2 million as of September 30th, 2022.
Voss value master fund complex net monthly performance 2022
|
PERIOD |
Voss Value Fund, LP |
Voss Value Offshore Fund, Ltd. |
Russell 2000 TR |
Russell 2000 Value TR |
S&P 500 TR |
|
JANUARY |
-9.9% |
-9.9% |
-9.6% |
-5.8% |
-5.2% |
|
FEBRUARY |
4.4% |
4.3% |
1.1% |
1.7% |
-3.0% |
|
MARCH |
0.5% |
0.5% |
1.2% |
2.0% |
3.7% |
|
1st QUARTER |
-5.5% |
-5.5% |
-7.5% |
-2.4% |
-4.6% |
|
APRIL |
-9.4% |
-9.4% |
-9.9% |
-7.8% |
-8.7% |
|
MAY |
9.7% |
9.7% |
0.2% |
1.9% |
0.2% |
|
JUNE |
-9.8% |
-9.8% |
-8.2% |
-9.9% |
-8.3% |
|
2nd QUARTER |
-10.3% |
-10.4% |
-17.2% |
-15.3% |
-16.1% |
|
JULY |
11.9% |
11.6% |
10.4% |
9.7% |
9.2% |
|
AUGUST |
-0.2% |
-0.3% |
-2.0% |
-3.2% |
-4.1% |
|
SEPTEMBER |
-8.9% |
-8.9% |
-9.6% |
-10.2% |
-9.2% |
|
3rd QUARTER |
1.7% |
1.3% |
-2.2% |
-4.6% |
-4.9% |
|
OCTOBER |
|||||
|
NOVEMBER |
|||||
|
DECEMBER |
|||||
|
4th QUARTER |
0.0% |
0.0% |
0.0% |
0.0% |
0.0% |
|
YEAR TO DATE |
-13.8% |
-14.2% |
-25.1% |
-21.1% |
-23.9% |
The table below shows the Voss Value feeder fund returns compared to some of the relevant indices:
|
Net Return Comparison as of September 30th, 2022 |
||||||||
|
1 Month |
3 Month |
YTD |
1-Year |
Compound Annual Growth Rate |
||||
|
3-Year |
5-Year |
10-Year |
ITD(1) |
|||||
|
Voss Value Fund, LP |
-8.9% |
1.7% |
-13.8% |
-2.0% |
17.1% |
15.2% |
16.6% |
16.8% |
|
Voss Value Offshore Fund, Ltd. |
-8.9% |
1.3% |
-14.2% |
-1.9% |
– |
– |
– |
10.5% |
|
S&P 500 |
-9.2% |
-4.9% |
-23.9% |
-15.5% |
8.2% |
9.2% |
11.7% |
13.3% |
|
Russell 2000 |
-9.6% |
-2.2% |
-25.1% |
-23.5% |
4.3% |
3.6% |
8.6% |
10.5% |
|
Russell 2000 Value |
-10.2% |
-4.6% |
-21.1% |
-18.1% |
0.6% |
0.4% |
6.6% |
8.8% |
|
Russell 2000 Growth |
-9.0% |
0.4% |
-28.5% |
-28.5% |
-1.7% |
0.8% |
7.3% |
9.3% |
|
HFRX Equity Hedge Index |
-2.0% |
-0.1% |
-4.8% |
-2.3% |
5.0% |
3.0% |
3.3% |
3.3% |
| (1) Inception to Date measures the time period from Voss Value Fund, LP’s inception date of October 1st, 2011, and from Voss Value Offshore Fund, Ltd’s inception date of January 1st, 2020. |
Resilience & Hysteria – a dissonant duo that duly describes the state of the markets these last few months. One of the main themes that we’ve highlighted throughout 2022 remains ongoing: resilient microeconomic developments versus hysterically negative FinTwitter chatter. “In short, the worst is yet to come, and for many people 2023 will feel like a recession.”1 This quote from the IMF’s 2023 World Economic Outlook is a microcosm of the market’s current dour mood and “yes-but” state of mind: yes, things are okay now, but they’re about to fall off a cliff. The prevailing consensus assumes that if economic indicators remain too good, the Fed will hike us into oblivion and crush demand. To the “yes-but” crowd’s point, it certainly feels like a recession with depressing polarity and elevated inflation contributing to the worst investor and consumer sentiment in history. The good news is that supply chain disruption-induced inflation is working its way through the adaptive economy like a pig through a python and is beginning to moderate. In addition to inflation waning, we believe a litany of the sources of market panic over the past year have quietly faded or abated one-by-one without an equally offsetting diminution of fear.
Some examples:
- Germany has faced severe energy and electricity cost shocks all year with large swaths of manufacturing shut down and there has been intense fear that they would not have enough natural gas to survive the winter.
- Fast forward a few months, helped by moderate weather and new sources of supply, German gas storage was recently 100% full (all of EU gas storage is 94.4% full2, far exceeding regulators’ 80% targets set from earlier in the year). Despite possessing an economy that is manufacturing-centric and highly dependent on petrochemicals as feedstock, Germany’s economic growth this year has been above both its 30-year median and average growth rates.3 The Eurozone overall is expected to grow economic output by a solid 3.3% this year.3 The German DAX is down less than 10% YTD and has had positive forward earnings revisions over the last four weeks.3
- Eight weeks ago, there was a particularly acute panic that a weak Great British Pound (or stated conversely, a strong USD) would cause something in the financial system to “break.”
- Moving to today, the GBP has rallied >17% against the US Dollar and we don’t hear about it in the news anymore. The FTSE 100 Index has a total return of +3.3% (in local currency) YTD through November 21st, still trades at just 9.5x earnings and its forward earnings revisions are down by less than 1% over the last four weeks.5 Of note, the US Dollar is up only 7.2% since the start of 2021 against a basket of emerging market currencies, and of course, the US is not those countries’ only trading partner.6
- In the last week of March, Goldman Sachs Economics Research called for oil prices to spike to $200+, which would cause a recession in 2022.7
- Instead, oil prices have declined by over 35%8 to <$80 since the time of that report (and are down slightly YTD) and the Atlanta Fed’s GDP Now forecaster is currently anticipating 4.2% real GDP Growth in the US for Q49—a massive acceleration of economic activity from the time of the panic-stricken report. Still, stocks are lower since then and fears over high energy prices persist as one of the main reasons cited by those who believe a recession is imminent.
- In May of this year, there were numerous fear-mongering headlines from prominent media outlets and various government agencies proclaiming the world may run out of wheat in 10 weeks.
- While still elevated at ~30% higher than their average price since the start of 2005, wheat prices fell by 43% over the next three months and are still down ~40% since their May peak.10 Global wheat inventories as of November 2022 were just 3.1% below 2021’s year-end inventory levels and 21% above their average since 2010.11 Far from a crisis. Similar fears came and went around U.S. diesel inventory.
We could fill pages with false fears like those above where worst-case outcomes ultimately did not come to pass. Many of the positive stats we listed are unfathomable to most investors because the broader sentiment remains disconnected from economic reality. This is not to say that these fears were not legitimate in the moment, as judgment was clouded with emotion and uncertainty. The point is that these conditions are always present, and most of the market’s frenzied worries never materialize. This year has been no different, there has just been a surfeit of ceaseless shocks and scares. Macro worries being overstated is also not to be confused with a sharp valuation reset and unprofitable tech stock/speculative growth stock bubble bursting.
The universal response to positive economic and earnings data will be the same as it has been for many quarters running: those data points are all backward looking, the shoes just haven’t dropped yet, and the real pain is forthcoming. This is potentially true, but there remains a myriad of underappreciated positives, such as the fact that essentially all developed market economies have private sector savings that remain outsized compared to historical levels any way you slice it.
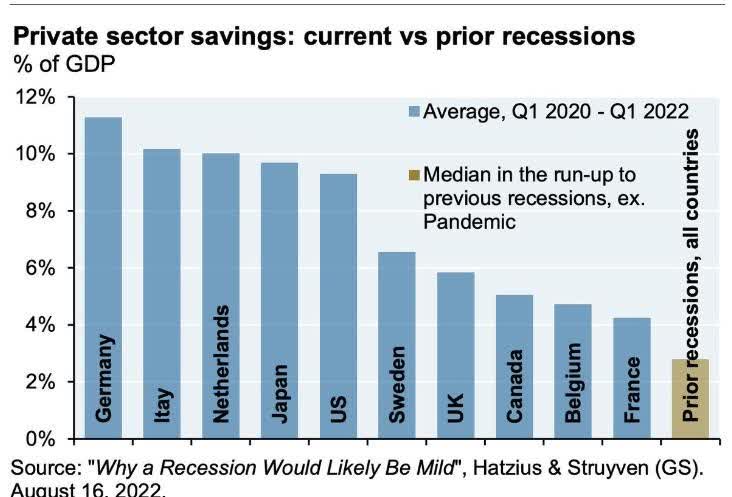
These large private sector savings continue to be underestimated and have reduced the probability of a recession in the near term. We believe evidence of this impact is that real (inflation-adjusted) consumer spending growth has remained solidly positive, even in the face of negative real disposable income growth for several quarters in a row. We anticipate real disposable income growth could flip positive again as inflation continues to cool and modest wage growth holds.
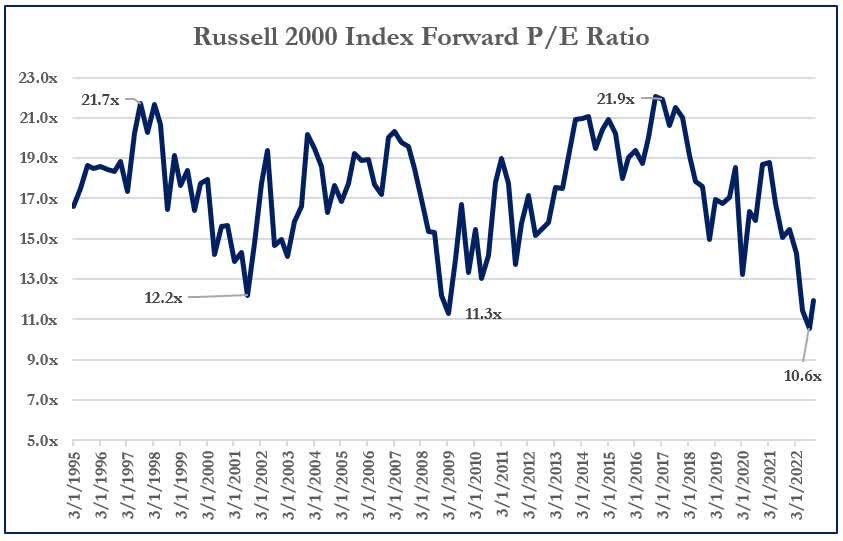
A credible argument against a durable equity rally is the observation that valuations remain quite full. This may be true if you look only at the S&P 500 on the surface, however, using an equal weighted index the forward P/E ratio drops by 2-turns to 15.7x, about a 10% discount to the trailing 10-year average.12 Additionally, small caps in the aggregate this summer were cheaper on an earnings basis than at any time since at least 1990.
We can hear the collective refrain now, “Yeah small caps may be cheap on trailing earnings and even forward estimates, but that just means estimates are too high and need to fall.” This is without a doubt the latest and most credible bearish assertion: that corporate earnings are poised to fall by 20% or more in 2023.13 It is highly possible that 2023 earnings estimates still require a tete-a-tete with an oversized cleaver and the S&P 500 settles quite a bit lower, but for now, as of early November, large cap earnings revisions have simply been in line with historical averages.14
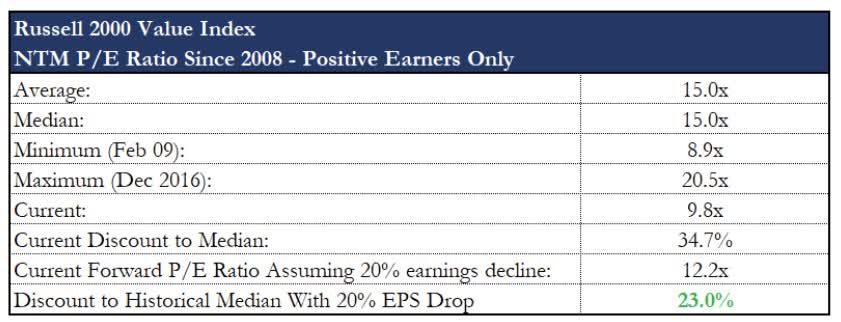
The last time small caps’ P/E ratio was in the 10x range the 2-year yield was between a 6-8% range compared to 4.5% today. This leads us to conclude that the market is pricing in either an ongoing and sustained rise in short term rates that is well beyond the consensus terminal Fed Funds Rate, and/or a whopping ~35% earnings decline is coming, which would be required to put the Russell 2000 Value back around its historical median/average earnings multiple of 15x.
To put such a magnitude of earnings decline into context, that would exceed the median decline (13%) of all recessions since 1949 by 2.5x, as well as exceed the decline of every previous recession except for the GFC’s.15 With a deeply inverted yield curve spread already and inflation’s leading indicators pointing to more moderation ahead, hitting 6%+ on the 2-year seems unlikely in the near term. It may sound counter intuitive, but if earnings decline by only 20% for US small cap value stocks, a full 1.5x the median decline experienced across all modern recessions, that would be bullish as it would likely be a positive surprise and would leave the P/E ratio at a healthy 20%+ discount to its historical average.
We would also note that, if excluding the Energy sector given its earnings volatility, having already faced an onslaught of cost pressures, corporate margins in 2022 are merely in-line with 2018’s.14 Thus, companies may not be over earning in the aggregate as is widely perceived.
Fully aware of the risk of appearing like a Pollyannish patsy, we simply think there are too many exaggerated fears, too much free-floating anxiety in society spilling into the marketplace, and more cheap stocks than you can shake a stick at to become overly conservative now. As previously anticipated worst case economic outcomes fail to materialize, small cap stocks can continue to rally in the face of a moderate economic slowdown and even a sizeable decline in earnings, as those would each constitute a positive surprise relative to the profoundly negative expectations.
A good example of this at the sector level is US homebuilding stocks—here the worst-case scenario has arguably come to fruition. Yet despite mortgage rates doubling YTD creating housing affordability issues and causing a crash in home sale transactions, and non-stop negative news flow, homebuilding stocks have outperformed the S&P 500 by >13% YTD16. Valuations and sentiment were arguably so depressed coming into this year that even with the barrage of problematic data points including spiking new home order cancellation rates, the stocks have still massively outperformed the benchmark as the negatives have lacked sufficient surprise power so far. We believe something similar can happen across many industries and sectors over the next year.
It’s fun to debunk false fears, but our investment strategy does not require exceptional insight into each macro myopia of the moment, we simply need a collection of uncorrelated and mispriced securities, and that we think we have.
Portfolio Updates
Our portfolio companies have had rising 2022 and 2023 earnings estimates (in the aggregate) over the last six months.17 Along with a weighted average 17.6% forward FCF yield, our longs have an average share buyback authorization in place for 8.1% of their shares outstanding at current market prices, and an average 6.2% short interest.17 The average Net Debt/EBITDA across the long book is 0.9x, the median is 0.7x, and the weighted average is 1.5x. For context, the S&P 500’s average leverage ratio since 1990 is 2.7x (versus just ~1.5x currently and >4x going into 2008).18 This analysis covers our top four positions (GFF, EXTR, BXC, and IMXI) and one new core idea.
Intermex (IMXI)
After missing on consensus revenue estimates for the first time since Q4 2019 and implicitly guiding down Q4 by including a recent acquisition in reaffirmed guidance, IMXI sold off from ~$28 to ~$20 in just two weeks and is now over 20% cheaper on an EV/EBITDA multiple basis than where its inferior competitor MoneyGram is being acquired. The stock is priced like a cigar butt at a >13% FCF yield on our 2024 estimates despite stellar operating results, evidenced by a 5-year 20% organic revenue CAGR along with expanding margins, and a long runway for continued growth in remittances to Latin America. We would note that despite the revenue miss, revenue still grew over 16% in the quarter with organic guidance around that level as well. We believe the market has also not fully incorporated what management will do with the aforementioned La Nacionale acquisition, as there are significant efficiencies to be gained simply by running management’s analytical and data driven growth playbook. IMXI has 77% upside to $35 in our Base Case price target, which would peg it at 9x 2024 EBITDA, a multiple we think is about a 40% discount to other companies with similar organic growth and margin profiles.
Extreme Networks (EXTR)
EXTR is one of our core longs that is a beneficiary from the ongoing, multiyear boom in enterprise Capex, as companies and government agencies continue to invest in modernizing their networks for the Cloud era. In the latest quarter (Q1 Fiscal Year 2023) they showed progress on expanding gross margins, further grew their product backlog (now more than 20x above historical average), and showed what we see as an impressive reacceleration of software cloud bookings growth to +60%. Management recently reiterated their aggressive long-term target of a 40% cloud CAGR for the next three years (above our Base Case numbers), no small feat given the business has now scaled to over $100 million in annual recurring revenue. Management is now talking more about Fiscal Year 2026 and building up that year’s order book, given the high visibility they have into 2023-2025. Ongoing order growth and pipelines remain strong (even in Europe), defying all consensus sell side expectations of a sudden demand collapse. We’ve maintained an outsized long position in EXTR because of the tremendous growth visibility their hardware backlog provides, along with the software and services revenue that will come with it.
Our estimates for 2023-2025 remain well above consensus expectations and as a result, we see our Bull Case, which has 115% upside based on 15x FY2024 FCF, growing in likelihood. We think this will prove a reasonable target once more investors realize they are hitting their operational groove and estimates revisions will be positive, they are steadily taking market share, and they have underappreciated upside optionality as a strategic acquisition.
Bluelinx (BXC)
Coming into 2022, consensus EPS estimates for building products distributor Bluelinx (BXC) were $10.70. Now, despite lumber prices being down ~65% YTD and new home starts down y/y, with three quarters reported as of the Q3 earnings release, it is looking like they will earn over $31 in EPS – yet the stock is down 30% this year (the stock went from >8x forward earnings to 2.1x trailing).
The average US homeowner gained $60k in home equity in the last 12 months and home equity remains the most predictive indicator for Repair & Remodeling spending (~45% of BXC’s revenues are tied to R&R).19 The median age of owner-occupied homes is at a record high of 41 years. On top of that, we are just now lapping the critical 20-year anniversary of homes built during the 2002-2006 boom, an age in a home’s life where remodeling spend takes a significant step function higher. This remains an underappreciated R&R driver and we believe it is showing up in the numbers.
Contrary to popular belief,spending on discretionary home remodeling for owner occupied homes is still ~16% below its 2007 peak.20 The growth in R&R spending as of late has been driven more by the first R, Repair (e.g., new roofing, new siding, HVAC replacement, water heaters, etc.), as opposed to spending on discretionary projects (such as kitchen and bath remodels, new decks, room additions, etc.). Cumulative Home improvement spending overall post Covid-lockdown is now only $7 billion, or ~1.2% above its long term trendline, thus we think it is safe to infer that lingering fears of significant pull-forward of R&R spending are no longer warranted.21
BXC shares trade at a >50% FCF yield on 2022 numbers and a 25%+ FCF yield on our 2023 estimates. With a new management team that is aggressively managing commodity lumber inventories, along with a highly variable cost structure and outsized exposure to what we expect to be resilient R&R spending, at 2-4x FCF we believe BXC remains grossly undervalued relative to its ongoing earnings power. In our Base Case, we think shares are a double from the $65 range which assumes earnings decline by 50% and the market ascribes a measly 8x multiple, a ~33% discount to its historical average which includes times when leverage was dangerously elevated.
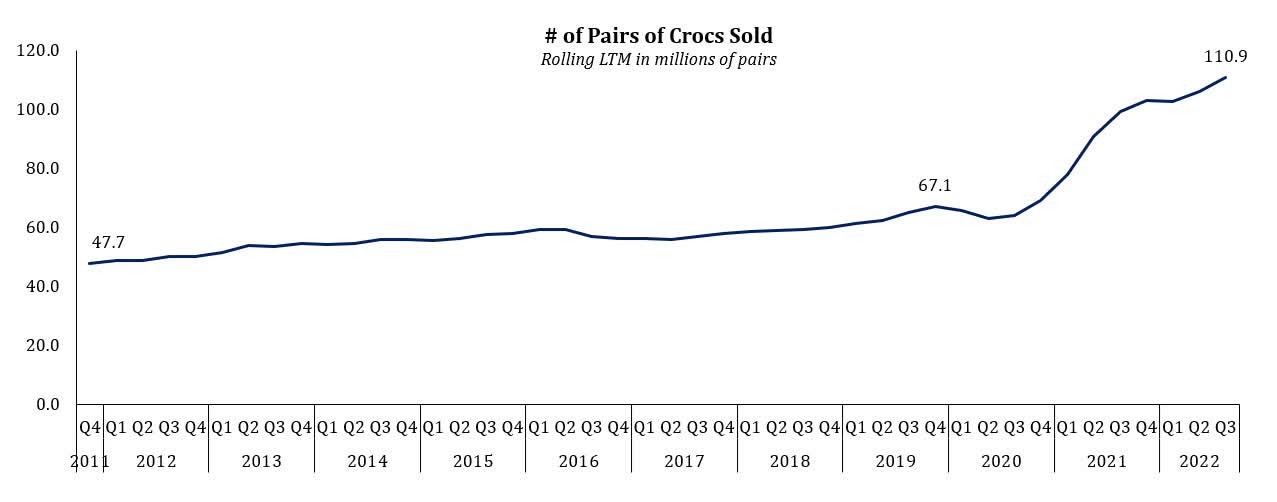
Crox Inc. (CROX)
Crox is a new long position. While the shoes are often perceived as a fad, it might surprise many of you that the Crox brand has not only endured for 20 years but is still growing by >20% organically (on top of 73% revenue growth in Q3 last year) with mid-to-high 20% operating margins.
Aside from being a consumer discretionary company and perceived Covid lockdown beneficiary at peak earnings, why did the market offer up the opportunity recently to buy CROX at its lowest earnings multiple ever? The company levered up to buy a relatively unknown shoe brand HEYDUDE for $2.5 billion in an auction process that was at first looked at with great skepticism. With the passage of time (and initial results), we think the market is coming around to the idea that the acquisition was a good one as the shoes will grow to become even more wildly popular. Academy Sports (ASO) recently called them out on their September 7th earnings call, saying, “We’re also excited to launch HEYDUDE in all stores in July just in time for back-to-school. We’re seeing strong early results and expect HEYDUDE to be a sales driver versus the remainder of the year.”
HEYDUDE has already greatly surpassed CROX management team’s initial growth expectations, to such a degree that it turns out they only paid an estimated ~9.5x NTM EBIT (a sizeable discount to CROX’s historical median ratio of 12.0x), for a high margin, rapidly growing brand. As a relatively unknown and underpenetrated shoe brand, we gained conviction that the company can follow its Crox growth playbook and systematically increase HEYDUDE’s distribution both domestically and internationally to drive a 20% revenue CAGR over the next few years. Since 2014, the CEO has had an impeccable track record of delivering on targets laid out and we think the company can continue this trend of excellent execution with HEYDUDE.
In sum, our view is that we bought CROX at half its historical median valuation while the company is guiding for a revenue growth rate of nearly double its historical rate with over triple its historical operating margins. Our Base Case price target is $160 (70% upside within the next ~2 years), which would be 10x our discounted 2025 EBIT estimate—still a 17% discount to its historical median of 12x.
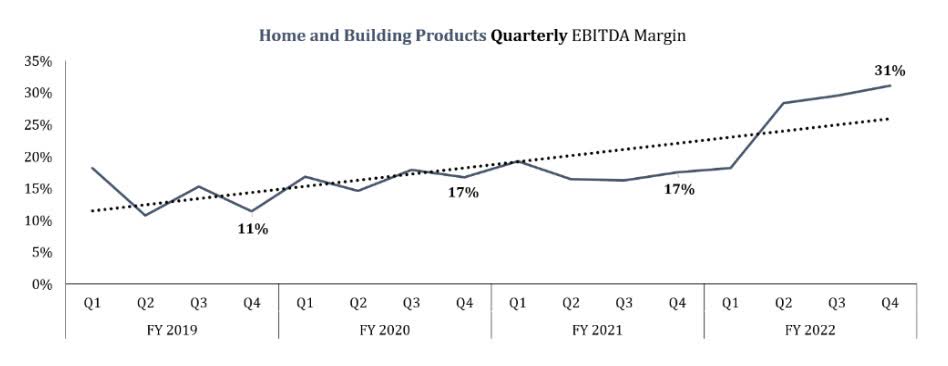
Griffon Corp. (GFF)
GFF remains an outsized long position at ~20% of the Fund.
Their consumer and professional products (tools) segment, CPP, continues to disappoint this year as retailers became over inventoried, there was generally poor weather for the peak gardening season, and input cost went through the roof. We assume only a ~$950M valuation for CPP in a sale – a 50% discount to the cumulative combined values paid for the various businesses since 2010.
More importantly, GFF’s more valuable garage door segment continues to surprise to the upside in a major way. It is still growing 47% and 2022’s full year EBITDA came in >100% higher than expectations at the start of the year. There has been no demand collapse. And contrary to intense skepticism and pushback that we heard all year long, at 31%, HBP’s EBITDA margins continue to tick higher—and that is before the benefits of lower steel prices are felt. With their initial guidance for 2023 for a “modest EBITDA decline” implying recent HBP EBITDA gains are relatively sustainable, we believe potential acquirers’ fears should be assuaged, thus significantly raising the probability of a favorable valuation in a buyout.
In conjunction with its ongoing strategic review, the company pushed its director nomination window back by a month. The new director nomination deadline is now December 30th, a date we are highly cognizant of as the year winds down and we eagerly monitor developments at Griffon. With the company continuing to forego earnings calls and now calling out executive retention bonuses for 2023, we believe many signs point to GFF remaining on track to sell both operating segments separately within a matter of weeks. Our Base Case price target is in the range of $50 in a break-up scenario, which is derived from using 11-12x EBITDA for HBP ($370M of 2023 EBITDA) and 6-7x depressed CPP EBITDA of $130M. Thanks to the strong 2023 guidance and a hefty mid-teens FCF yield at the current stock price, we believe the fundamental downside is limited even assuming there is no imminent sale.
Conclusion
Always keeping us on our toes, this year’s perplexing plot twist has been that unambiguous positive surprises have been reframed as decisively negative as investors fear the Fed and myopically focus on short term interest rates. Most ancient wisdom is based on pondering paradoxical questions, with perhaps the most important ones granting no ultimate resolution. Similarly, our investment process is an unending journey of learning and unlearning all while battling our biases—it is not a thing or manifesto to be finished and wrapped neatly in a bow, never to be revised again. A flawless understanding may never be had, but that does not mean we should desist from exploring life’s big questions or refrain from entering the intellectual gauntlet laid bare by The Great Humiliator—au contraire, we relish the challenge. 11 years into the alpha odyssey, we remain humble students of the market.
To continued Alpha,
Voss Team
|
Appendix: 1: IMF Report, quote can be found here 2: Reutershttps://graphics.reuters.com/UKRAINE–CRISIS/EUROPE–GAS/zdvxozxzopx/ 3: Bloomberg 4: Bloomberg 5: Bloomberg 6. FRED, St. Louis Fed: Nominal Emerging Market Economies U.S. Dollar Index, list of currencies in basket available here7: Goldman Sachs Research 8: Bloomberg 9: Atlanta Fed 10: Bloomberg 11: USDA, Foreign Agricultural Service, Production, Supply and Distribution Database and USDA, World Agricultural Outlook Board, World Agricultural Supply and Demand Estimates. 12: Bloomberg 13: Morgan Stanley Research Reports 14: Goldman Sachs equity Research 15: Bank of America Equity Research 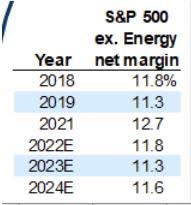 16: Bloomberg 17: Using stock prices and portfolio weights of the close of 11/29/22. Uses Voss estimates and a combination of levered/unlevered FCF yield depending on the company’s capital structure, and forward estimates (NTM or 2023). Short interest data from Bloomberg. Buyback authorization data from company press releases and filings. 18: Bloomberg 19: CoreLogic Homeowner Equity Insights, September 2022 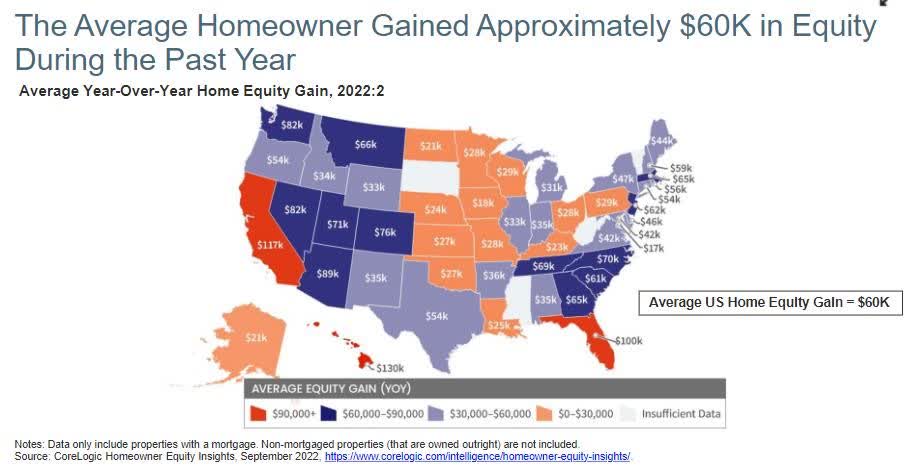 20: LIRA, Harvard Joint Center for Housing Studies 21: Morgan Stanley Equity Research |
Common Terms:
|
CAGR – Compound Annual Growth Rate |
GDP – Gross Domestic Product |
|
DCF – Discounted Cash Flow |
IRR – Internal Rate of Return |
|
EBITDA – Earnings Before Interest, Taxes, Depreciation & Amortization |
LTM – Last Twelve Months |
|
EPS – Earnings per Share |
NTM – Next Twelve Months |
|
EV – Enterprise Value |
P/E – Price to Earnings |
|
FCF – Free Cash Flow |
YTD – Year to Date |
|
Disclosures and Notices: Beginning January 1, 2020, all investment activity is conducted by the Voss Value Master Fund, LP (the “Master Fund”), which has two feeder funds, and therefore performance figures from January 1, 2020 onward are calculated based on the Master Fund. All limited partners invest in the Fund through one or more of the following feeder funds: Voss Value Offshore Fund, Ltd. (the “Offshore Fund”) and Voss Value Fund, LP (the “Predecessor Fund”), each a “Feeder Fund”. Performance figures for the Predecessor Fund are contributable to Travis Cocke as sole portfolio manager. Mr. Cocke maintains the same the position with the Fund and the Fund will employ a similar strategy as the Predecessor Fund. Actual returns are specific to each investor investing through a Feeder Fund. Each Feeder Fund was established at different times and has varying subsets of investors who may have had different fee structures than those currently being offered. As a result of differing fee structures, differing tax impact on onshore and offshore investors, the timing of subscriptions and redemptions, and other factors, the actual performance experienced by an investor may differ materially from the performance reported above. Portfolio statistics shown are inclusive of the Predecessor Fund and the Offshore Fund. This letter is provided by Voss Capital, LLC (“Voss”) for informational purposes only and does not constitute an offer or a solicitation to buy, hold, or sell an interest in the Voss Value Fund, LP (the “Fund”) or any other security. An investment in the Fund is speculative and involves substantial risks. Additional information regarding the Fund, including fees, expenses and risks of investment, is contained in the offering memorandum and related documents, and should be carefully reviewed. An offer or solicitation of an investment in the Fund will only be made pursuant to an offering memorandum. This communication is confidential and may not be reproduced or distributed without prior written permission from Voss. This confidential report is only intended for the recipient and may not be redistributed without the prior written consent of Voss. The information contained herein reflects the opinions and projections of Voss as of the date of publication, which are subject to change without notice at any time subsequent to the date of issue. All information provided is for informational purposes only and should not be deemed as investment advice or a recommendation to purchase or sell any specific security. Data included in this letter comes from company filings and presentations, analyst reports and Voss’ estimates. While the information presented herein is believed to be reliable, no representation or warranty is made concerning the accuracy of any data presented. Certain information contained in this letter constitutes “forward-looking statements” which can be identified by the use of forward-looking terminology such as “may,” will,” “should,” “expect,” “attempt,” “anticipate,” “project,” “estimate, or “seek” or the negatives thereof or other variations thereon or comparable terminology. Due to various risks and uncertainties, actual events or results in the actual performance of the Fund may differ materially from those reflected or contemplated in such forward-looking statements. There can be no guarantee that the Fund will achieve its investment objectives and Voss does not represent that any opinion or projection will be realized. The securities contained within the benchmark indices highlighted herein do not necessarily correspond to investments and exposures that will be held by the Fund and are therefore of limited use in predicting future performance of the fund. Indexes are unmanaged and have no fees or expenses. An investment cannot be made directly in an index. The Fund consists of securities which vary significantly from those in the benchmark indexes listed below. Accordingly, comparing results shown to those of such indexes may be of limited use. The S&P 500 Total Return Index is a market cap weighted index of 500 widely held stocks often used as a proxy for the overall U.S. equity market. The Russell 2000 index is an index measuring the performance approximately 2,000 smallcap companies in the Russell 3000 Index. The Russell 2000 serves as a benchmark for small-cap stocks in the United States. The Russell 2000 Growth Index measures the performance of those Russell 2000 companies with higher price/book ratios and higher predicted and historical growth rates. The Russell 2000 Value Index measures the performance of the small-cap value segment of the U.S. equity universe. It includes those Russell 2000 companies with lower price-to-book ratios and lower expected and historical growth values. HRX Equity Hedge Index consist of Equity Hedge strategies which maintain positions both long and short in primarily equity and equity derivative securities. A wide variety of investment processes can be employed to arrive at an investment decision, including both quantitative and fundamental techniques; strategies can be broadly diversified or narrowly focused on specific sectors and can range broadly in terms of levels of net exposure, leverage employed, holding period, concentrations of market capitalizations and valuation ranges of typical portfolios. The strategy utilized by Voss has a high tolerance for uncertainty. Different types of investments involve varying degrees of risk. Therefore, it should not be assumed that future performance of any specific investment or investment strategy will be profitable. Asset allocation may be used in an effort to manage risk and enhance returns. It does not, however, guarantee a profit or protect against loss. Past performance does not guarantee future results. |
Footnotes[1] Includes the Voss Value Master Fund and SMA |
Editor’s Note: The summary bullets for this article were chosen by Seeking Alpha editors.
Be the first to comment