

m-kojot/iStock via Getty Images
Rough 2022 YTD – but it’s only a beginning
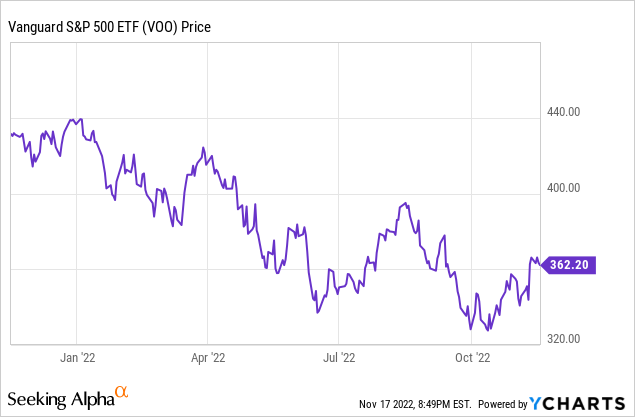
Vanguard S&P 500 ETF (NYSEARCA:VOO), which is designed to perfectly track the S&P 500 Index (SP500), is down by 17% YTD in 2022, after slipping over 25% earlier in October. Here is the VOO chart over the last 12 months, showing an unfolding bear market downtrend in 2022.
Unfortunately, I believe that the bear market is likely to continue in 2023. Specifically, as a part of my research, I identified the three phases of a full bear, based on historical evidence.
- First, there is a Liquidity Shock phase, which is induced by the expectations of the Fed’s monetary policy tightening.
- Second, there is a Recessionary Selloff, which is characterized with earnings downgrades and valuation multiples contraction.
- Third, there is a Credit Crunch, or the ultimate stage of the bear market, during which the credit risks spikes and major bankruptcies follow (the Lehman Brothers case).
The 2022 was the Phase 1 selloff
The Fed aggressively hiked interest rates in 2022 to catch up with the inflationary shock, in addition to the liquidity withdrawal via the QT. As a result, the bubbles in non-profit tech, meme stocks, crypto, and large cap tech all busted. This was a classic Phase 1 selloff.
The market rallied over the last week in response to the less than expected CPI inflation reading for October, expecting possibly that the Fed would pause or pivot, which essentially ended the Phase 1 selloff.
However, at this point it still premature to expect the Fed pivot and the ending of the Fed-induced liquidity selloff. Just today (11/17/2022), the St. Louis Fed President Bullard, who is a voting member on the rate-setting Federal Open Market Committee, presented a case where the Federal Funds rate could be rising in 2023 up to 7%, which is well above the current market expectations of 5% by July 2023, and then 40bpt cut by Dec 2023 to 4.60% (based on Federal Funds futures).
Given the Bullard case for the continuation of monetary policy tightening in 2023, which is based on the Taylor-rule, it is premature to expect the end of Phase 1 selloff just yet.
Here is the chart from the Bullard’s presentation showing the “restrictive zone.”
St.Louis Fed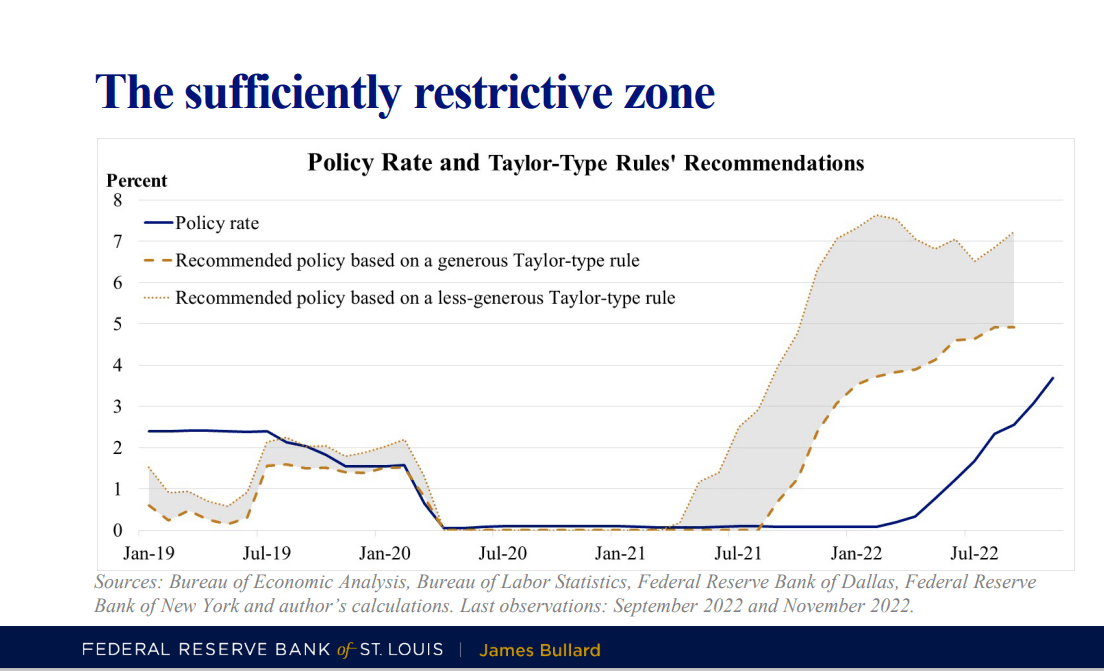
The Phase 2 selloff is approaching
The recession is coming. Bulls are hoping for a soft landing, where the Fed pauses before the economy slips into a recession. But the damage has already been done, and with the certain time lag, the economic data will start to scientifically deteriorate.
The New York Fed publishes the recession probability based on the yield curve spread between the 10Y Treasury Bond and the 3M Treasury Bill, which has been the most reliable predictor of a recession within the 12-month period. When the 10Y-3M spreads inverts, the recession follows, and the 10Y-3M spread is deeply inverted by -0.55%. Here is the chart:
FRED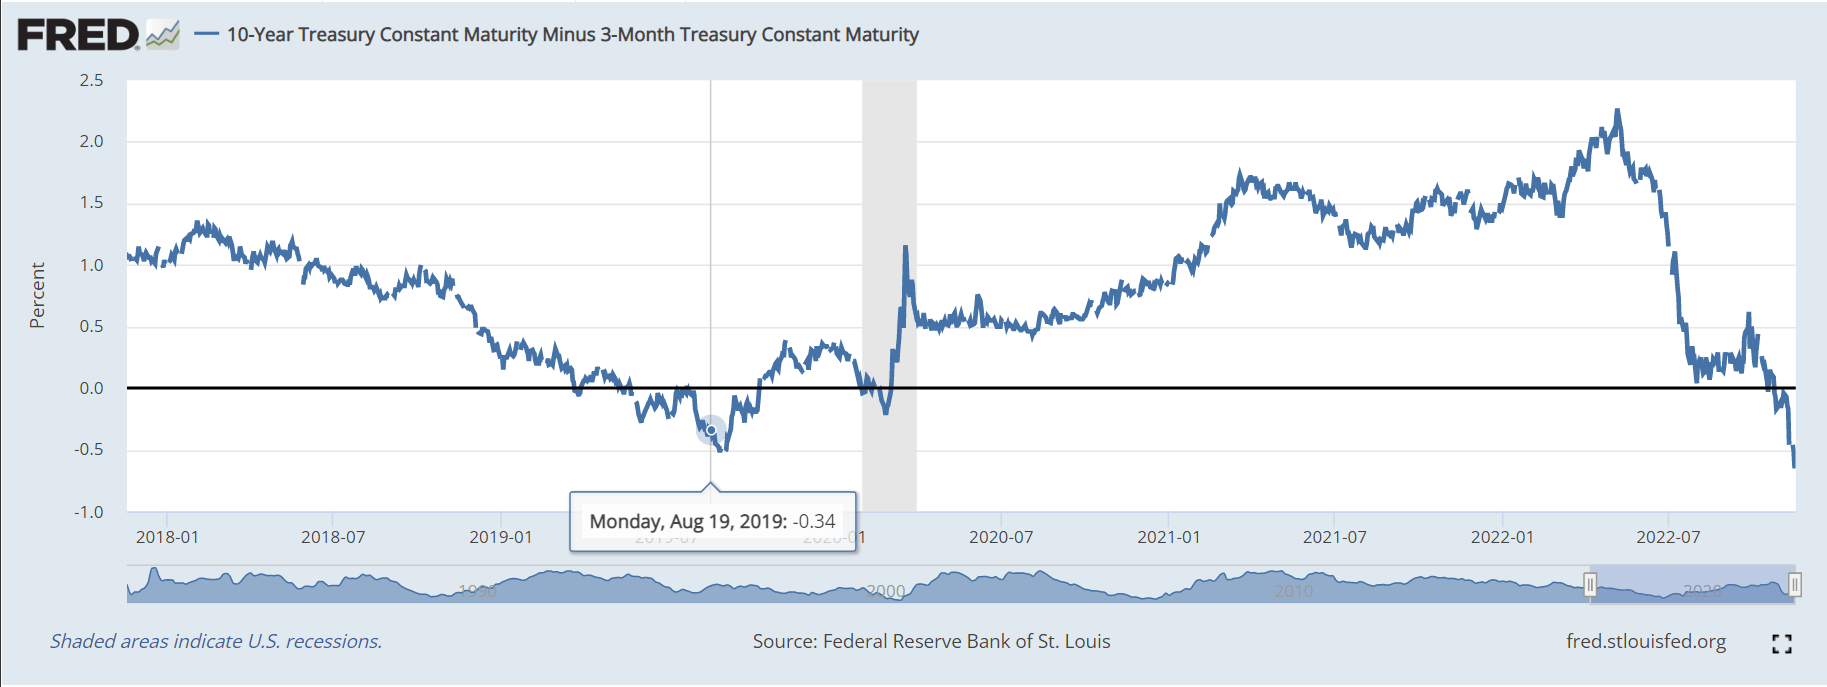
Thus, with the upcoming recession, the current bear market will transition to the Phase 2 selloff of corporate earnings get downgraded and valuation multiples contract.
The Phase 2 selloff could be deep. The S&P500 TTM P/E ratio is near 20, and the forward P/E ratio is near 18. Consider that earnings could drop by 10-30% (not priced-in), and the valuation multiple could contract to about 15, it easy to see there is a considerate valuation unwind potential in 2023.
The Phase 3 selloff is increasingly likely
The most violent selling happens during the Phase 3 or the credit crunch, which is the liquidity shock caused by the defaults and forced selling due to widespread margin calls.
The seeds are planted for the Phase 3 selloff. The chart below shows that S&P 500 revenue growth is closely related to lending standards (shown in inverse). Tighter lending standards cause lower nominal revenue growth, which results in the spike in credit spreads. Thus, as Bank of America predicts, we can expect the deteriorating credit quality in 2023:
Macro Strategy — Credit Cycle Turning Fast: Incoming data suggest financial stress is spreading from markets primarily affected by interest rate volatility to areas impacted by deteriorating credit quality.
Bank of America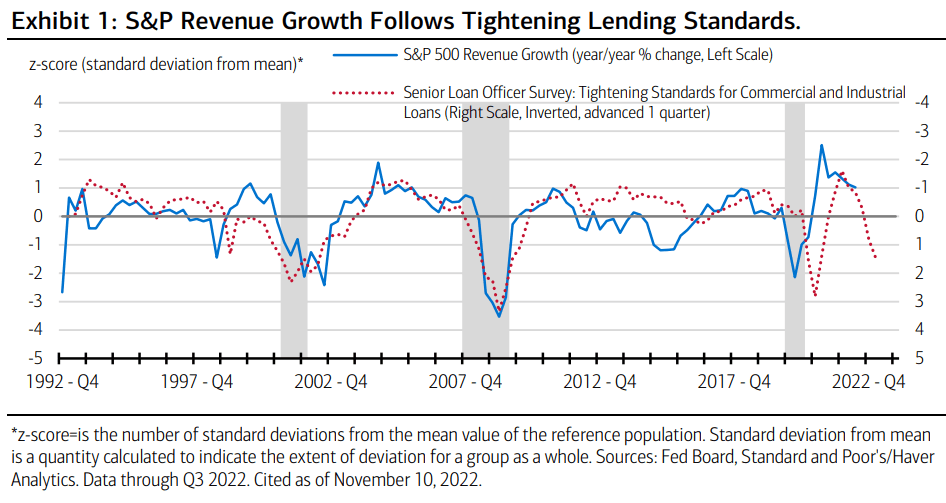
Implications
The VOO analysts and the SA Quant on Seeking Alpha are overly optimistic, virtually unanimously recommending a buy on VOO. VOO is an exceptionally managed exchange-traded fund (“ETF”), with only 0.03% in management fees, but it tracks the S&P 500 Index, and the outlook for the S&P 500 is very bearish for 2023, as I made the case in this article. The additional drawdown could be substantial, if the current selloff transitions to the next phase, and ends with the credit crunch. Thus, my recommendation is to sell.
Seeking Alpha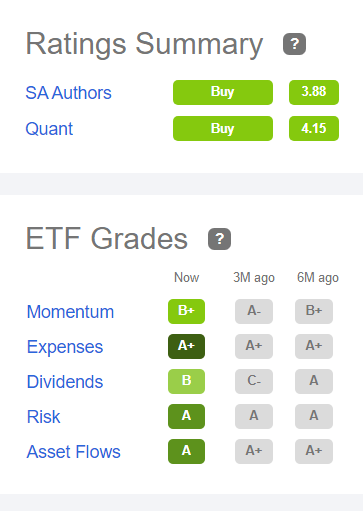
VOO sector performance during the recent bear market rally
VOO is tracking S&P 500 and is nearly perfectly correlated with the SPDR S&P 500 Trust ETF (SPY). VOO rallied since the “soft” October CPI reading. But interestingly, over the last 30 days, VOO has been led by the cyclical and economically sensitive sectors Materials (XLB), Industrials (XLI), and Energy (XLE). These sectors should not lead during the forthcoming recession. The market appears to hope for a soft landing but given the current inversion on the 10Y-3M curve, the odds are heavily against that bet (hope).
SelectSourceSPDR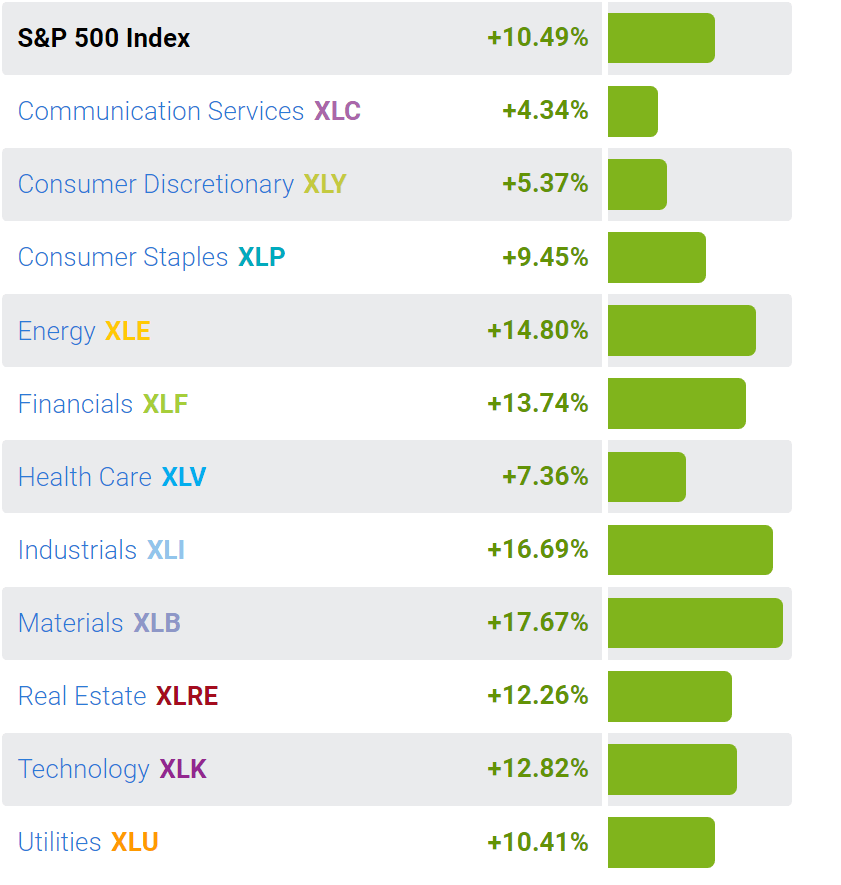
When looking at performance of individual stocks listed on S&P500 over the last 30 days, some of the best-performing stocks were heavily shorted stocks such as Carnival Corp. (CCL), up by 35%, and Royal Caribbean Cruises (RCL), up by 34%. This implies that the recent rally was possibly only a short-covering bear market rally.
Editor’s Note: This article discusses one or more securities that do not trade on a major U.S. exchange. Please be aware of the risks associated with these stocks.
Be the first to comment