

nevarpp/iStock via Getty Images
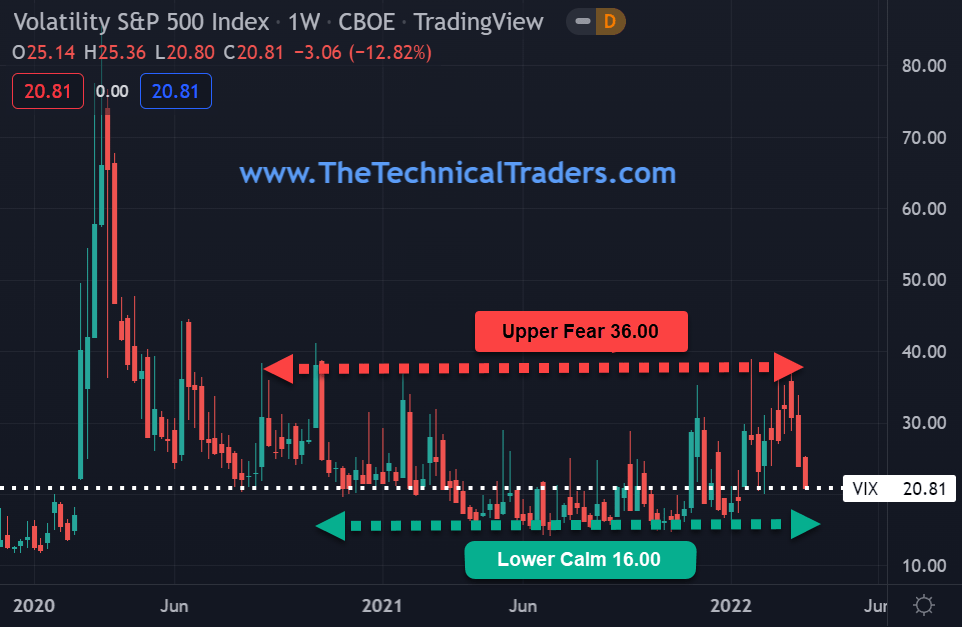
The CBOE Volatility Index (VIX) is a real-time index. It is derived from the prices of SPX index options with near-term expiration dates that are utilized to generate a 30-day forward projection of volatility. The VIX allows us to gauge market sentiment or the degree of fear among market participants. As the Volatility Index VIX goes up, fear increases, and as it goes down, fear dissipates.
Commodities and equities are both showing renewed strength on the heels of global interest rate increases. Inflation shows no sign of abating as energy, metals, food products, and housing continue their upward bias.
During the last 18-months, the VIX has been trading between its upper resistance of 36.00 and its lower support of 16.00. As the Volatility Index VIX falls, fear subsides, and money flows back into stocks.
VIX – Volatility S&P 500 Index – CBOE – Daily Chart
SPY Rallies +10%
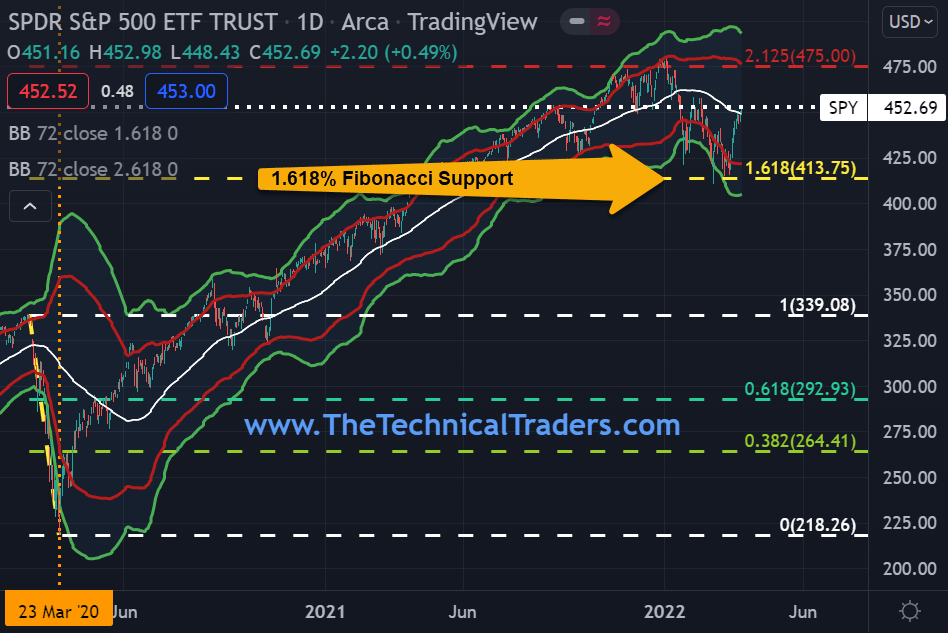
The SPY has enjoyed a sharp rally back up after touching its Fibonacci 1.618% support based on its 2020 Covid price drop. Money has been flowing back into stocks as investors seem to be adapting to the current geopolitical environment and the change in global central bank lending rate policy.
Resistance on the SPY is the early January high near 475, while support remains solidly in place at 414. March marks the 2nd anniversary of the 2020 Covid low that SPY made at 218.26 on March 23, 2020.
SPY – SPDR S&P 500 ETF Trust – ARCA – Daily Chart
Berkshire Hathaway Record-High $538,949!
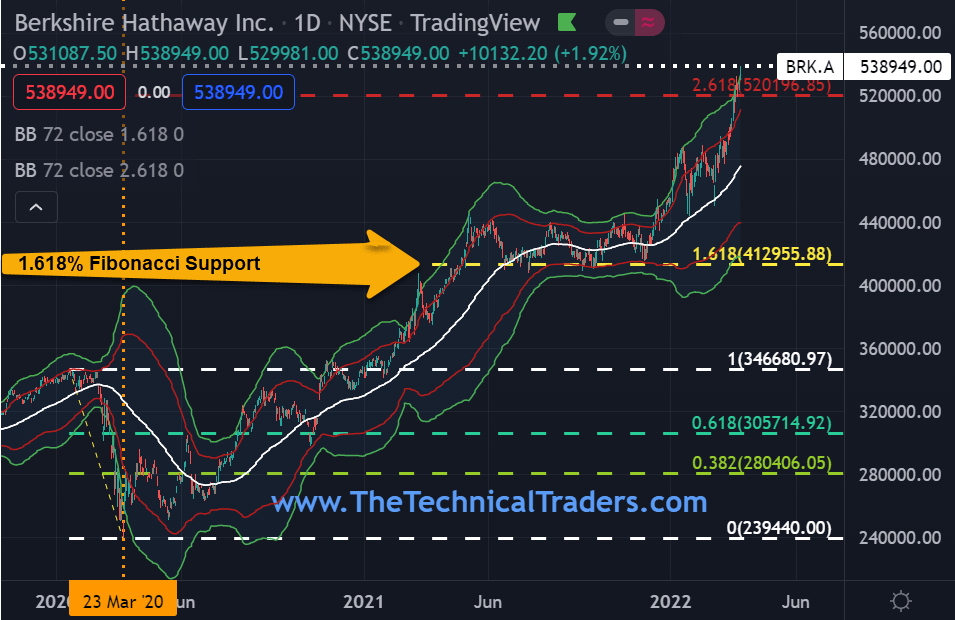
Berkshire Hathaway (BRK.A)(BRK.B) is up +20.01% year to date compared to the S&P 500 -4.68%. Berkshire’s Warren Buffett has also been on a shopping spree, and investors seem to be comforted that he is buying stocks again. Buffett reached a deal to buy insurer Alleghany (Y) for $11.6 billion and purchased nearly a 15% stake in Occidental Petroleum (OXY), worth $8 billion.
These acquisitions seem to be well-timed as insurers and banks tend to benefit from rising interest rates, and Occidental generates the bulk of its cash flow from the production of crude oil.
As technical traders, we look exclusively at the price action to provide specific clues as to the current trend or a potential change in trend. With that said, Berkshire is a classic example of not fighting the market. As Berkshire continues to make new highs, its trend is up!
BRK.A – Berkshire Hathaway Inc. – NYSE – Daily Chart
Commodity Demand Remains Strong
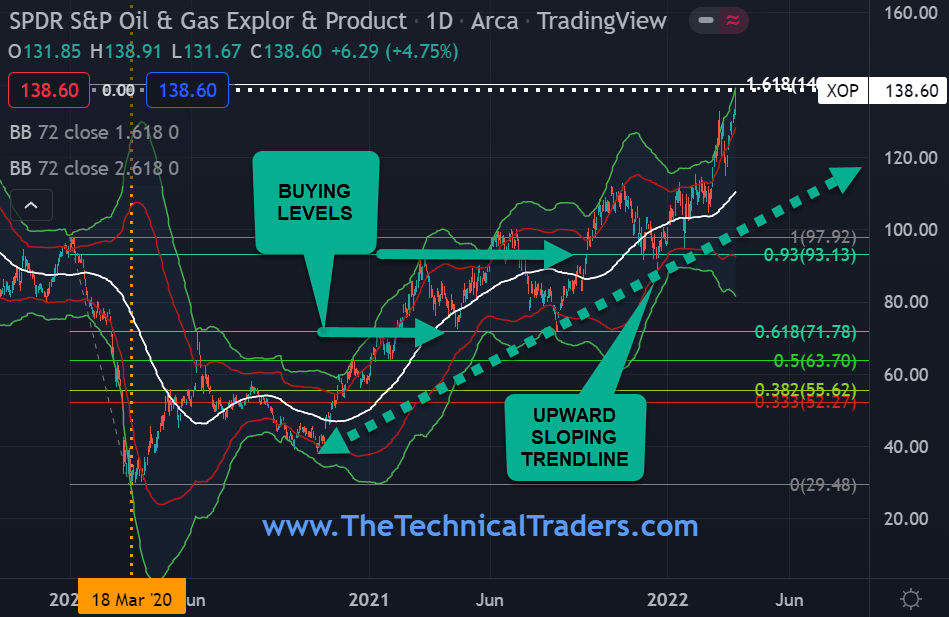
Inflation continues to run at 40-year highs, and it appears that it will take more than one Fed rate hike to subdue prices. Since price is king, we definitely want to ride this trend and not fight it. It is always nice to buy on a pullback, but the energy markets at this point appear to be rising exponentially. The XOP ETF gave us some nice buying opportunities earlier at the Fibonacci 0.618% $71.78 and the 0.93% $93.13 of the COVID 2020 range high-low.
Remember, the trend is your friend, as many a trader has gone broke trying to pick or sell a top before its time! Well-established uptrends like the XOP are perfect examples of how utilizing a trailing stop can keep a trader from getting out of the market too soon but still offer protection in case of a sudden trend reversal.
XOP – SPDR S&P Oil & GAS Exploration & Production – ARCA – Daily Chart
Knowledge, Wisdom, And Application Are Needed
It is important to understand that we are not saying the market has topped and is headed lower. This article is to shed light on some interesting analyses of which you should be aware. As technical traders, we follow price only, and when a new trend has been confirmed, we will change our positions accordingly.
Editor’s Note: The summary bullets for this article were chosen by Seeking Alpha editors.
Be the first to comment