

jittawit.21
I felt it necessary to write this article, as we’ve noticed large volume in authored pieces that aren’t entirely aligned with the key drivers of the real estate sector and real estate investment trusts (“REITs”) in particular. We see great danger for those that are overweight REITs, and especially those exposed to the Vanguard Real Estate ETF (NYSEARCA:VNQ), which is one of the flagship exchange-traded funds (“ETFs”) that investors utilize for real estate exposure.
Without further delay, here are the current fault lines in the real estate sector’s public asset space and Vanguard’s Real Estate ETF in particular.
Inflation & REITs – There’s A Misunderstanding
There’s a strong correlation between inflation and the real estate sector’s performance, as rental fees and appraisals tend to increase accordingly. However, we need to look at the nature of inflation, as price level fluctuation isn’t a “one fits all” situation.
Firstly, let’s dissect the past two years’ inflation in the United States. During the earlier stages of the pandemic, we saw pull-side inflation due to stimulus, expansionary monetary policies, and technological innovation. However, as time has passed, the nation (and the globe) evolved into a sphere where pull-side inflation has been the theme due to supply-chain congestion, prolonged pandemic lockdowns in China, and the war in Ukraine. As such, consumer spending power (push-side inflation) has stagnated, and pull-side inflation has been dominant.
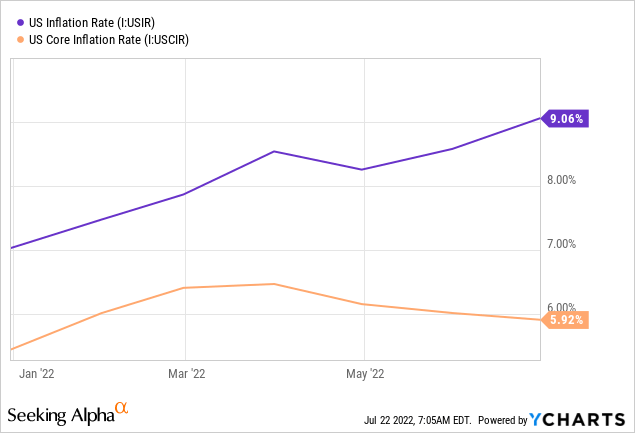
As things stand, we’re likely to see rising interest rates and resilient push-side inflation due to the ongoing geopolitical risks. The yield curve below and inflation charts display this (note that, general inflation includes non-core inflation, which is tied to the push inflation we’re experiencing, and core is demand-side inflation, which excludes food and energy).
Gurufocus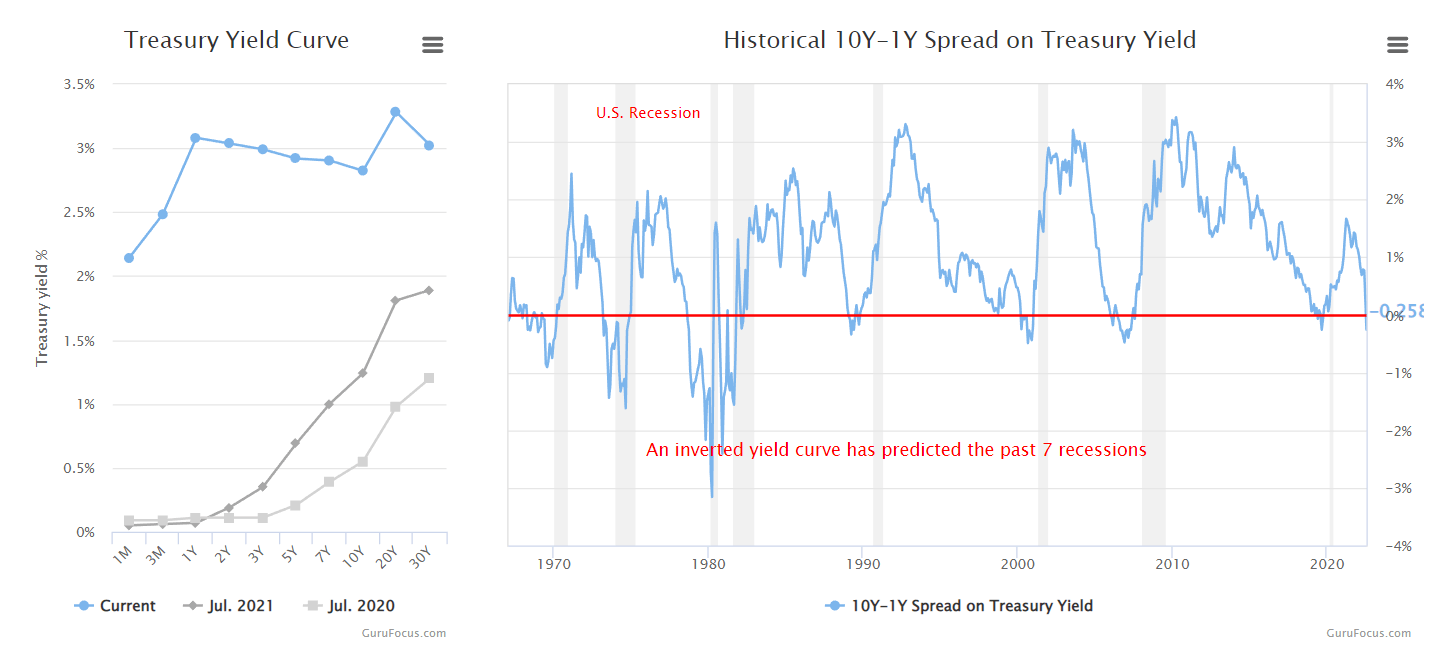
The chart below is the iREIT, year-to-date performance in REIT performance, which I gathered from Brad Thomas’ article.
iREIT, Seeking Alpha, Brad Thomas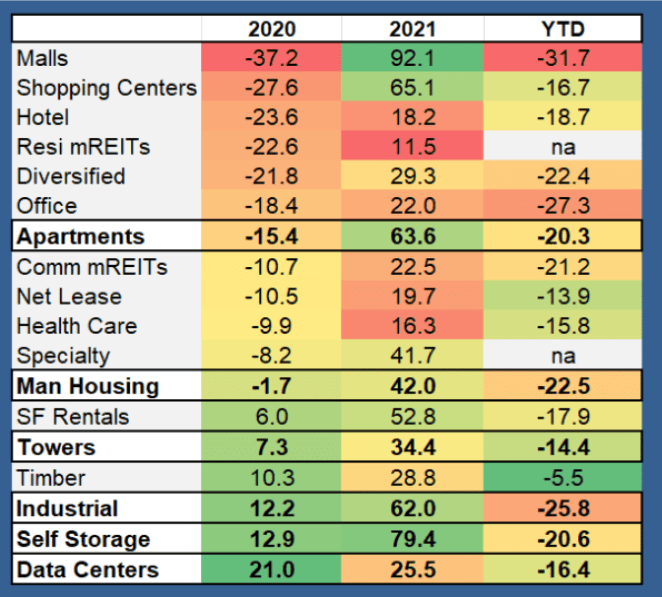
Notice how REITs have struggled as resilience in non-core inflation has trumped core inflation. Therefore, real estate prices started to peak earlier this year and subsequently began to drop recently. Remember, asset pricing is forward-looking, so the short-term “positive” inflationary effect on real estate appraisals and rentals has most likely been priced a long time ago.
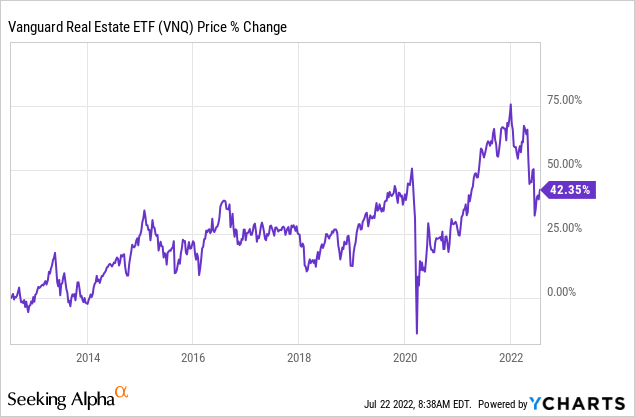
Lastly, the latest data (June) shows how real estate prices have slumped once more, returning to 2019 levels. I feel as though this justifies my claims made above.
This ETF Is At An Unfavorable Price Level
Before analyzing Vanguard’s Real Estate ETF, let’s establish the proximities between the ETF and the index it tracks, which is the MSCI US Investable Market Real Estate 25/50 Index. Vanguard’s ETF exhibits a 3-year tracking error of 10.17%, which shouldn’t be taken lightly as it’s definitely an anomaly. However, in some instances, we can still use the MSCI US Investable Market Real Estate 25/50 Index as a base case.
Now, let’s review the ETF’s primary holdings to gather an understanding of its exposure (the diagram below can be enlarged to gain a better view).
Although the company does have exposure to various operational real estate companies, it’s primarily focused on REITs with exposure to a wide variety of assets. Approximately 38% of the ETF’s exposure is in specialized REITs such as data centers and communication towers. More than 11.40% of its exposure is linked to industrial REITs. It also holds more than 6% exposure to office properties, and north of 15% of the fund is exposed to residential REITs.
Based on its holdings, this REIT is well-diversified, with exposure to data centers (secular growth) and communication tower REITs (non-cyclical REITs) separating it from the pack.
Seeking Alpha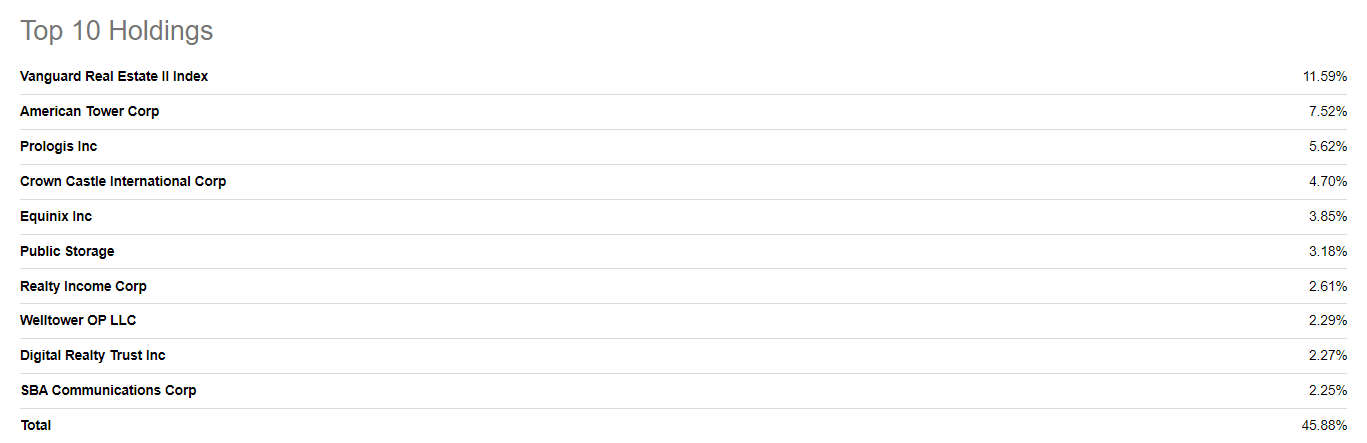
However, diversification doesn’t help much when there’s an intra-asset class bear market, and I refer back to the table in the previous section, which illustrates the year-to-date price slump of various REIT classes. Additionally, real estate operating stocks also hold true to cyclical downturns.
The diagram below is a four-factor pricing model that I ran to explain the returns of Vanguard’s Real Estate ETF. The model has respectable explanatory power with its F-stat’s p-value below 10% and its adjusted R-squared above 60%.
The general finding is that Vanguard’s Real Estate ETF presents a surplus return over the S&P 500 per unit of risk. However, the ETF exhibits a negative slope in relation to the momentum factor, illustrating that it can be subject to abrupt downturns, which is validated by its monthly 5%Var of 8.86%.
I’d like to think the asset’s negative momentum slope coalesces with what we’ve seen year-to-date, as it has slumped by more than 15% during a transitional period for global inflation and consumer spending power alike.
Portfolio Visualizer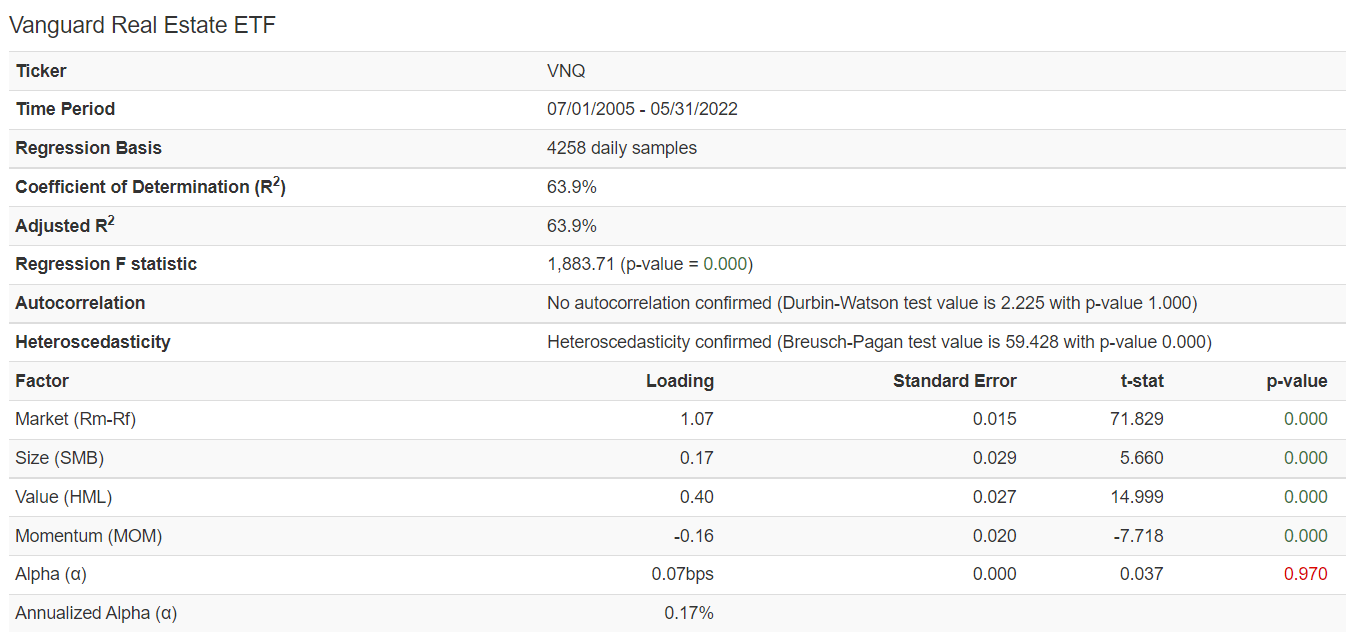
On The Flipside
Although I did mention a few contra points in the previous sections, it’s worth juxtaposing the analysis to avoid data snooping or confirmation bias.
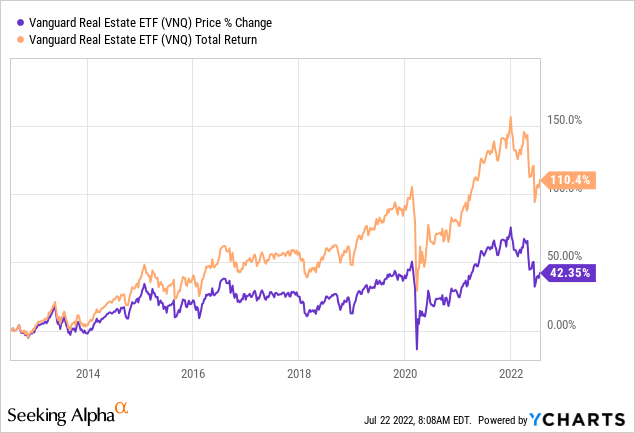
A potential upside for this ETF is its dividend payout and total return prospects. During the past ten years, the ETF has provided sumptuous total returns due to its consistent dividend distributions. As such, many longer-term investors will likely stay invested in the REIT, preventing abrupt price slumps.
Substance can be added to the above argument by examining the economic environment ahead. The odds are that we could be set for a prolonged period of high inflation, which means the real estate sector’s annual growth rates could remain robust.
Lastly, Vanguard’s Real Estate ETF isn’t overly exposed to residential REITs, which I see as a small bubble as many have bought homes with high-risk debt during the past two years, subsequently synthetically proliferating residential real estate prices. Instead, the ETF holds exposure to data centers, which have embedded growth potential, tower REITs and medical properties that are non-cyclical, and offices that are still arguably undervalued due to the WFH (work from home) emphasis in the past two years.
Concluding Thoughts
Although this ETF does provide total return prospects with diversification into embedded growth pockets such as the datacenter space, cyclicality is likely to cause a further short-term drawdown.
Furthermore, much is misunderstood about inflation and real estate performance, which is evident by comparing underlying fundamentals with investors’ current positive attitude towards REITs. As such, we think intra-asset class correlation could get the better of Vanguard’s Real Estate ETF in the back-end of this year.
Be the first to comment