

Michael Ver Sprill/iStock via Getty Images
Introduction
The Top Dividend Growth stock model expands on my doctoral research analysis on multiple discriminant analysis (MDA) adding new complexities with these top picks. Research shows that the highest frequency of large price breakout moves is found among small-cap stocks with low trading volumes, offering no dividends and delivering higher than average risk levels.
The challenge with the Top Dividend & Growth model is to deliver a combination toward optimal total return with characteristics that typically reduce the frequency and magnitude of price breakouts, but deliver more reliable growth factors for higher profitability longer term.
Market Conditions
2022 has delivered the worst half-year start to the stock market since 1970 and the worst start of the year returns for the Nasdaq in history. These terrible market results going back 52 years and longer have pared much of the strong initial gains in the prior portfolios, and the best approach is to follow the Momentum Gauges® as members have to avoid all major downturns.
FinViz.com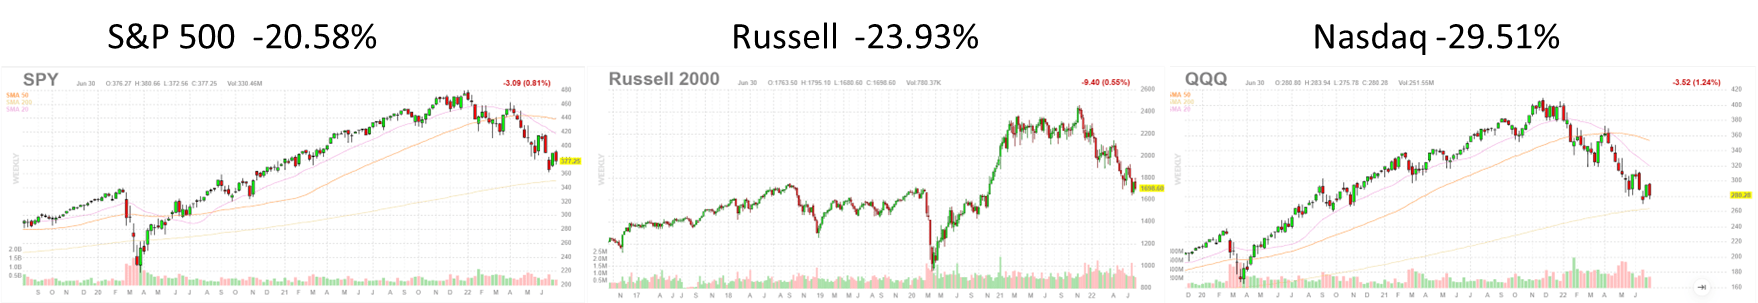
The long-term buy/hold Growth & Dividend mega-cap portfolio from January is down -2.50% YTD for 2022 with the 2-year average return greatly reduced to +9.72%.
June marked the start of the Federal Reserve’s first quantitative tightening event since 2018. The proposed liquidity reduction may have significant impact on markets as detailed in my recent article: How Markets May React To Fed’s QT Program
Selection criteria this month have been adjusted towards higher yield stocks and less volatile growth candidates in the energy sector, as market conditions remain very poor. The Monthly Momentum Gauges continue negative from the November signal. The best return results are achieved by following the Momentum Gauge signals and avoiding the worst downturns.
app.VMBreakouts.com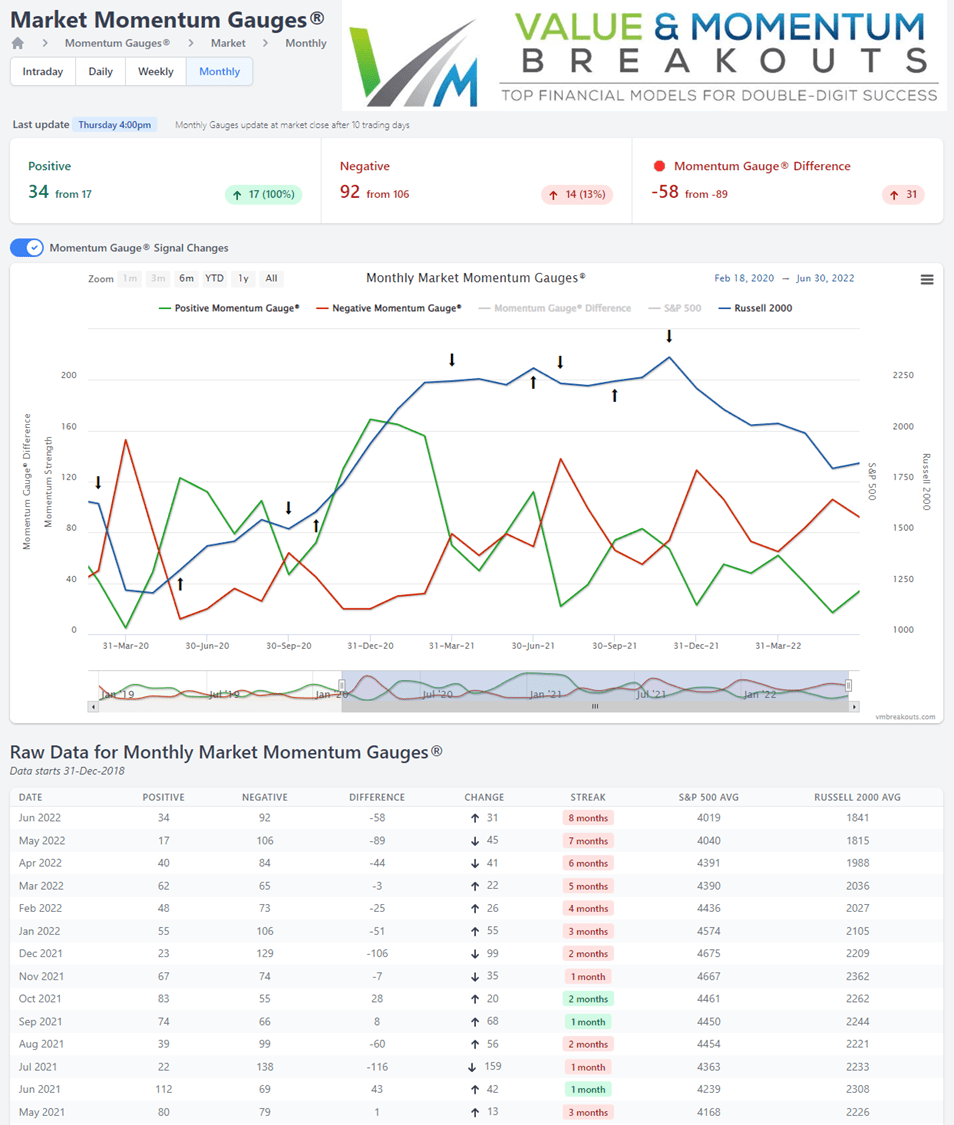
Readers are free to buy/hold for the one-year measurement period of each portfolio, hold longer, or update your Growth & Dividend portfolios with newer selections.
Each monthly selection portfolio consists of 5 stocks above a minimum $10 billion market cap, $2/share price, 500k average daily volume and a minimum 2% dividend yield. The population of this unique mega-cap segment is approximately 330 stocks out of over 7,800 stocks across the US stock exchanges. While these stocks represent less than 5% of available stocks, their market cap exceeds $19 trillion out of the approximately $33 trillion (57.6%) of the U.S. stock exchanges. Efforts are made to optimize total returns on the key MDA price growth factors (fundamental, technical, sentiment) for the best results under these large-cap constraints with high priorities for dividend growth and dividend yield.
2 Top Growth & Dividend Stocks For Aug 2022
Score Overview of the Growth & Dividend Stocks for August
StockRover.com
Dividend Calendar
StockRover.com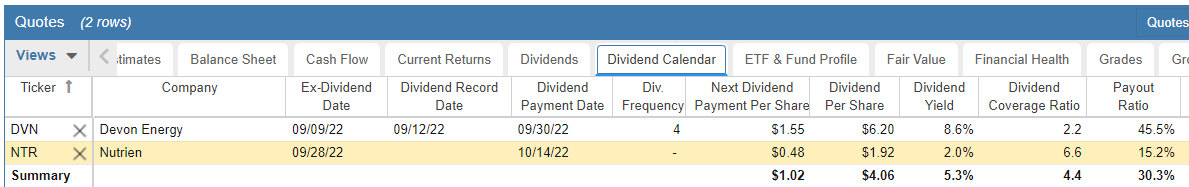
The factors shown above are not necessarily selection variables used in the MDA analysis and dividend algorithms for growth and strong total returns. Dividend yield for all these selections is well above 2% minimum for this portfolio and as high as 7.8% in the full July selections. These are among the highest dividend-yielding mega-cap stocks with strong growth and may attract strong net inflows if market conditions contribute toward more defensive positions. These additional financial perspectives and reports are included to enhance your investment decisions for total returns. The returns shown in all the annual measurements do not include any of these large dividend yields.
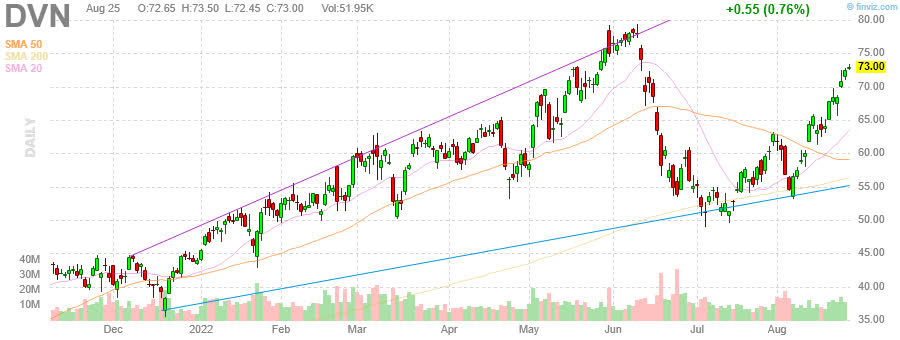
Devon Energy Corp.
FinViz.com
StockRover.com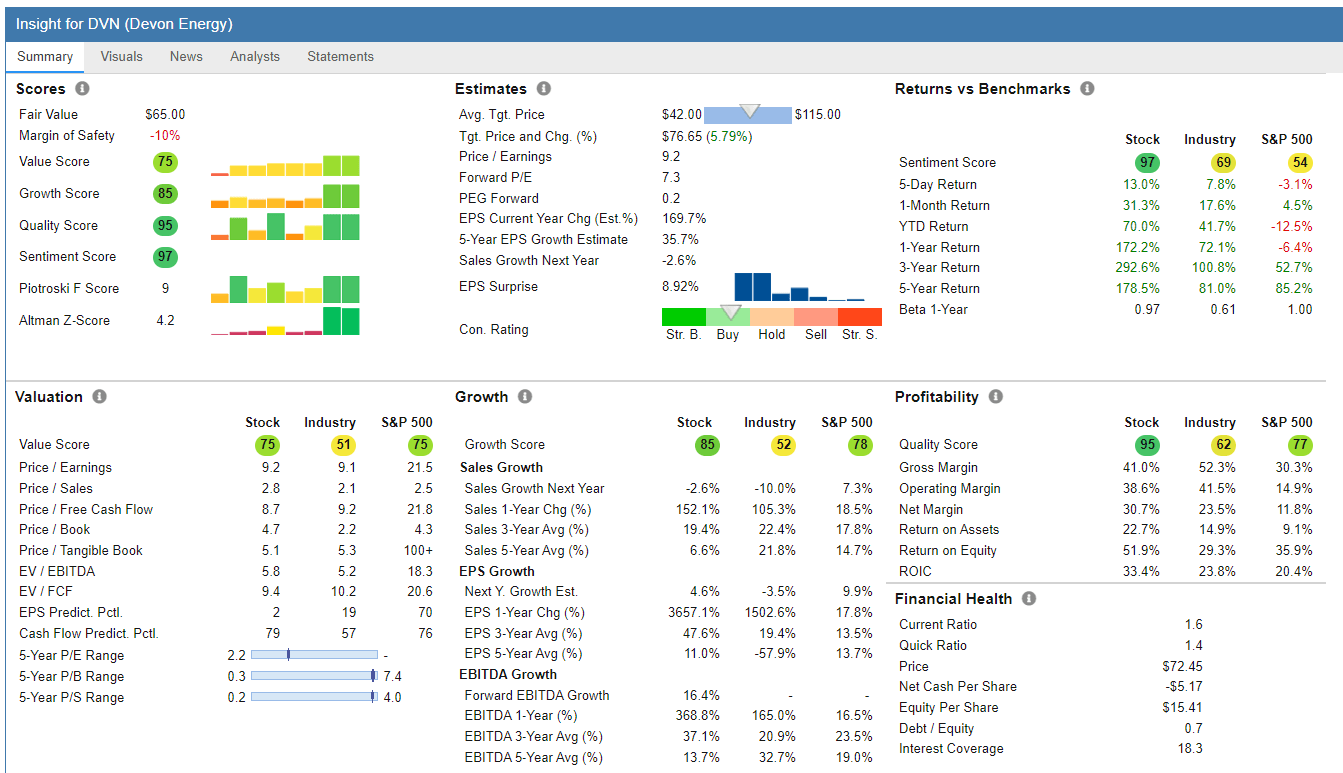
StockRover.com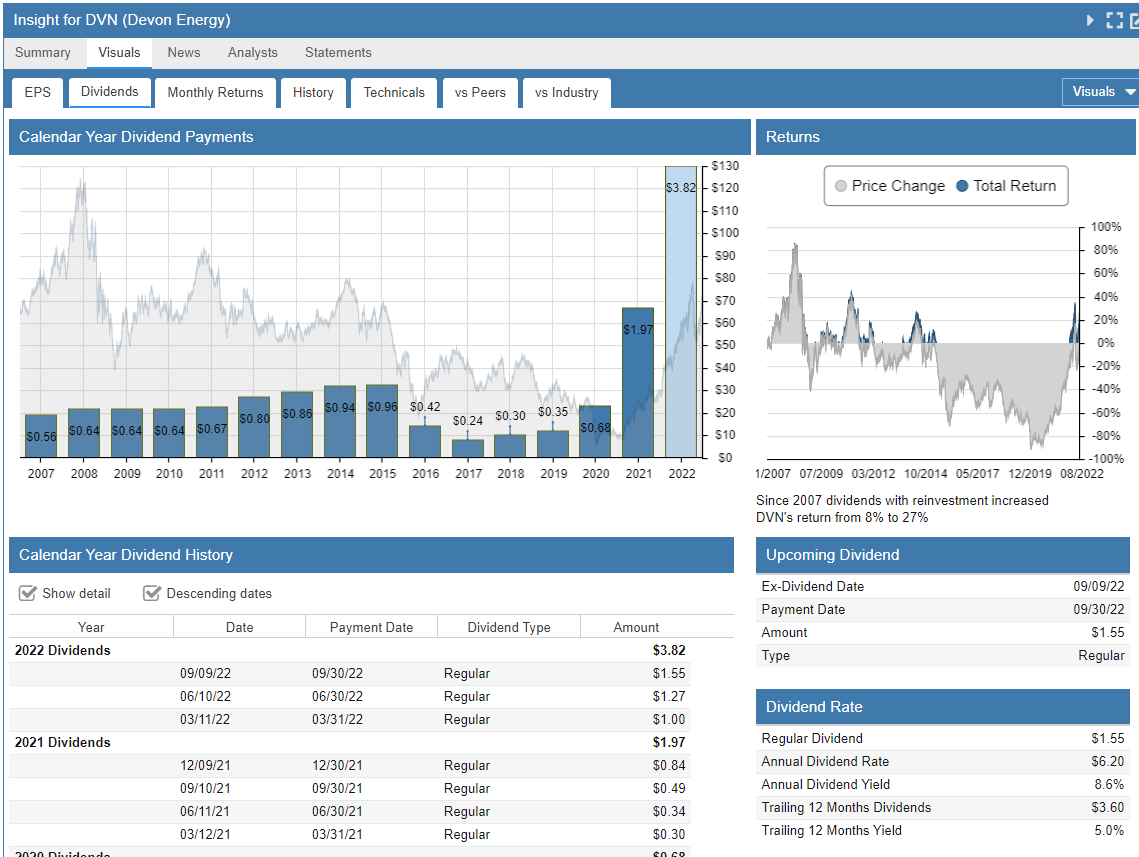
Devon Energy Corporation, an independent energy company, primarily engages in the exploration, development, and production of oil, natural gas, and natural gas liquids in the United States.
(Source: Company Resources)
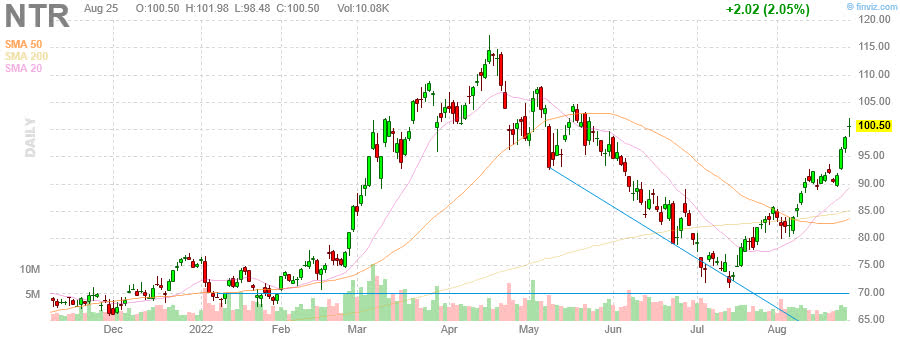
Nutrien Ltd.
FinViz.com
StockRover.com
StockRover.com
Nutrien Ltd. provides crop inputs and services. It offers potash, nitrogen, phosphate, and sulfate products; and financial solutions. The company also distributes crop nutrients, crop protection products, seeds, and merchandise products through approximately 2,000 retail locations in the United States, Canada, South America, and Australia.
(Source: Company Resources)
Prior 2-year Returns of Long Term Dividend Portfolios
These selections are down significantly from their highs, but still outperforming the stock market and the major hedge fund averages since inception. Consider also the actively managed ARK Innovation ETF (ARKK), down -53% YTD and the Barclay Hedge fund index -10.5% YTD.
The current 2-year returns to date on the MDA Growth & Dividend selection model, not including any of the large % dividend total returns from all stocks:
VMBreakouts.com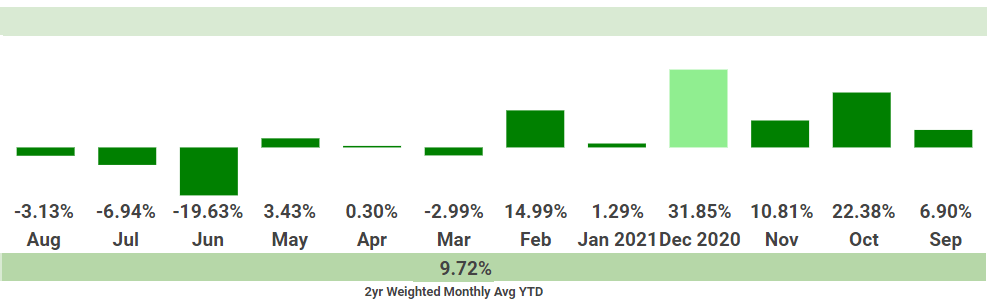
Current returns through August are also lower but are significantly beating the S&P 500 YTD on average not including added high dividends from every selection:
VMBreakouts.com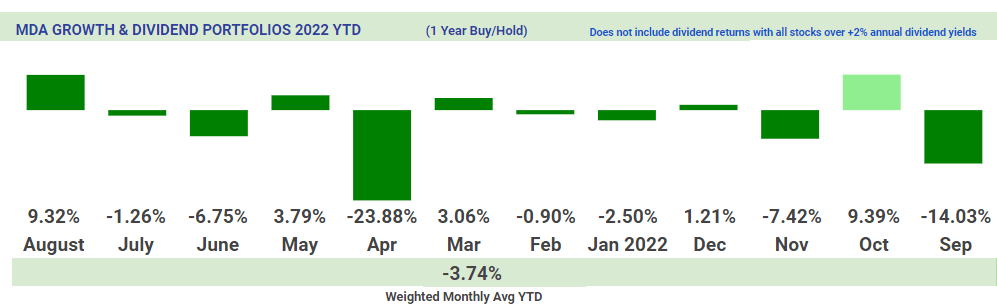
The 3-year average returns from 2020 are above +34.0% and down significantly during the 2022 market declines. However, these strong dividend stocks are still beating the benchmark indices, not including large dividends from each of the selections.
VMBreakouts.com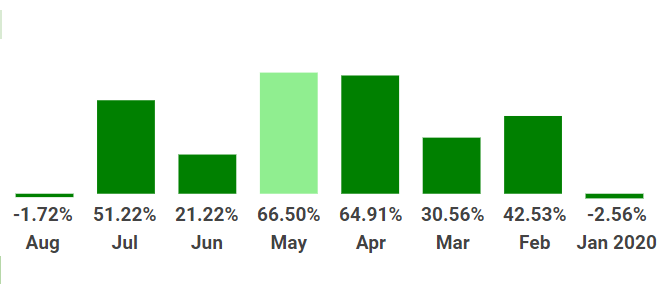
Prior Long-Term Gainers To Consider
This section is a brief review of strong prior selections that have delivered on the long-term growth forecast YTD. From the start of the year across all the long-term Growth & Dividend MDA selections, the following stocks have significantly outperformed on price alone, not including dividends. Many of these stocks are in more than one monthly selection portfolio, as high variable standard criteria often produce a small pool of strong candidates with frequent overlap.
These selections are significantly outperforming major Hedge Funds in 2022 and the hedge fund benchmarks since inception.
The 2021 Year End Report Card for the Growth & Dividend MDA breakout stocks is available here.
| Symbol | Company | Price | Return from Selection |
| (COP) | ConocoPhillips | 110.52 | 162.52% |
| (KLAC) | KLA Corp. | 362.67 | 152.31% |
| (LLY) | Eli Lilly and Co. | 318.87 | 129.87% |
| (INFY) | Infosys Ltd. ADR | 19.25 | 108.56% |
| (AMP) | Ameriprise Financial, Inc. | 277.74 | 98.29% |
| (HPQ) | HP Inc. | 33.22 | 90.59% |
| (MTB) | M&T Bank Corporation | 184.34 | 77.97% |
| (KR) | Kroger Co. | 49.66 | 76.54% |
| (BLK) | BlackRock, Inc. | 700.42 | 59.20% |
| (TSM) | Taiwan Semiconductor Mfg. Co. Ltd. | 85.56 | 58.92% |
*Returns to date on the MDA Growth & Dividend selection model do not include large dividends from each stock:
Conclusion
These stocks continue a live forward-testing of the breakout selection algorithms from my doctoral research applied to large cap, strong dividend growth stocks. None of the returns listed above include the high dividend yields as part of the performance, and would further increase total returns for each stock. These monthly top Growth & Dividend stocks are intended to deliver excellent long-term total return strategies, leveraging key factors in the MDA breakout models used in the small-cap weekly breakout selections.
These selections are being tracked on the V&M Dashboard Spreadsheet for members and enhancements will continue to optimize dividend, growth, and higher breakout frequency variables throughout the year. The best return results are achieved by following the Momentum Gauge signals and avoiding the worst downturns.
All the very best to you!!
JD Henning, PhD, MBA, CFE, CAMS
Be the first to comment