

Philip Thurston/E+ via Getty Images
In this article, we take a look at the mechanics behind the Cboe Volatility Index (VIX) and its historical behaviour, before exploring two simple strategies commonly employed to profit from fluctuations in the VIX. We highlight how both the ProShares VIX Short-Term Futures ETF (BATS:VIXY) and the ProShares Short VIX Short-Term Futures ETF (BATS:SVXY) can be used interchangeably to profit from extreme fluctuations in the VIX. When executed with discipline, we view systematic volatility trading strategies as a valuable tool for enhancing portfolio returns over time.
VIX, VIX Futures, And Finally The VIXY & SVXY
Financial media often refers to the VIX as the “fear gauge” of the U.S equity market. A simple generalization of how the VIX work goes like this: “When the market is calm the VIX goes down. When the market is fearful the VIX goes up”. While this description is generally true, it is crucial to understand the underlying mechanics of the VIX before one can devise strategies to trade the VIX profitably.
Without diving too deeply into the theory of derivative pricing, we briefly outline some of the key principles underlying the VIX, VIX futures, and finally exchange-traded funds such as the VIXY and SVXY. Informed traders may choose to skip this section.
Summarising definitions by the Cboe, the VIX Index is a benchmark designed to provide an up-to-the-minute market estimate of the implied volatility of the S&P 500 Index. The VIX is calculated by using the midpoint of real-time S&P 500 Index (SPX) option bid/ask quotes. More specifically, the VIX Index is intended to provide an instantaneous measure of how much the market thinks the S&P 500 Index will fluctuate in the 30 days from the time of each tick of the VIX Index.
Thus if market participants expect greater uncertainty and volatility in the SPX, there is greater value in holding options. This is because an option gives the holder the right, but not the obligation, to buy the underlying security at the strike price on or before expiration. In other words, an option gives the holder downside protection and theoretically unlimited upside potential, at a price. As such, options become more valuable, the greater the volatility of the underlying is expected to be, all else equal.
Because the VIX is merely an index that tracks the prices of SPX options in real time, it does not actually hold any of the options. The VIX also constantly changes the options which it tracks in order to maintain a constant maturity of 30 days. As such, it is technically not possible to buy or sell the VIX. So VIX futures were created by the Cboe in 2004 to allow traders to take a position on the VIX.
Finally, according to fund information, the VIXY provides long exposure to the S&P 500 VIX Short-Term Futures Index, which measures the returns of a portfolio of monthly VIX futures contracts with a weighted average of one month to expiration. The SVXY provides one-half inverse exposure to the same index.
Differences Between The VIXY & SVXY
Both the VIXY and SVXY track the VIX very closely in the very short term. As the accompanying chart shows, within a 30-day time frame, the VIXY can quite effectively replicate the performance of the VIX with an acceptable tracking error relative to the magnitude of the moves. The VIXY is down -15% while the VIX is down -16.6% in the chart. Similarly, the SVXY achieves half the inverse performance of the VIX and is up +8% over the same period. As such, both are suitable for tracking the performance (or the inverse) of the VIX given a short time horizon.
30-day percentage change in the VIX, VIXY, and SVXY. (Investing.com, Cboe, ProShares)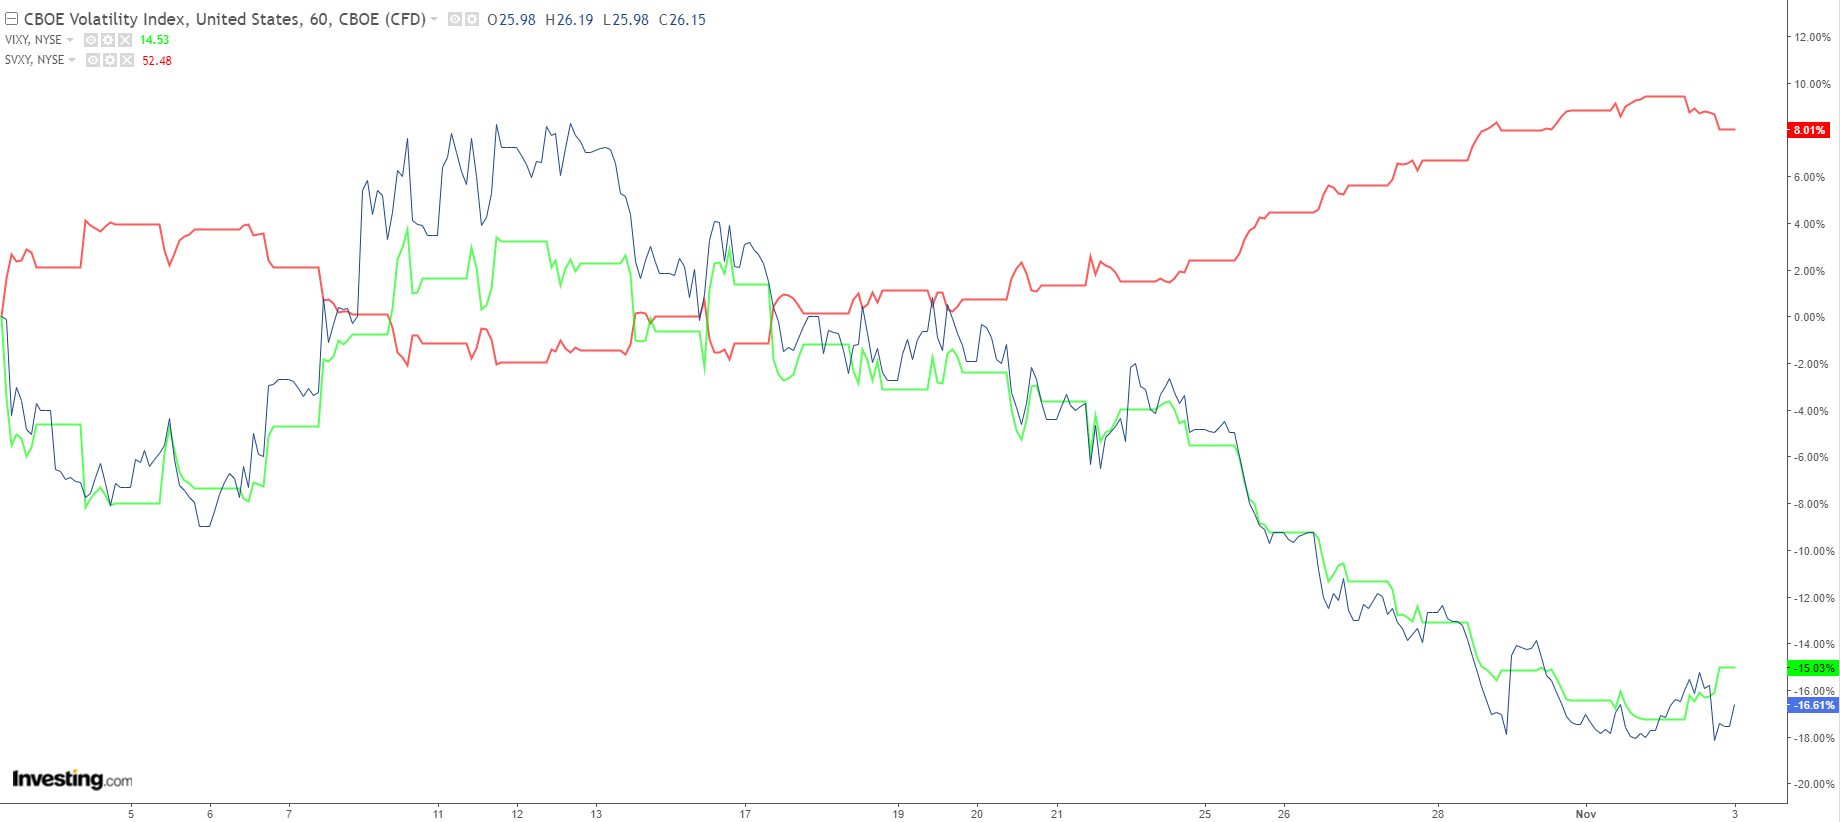
However, as the next chart shows, when we extend the time horizon to a year, the tracking effectiveness of the ETFs completely breaks down. In this example, the VIX is up around 62.7% from a year ago, but both the VIXY and SVXY are registering -13.5% and -16.5% losses, respectively.
1-year percentage change in the VIX, VIXY, and SVXY. (Investing.com, Cboe, ProShares)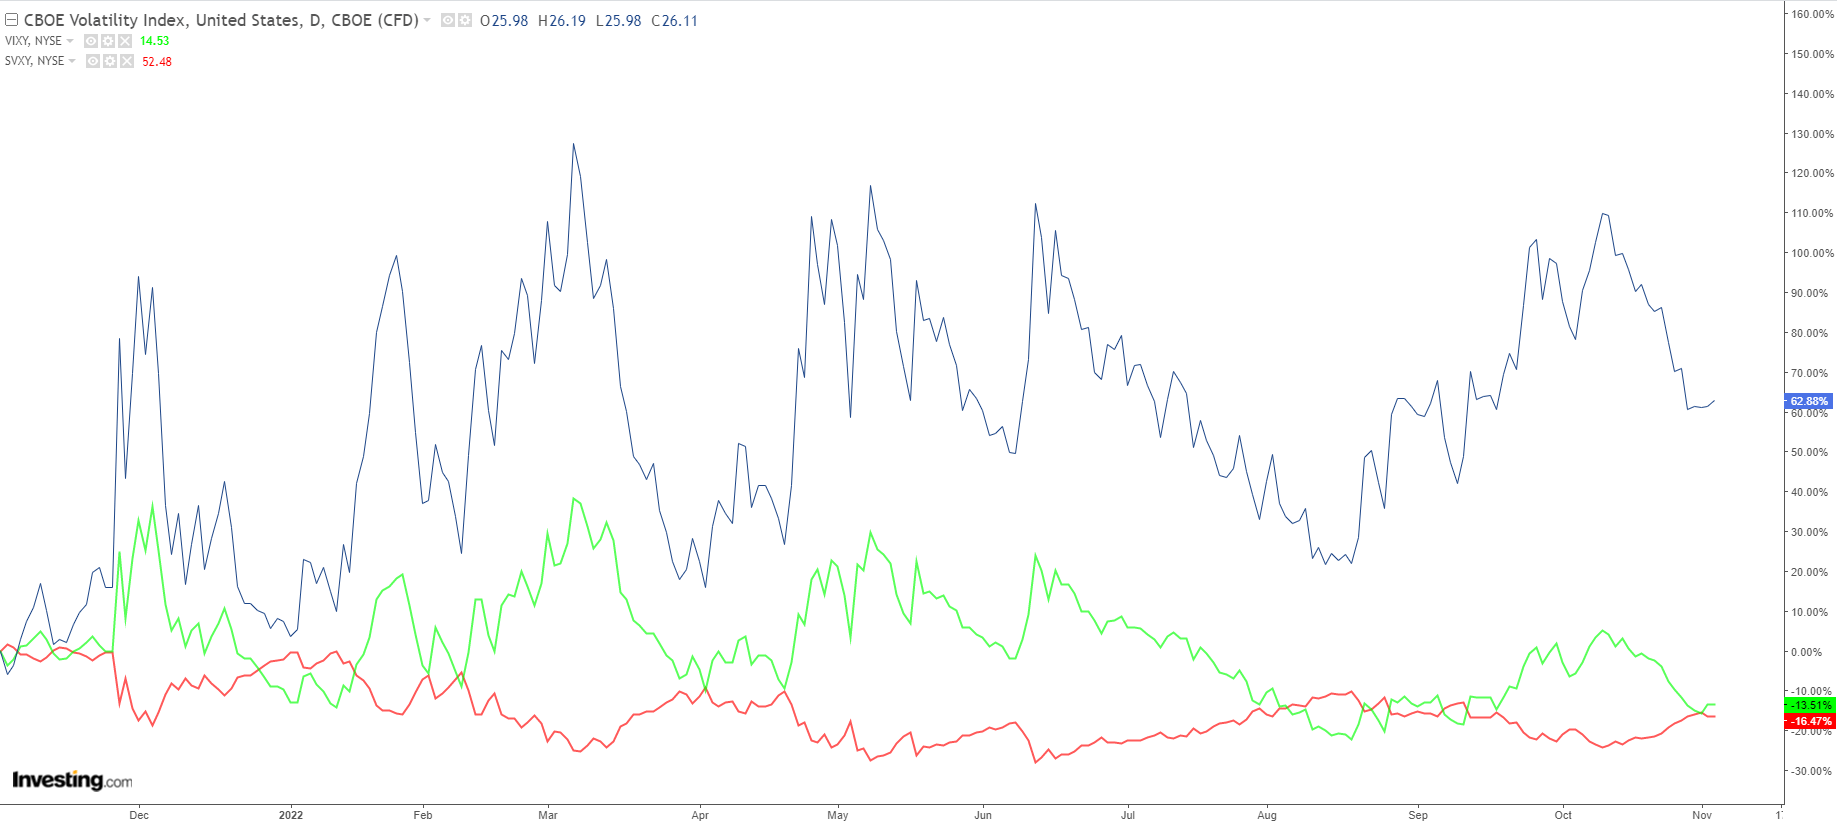
The reason for this stark difference in performance is due to the cumulative effects of contango. In the futures market, contango refers to when the price of futures contracts that expire further in time is higher than the price of contracts with a closer expiry. For example, if VIX futures due to expire soon are trading at 20, and VIX futures that are a month away from expiry are trading at 22, then the market is considered to be in contango.
Due to VIX ETFs having to constantly switch out nearer futures contracts for contracts that are further away from expiry in order to maintain the constant 30-day maturity that the VIX is tracking, the cost of switching contracts adds up over time when the market is in contango. Most of the time, futures markets are in contango.
This characteristic of the futures market presents a difficult challenge for traders. That the VIXY and SVXY are effective tools to trade the VIX only in the short term but are destined to become losing trades the longer one extends the holding period. Next, we explore the behaviour of the VIX over time.
A Historical Perspective Of The VIX’s Behaviour
Below is a histogram showing the frequency distribution of daily VIX levels at the close since January 1990. Over the past 30 years, the VIX has never closed below 9.14 points or above 82.69 points. Considering intraday levels, the VIX’s absolute low and high are 8.56 and 89.53, respectively. For our purposes, we will only refer to the VIX’s daily close from hereon.
Stratos Capital Partners, CBOE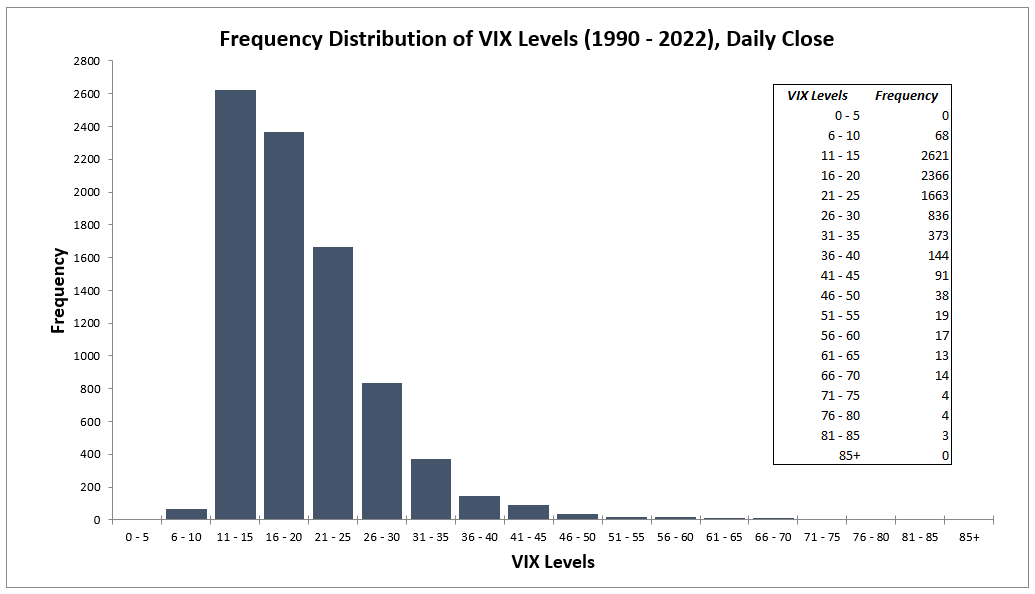
In percentage terms, the VIX closes under 20 points 61% of the time, below 30 points 91% of the time, below 40 points 98% of the time, and below 50 points 99% of the time. So in short, the VIX very rarely spikes above 40 and on the occasions when it did, it doesn’t stay above 40 for very long. There is a tendency for implied volatility to reverse quickly when the VIX is at extreme highs and drift lower over time when markets are relatively calm.
Stratos Capital Partners, CBOE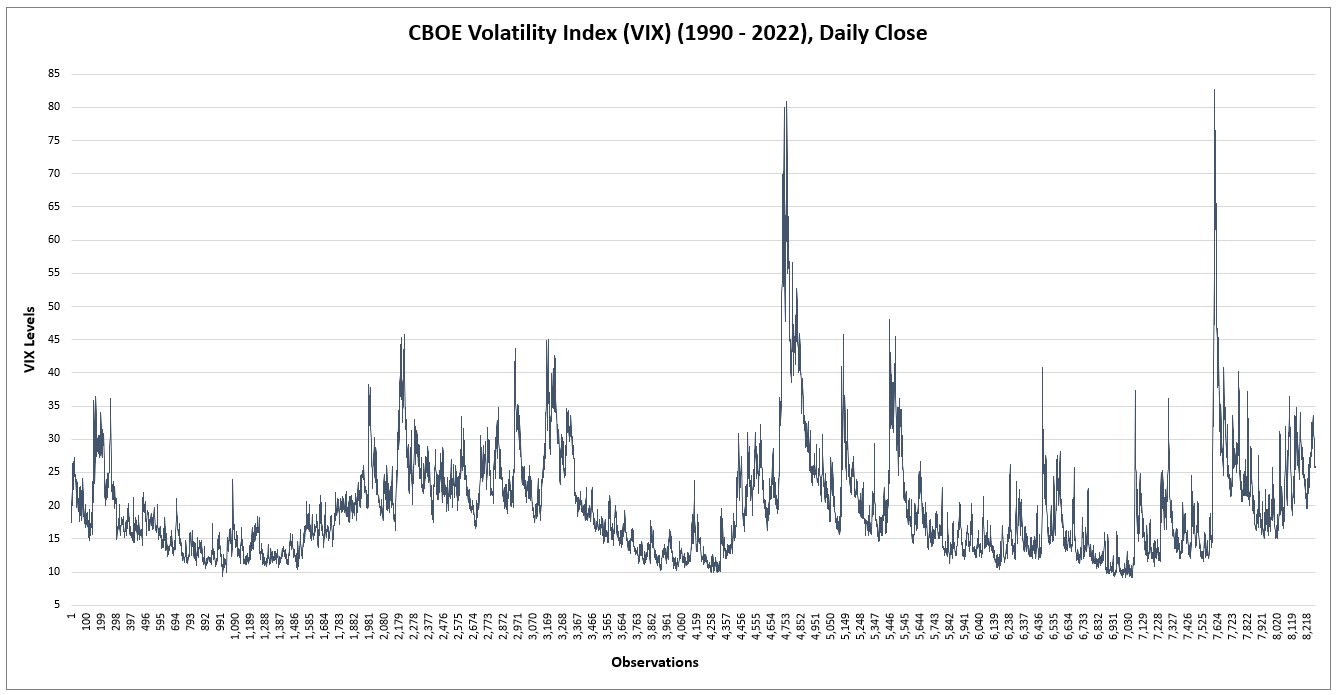
Strategies To Trade The VIXY & SVXY
Now that we have a good understanding of how VIXY and SVXY work to track the upside/downside performance of the underlying VIX and have looked at the index’s behaviour, we can choose from two broad categories of strategies.
- Long VIXY Strategy – Taking a long position in VIXY (Long VIX) in anticipation of a spike in the VIX. This strategy aims to capture exceptionally large returns but will suffer losses arising from the tendency for the VIX to drift lower over time. The difficulties with trading this strategy lie in predicting when large spikes may occur with precision and determining the appropriate level to take profit without risking an equally sharp reversal in implied volatility.
- Long SVXY Strategy – Taking a long position in SVXY (Short VIX) upon seeing an extraordinarily large spike in the VIX. This strategy aims to capture sharp reversals in implied volatility and steady returns from the tendency for the VIX to drift lower over time. However, this strategy risks suffering sharp losses arising from further increases in the VIX after the short position has been established. There is also significant difficulty in determining the appropriate level to take profit given the risk of another sharp
Both Strategies Can Work, But Only When VIX Is At Extremes
Although long VIX strategies using the VIXY to capture the rare above-50 spikes in the VIX may seem extremely lucrative (400%+ returns), such opportunities are really rare. Even if long strategies were designed to target smaller above-30 spikes, these opportunities also happen so quickly that catching these moves would require exceptional precision.
Furthermore, given the downward bias for the VIX to drift lower over time due to the reasons we have highlighted earlier, long VIX strategies suffer losses that can add up very quickly if a spike in implied volatility does not materialise. Thus, there is some sort of a time limit as to how long these strategies can afford to wait.
On the other hand, short VIX strategies using the SVXY to capture sharp reversals in the VIX following a large spike may be more difficult to execute in reality. Not only is it difficult to determine when sharp spikes in the VIX will peak, but attempts to capture returns from the VIX drifting lower also risks suffering another sharp spike in the VIX. Furthermore, given that there is theoretically no limit as to how high the VIX can go, many traders describe short VIX strategies as “picking pennies in front of a steamroller”.
Despite these difficulties, we still see the potential for trading the VIX profitably. However, this would require that traders be highly selective in their entry points by only trading when the VIX is at extreme highs and lows. Based on our earlier study of the frequency distribution of fluctuation VIX levels since 1990, we target buying the VIXY when the VIX is below 15 points and buying SVXY when the VIX is above 40.
These levels provide the optimal reward-to-risk for trading the VIX in our view. We acknowledge that such a passive strategy is likely to generate very few trades each year and this could make the annual performance of this strategy look somewhat less impressive. Nonetheless, we believe that the occasional returns from this strategy can significantly enhance portfolio performance over time.
High Expense Ratios, But More Than Compensated By Potential Returns
Lastly, we think it is worth highlighting that due to the heavy trading involved with tracking the VIX, both the VIXY and the SVXY come with high expense ratios that vary from around 1.1% to 1.4%. Given that these ETFs are only suitable for short-term trading, and that the magnitude of potential returns may be relatively high, we believe that these high expense ratios are somewhat less of a deterrence for traders.
In Conclusion
We conclude that both the VIXY and SVXY are valuable tools for enhancing portfolio performance whenever the VIX is at an extreme low or high. We target buying the VIXY when the VIX is below 15 points and buying SVXY when the VIX is above 40.
We initiate our coverage of both VIXY and SVXY with a “Hold” rating for now, with the intent to initiate a directional call on the VIX when the conditions for our strategy are met.
Be the first to comment