

Justin Sullivan
Risk Forecast
The below chart is a prediction of value at risk and potential return of holding Visa (NYSE:V) stock. As shown by the blue intrinsic value region, Visa has not traded at such a discount since early spring of 2020. It should be noted that COVID was taking a serious bite out of revenue, earnings, and margins at that time. All three are now intact and forecasted to increase on trend.
Authors Image from Financial Modeling Prep Data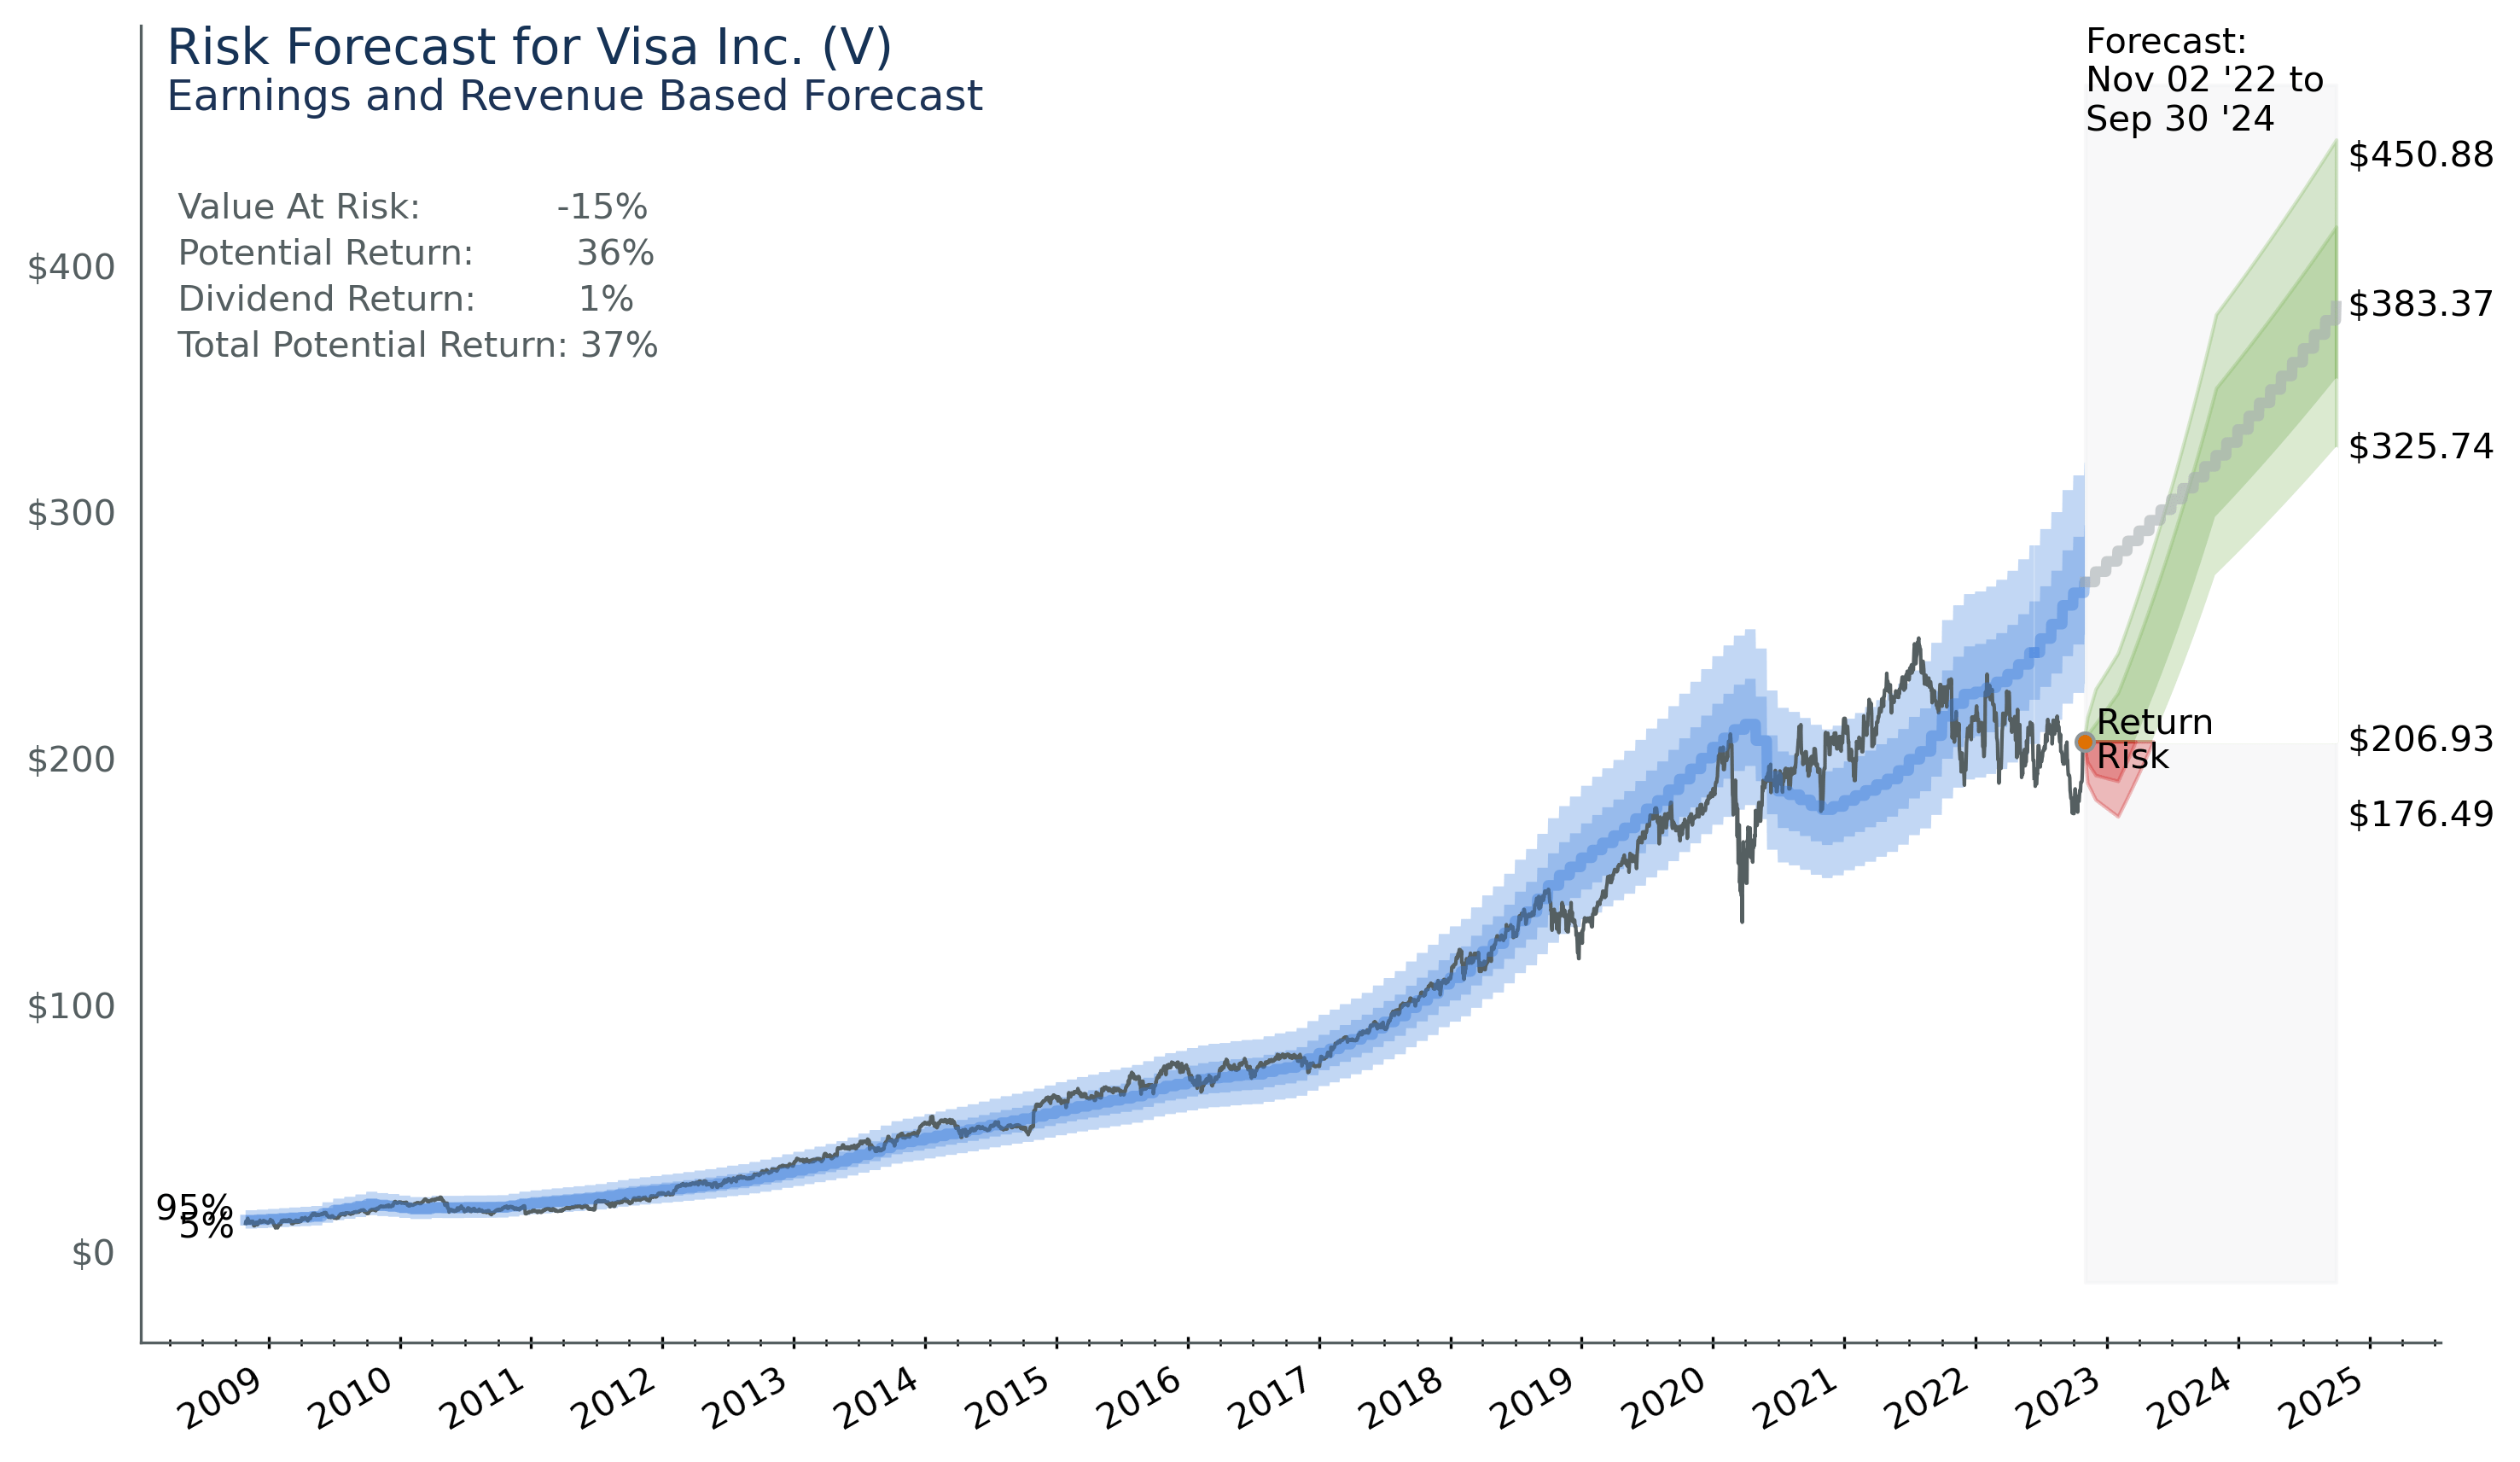
The low-price prediction of $176.49 is based on historic short-term volatility and although you could still take a hit of 15% it would only happen from extreme pessimism. Pessimism from something like Russia going nuclear, the Fed raising rates well above current expectations, or some major catastrophe inside Visa. With a central forecast of $383.37 potential yearly returns are as high as 36%.
Lots of Explanation Required
You have probably seen lots of price predictions based on CAGR, DCF, NPV, and other valuation schemes. These all provide insight, but we know the outputs are heavily dependent on assumptions like discount factors. This probably just looks like another one of these estimates that are highly dependent on assumptions. It would look like this to me. The reason why this forecast is different is that it works without me putting in any magic numbers. The algorithm avoids assumptions and tries everything until it finds an optimum setting. I could throw out a plethora of statistics, but how about a video.
Look at the video below to see how the software model learns to forecast Visa and see its performance every quarter.
Visa Risk Forecast Performance
If you watched that video, you could see the algorithms do a pretty good job of predicting long term price movement. As it steps through time every three months it provides a forecast for the next two years. The actual price tends to lie at the bottom of the price prediction, so for Visa it tends to provide a valuation that is a bit high. This upwardly biased forecast is due to the relatively short time Visa has publicly available data for. It went public in 2008 which eliminates the period prior to the Financial Crisis of 2007-2008. Although the model did react well to the loss of revenue and earnings from COVID we should probably accept that there is some positive bias in the forecast. This means that we are more likely to see a price of $325 in September of 2024 than a price of $450. Still with this in mind Visa is poised to well outperform the market in the next two years.
As you also saw in the video, price will go outside the blue bands. Those bands are there to show you where the price should be 90% of the time.
This forecast, and forecasts for other stocks as well, tend to lag price when it goes down and lead when it goes up. This makes it useful to determine risk in a stock, but it is less reliable for market timing. That said, I am unaware of any market timing schemes that stand up to robust analysis. Still, I haven’t given up the search.
Long-Term Economic Prospects
In his 2007 Letter to Shareholders Warren Buffett provided us with clear insight on what it takes to be a great business. He put it simply: “it is far better to have an ever-increasing stream of earnings with virtually no major capital requirements.” He has spoken of this concept time and time again and further defines it as returns on unleveraged net tangible assets. If a company needs less money to grow, it can grow faster. We unleverage the assets to compare companies on a risk adjusted basis this way a company with a bigger debt and risk appetite does not appear superior to a company with less debt.
The following chart shows just that. Here Visa is clearly in the top tier of companies. The blue shaded area here shows the distribution of all other companies in the S&P 500 since Visa’s IPO in 2009.
Visa has been in the best 15% of companies since 2010. This proves the company can grow and grow very fast.
Authors Image from Financial Modeling Prep Data
There is more information to glean from the above chart. The Financial Crisis and COVID can both be clearly seen from dips in earnings across the S&P 500. No similar dip is visible right now, but we could be seeing a peak last quarter. It could also just be some volatility like you can see in 2013. I don’t know how predictive this is, or if we can exploit it, but it is something to watch. If I can train an algorithm to create a forecast that is fit to print, I will include it in one of my next articles.
Bottom Line
Visa’s economic performance looks great, and its return on unleveraged net tangible assets looks even better. Visa just announced results and beat on both earnings and revenue. The beat wasn’t huge but given the depressed valuation, Visa looks good in both the long and short term. In short, Visa is still everywhere you want to be.
I’m just getting started and will be writing similar articles on the over 700 stocks and ETFs my software can forecast.
Be the first to comment