

Scott Olson
By Valuentum Analysts
At Valuentum, we like to use a metric called the Dividend Cushion ratio to evaluate a company’s dividend health. At its core, the Dividend Cushion ratio is designed to provide the dividend growth investor and the income investor with a forward-looking, free-cash-flow based opinion of the strength and future growth potential of a company’s dividend. The ratio not only highlights risks associated with potential dividend cuts, but the ‘cushion’ behind the Dividend Cushion reveals just how much capacity a firm has to continue growing its dividend in the future, above and beyond existing expectations.
The Dividend Cushion ratio is one of the most powerful financial tools an income or dividend growth investor can use in conjunction with qualitative dividend analysis. The ratio is one-of-a-kind in that it is both free-cash-flow based and forward looking. Since its creation in 2012, the Dividend Cushion ratio has forewarned readers of approximately 50 dividend cuts. We estimate its efficacy at ~90%. (Image Source: Valuentum)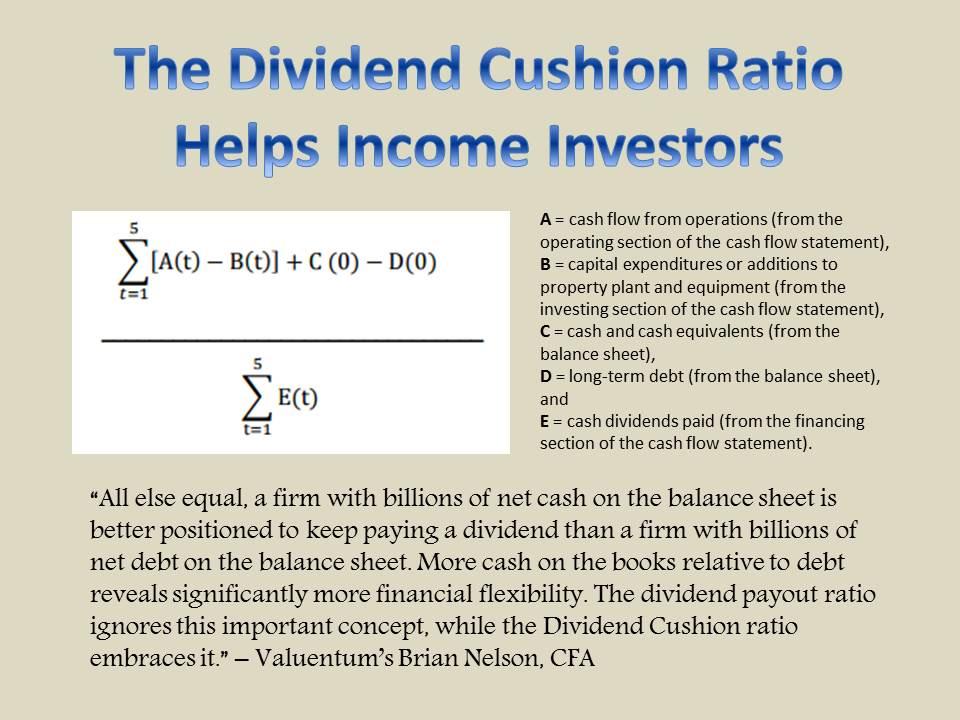
The foundation behind the measure–assessing future free cash flows relative to future cash dividend payments in the context of a company’s balance sheet–remains as relevant as ever.
For example, Lumen Technologies (LUMN) announced November 2 that it would eliminate its payout. The interesting thing about Lumen Technologies was that it had a strong dividend payout ratio and free cash flow coverage of the dividend, but what it did not have was a strong net cash on the balance sheet. In fact, it had a huge net debt position, and management cut the dividend. Where other dividend metrics failed to identify the risks of the payout, the Dividend Cushion ratio passed with flying colors.
Now, let’s take a look at Best Buy (NYSE:BBY) in the same systematic dividend framework, but some background first.
Best Buy’s Key Investment Considerations
Image Source: Valuentum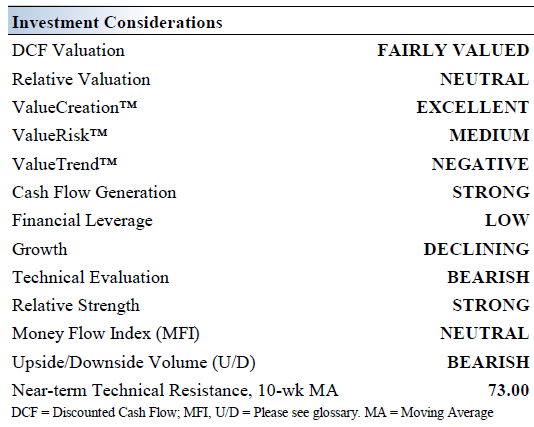
Best Buy is the global leader in consumer electronics as far as big box retailers go. The company must continue to reinvent itself to mitigate competitive pressures from online powerhouses including Amazon (AMZN). Best Buy has notable market share in areas such as home theater, notebooks, and desktops. It was founded in 1966 and has managed the ups and downs of many economic cycles.
In October 2021, Best Buy launched its Totaltech membership program that among other things offers discounted and free Geek Squad services, free warranties on qualified products, special discounts, and cheaper and faster shipping rates.
Sales of consumer electronics surged in the wake of the COVID-19 pandemic as households turned to work-from-home and school-from-home activities. Going forward, those tailwinds are turning into headwinds, and Best Buy will likely not be able to sustain that level of revenue growth. The firm is leaning on its e-commerce operations to remain relevant in the digital era.
Best Buy completed its exit of Mexico in fiscal 2021. The company aims to keep its remaining physical footprint relevant by focusing on the customer experience (retaining a staff knowledgeable of tech products and services) and by offering relevant tech product and service support, and installation services.
Best Buy continues to be a solid generator of free cash flow. The company’s e-commerce business has impressed of late, but cost pressures from rising labor and transportation expenses cannot be ignored.
Latest Quarterly Results
We last wrote up Best Buy on Seeking Alpha way back in August 2018, and the company continues to battle online competition and find ways to innovate to keep its big box presence alive. The company reported its fiscal second-quarter results on August 30 (for the period ending July 30, 2022), and while enterprise comparable store sales faced pressure, its two-year stacked comp was still healthy at 7.5% — two-year stacked comps are derived by adding the comparable store sales percentage for the past two year-over-year quarters. Here is what management had to say about the quarterly performance:
We are clearly operating in an uneven sales environment. As we entered the year, we expected the consumer electronics industry to be softer than last year following two years of elevated growth driven by unusually strong demand for technology products and services and fueled partly by stimulus dollars. The macro environment has been more challenged due to several factors and that has put additional pressure on our industry.
Inflationary pressures are hurting consumers, but as Best Buy’s operations normalize after the uneven sales cycle that happened during COVID-19, we expect it to overcome challenges and stable-to-modest growth to resume. That said, comparable store sales may continue to decline a bit more than expectations this year given potential recessionary conditions as we head into the all-important holiday season (difficult year-over-year comparisons won’t help).
Free cash flow remains positive at Best Buy, coming in at $268 million during the first half of its fiscal year, but it fell short of its cash dividends paid of $397 million over the same time period. This is a red flag. The company no longer retains a net cash position at the end of its fiscal second quarter either, with Best Buy now holding a net debt position of $344 million. Its net cash position at the end of July 2021 was ~$3 billion and $1.72 billion, excluding short-term debt (as shown in the Dividend Cushion calculations below), as of its last fiscal year end (January 29, 2022).
Readers should keep these important mid-year changes in mind as we evaluate Best Buy’s Dividend Cushion ratio using last fiscal year’s net cash position and forecasts of free cash flow. For the Dividend Cushion ratio, we use a company’s balance sheet from last fiscal year and generally do not make interim updates within the Dividend Cushion ratio for the balance sheet given cash-flow considerations and seasonal changes for retailers through the course of the year (e.g. inventory builds and the like).
Readers, however, should be aware of what could be a big expected swing in the Dividend Cushion ratio come next fiscal year as a result of Best Buy’s balance sheet health. Weakened free cash flow coverage of the payout through the first half of its fiscal year and a net debt position have happened suddenly at Best Buy, and we’ll provide an adjusted interim Dividend Cushion ratio below to help readers assess the situation, in addition to last fiscal year’s snapshot (which is provided in the image).
Best Buy’s Dividend Health Analysis
Dividend Cushion Cash Flow Bridge Evaluation (Image Source: Valuentum)
The Dividend Cushion Cash Flow Bridge, shown in the image above, illustrates the components of the Dividend Cushion ratio and highlights in detail the many drivers behind it. Best Buy’s Dividend Cushion Cash Flow Bridge reveals that the sum of the company’s 5-year cumulative free cash flow generation, as measured by cash flow from operations less all capital spending, plus its net cash/debt position on the balance sheet, as of the last fiscal year, is greater than the sum of the next 5 years of expected cash dividends paid.
Because the Dividend Cushion ratio is forward-looking and captures the trajectory of the company’s free cash flow generation and dividend growth, it reveals whether there will be a cash surplus or a cash shortfall at the end of the 5-year period, taking into consideration the leverage on the balance sheet, a key source of risk.
On a fundamental basis, we believe companies that have a strong net cash position on the balance sheet and are generating a significant amount of free cash flow are better able to pay and grow their dividend over time. Firms that are buried under a mountain of debt and do not sufficiently cover their dividend with free cash flow are more at risk of a dividend cut or a suspension of growth, all else equal, in our opinion. Generally speaking, the greater the ‘blue bar’ to the right is in the positive, the more durable a company’s dividend, and the greater the ‘blue bar’ to the right is in the negative, the less durable a company’s dividend.
As of last fiscal year, things were looking okay for Best Buy (as shown above). However, after considering what could happen to the firm’s balance sheet at the end of the its fiscal year coupled with weakening free cash flow coverage of the dividend, Best Buy’s Dividend Cushion ratio will likely come out closer to 1 at the end of the upcoming fiscal year. We tend to like company dividends that have Dividend Cushion ratios well north of 1, not at parity (1), which is cutting it pretty close. That said, we’ll have to see how Best Buy’s balance sheet ends up at the end of the fiscal year and if the company is able to generate material free cash flow well in excess of its cash dividend paid during the all-important holiday season to make up for the year-to-date shortfall–and then some. This will better inform our forecasts of future free cash flow.
Dividend Cushion Ratio Deconstruction (Image Source: Valuentum)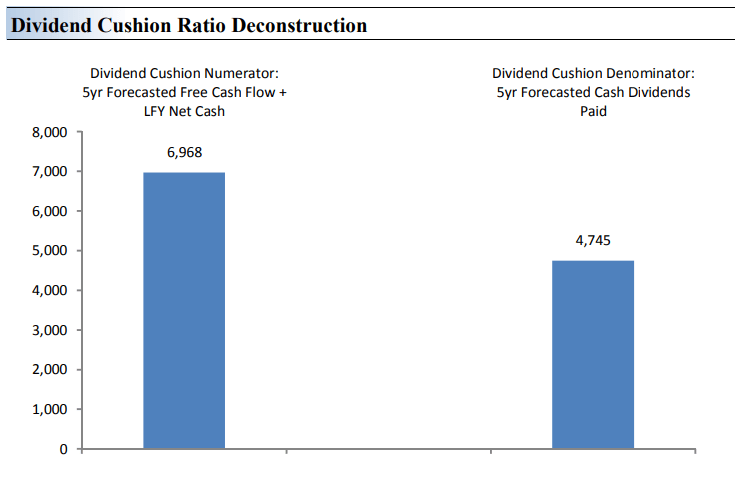
The Dividend Cushion Ratio Deconstruction, shown in the image above, reveals the numerator and denominator of the Dividend Cushion ratio — again this is the calculation at the end of Best Buy’s last fiscal year (and things have changed through the course of the year). At the core, the larger the numerator, or the healthier a company’s balance sheet and future free cash flow generation, relative to the denominator, or a company’s cash dividend obligations, the more durable the dividend. In the context of the Dividend Cushion ratio, Best Buy’s numerator is larger than its denominator suggesting that it can cover its payout (as it has done this year), but again, there are clouds on the horizon.
The Dividend Cushion Ratio Deconstruction image puts sources of free cash in the context of financial obligations next to expected cash dividend payments over the next 5 years on a side-by-side comparison. Because the Dividend Cushion ratio and many of its components are forward-looking, our dividend evaluation may change upon subsequent updates as future forecasts are altered to reflect new information. This is what we’re emphasizing in this note. Right now, Best Buy’s dividend looks okay, with a Dividend Cushion ratio of 1.5 (as derived in the images above), but we expect its Dividend Cushion ratio to fall closer to 1 upon its next fiscal year update (and maybe lower), and dividend investors should take note of the increased risks.
Best Buy’s Cash Flow Valuation Analysis
Image Source: Valuentum
We think Best Buy is worth $64 per share with a fair value range of $48-$80 (shares are trading at ~$68 at the moment). The margin of safety around our fair value estimate is driven by the firm’s MEDIUM ValueRisk rating, which is derived from an evaluation of the historical volatility of key valuation drivers and a future assessment of them.
Our near-term operating forecasts, including revenue and earnings, do not differ much from consensus estimates or management guidance. Our model reflects a compound annual revenue growth rate of -0.8% during the next five years, a pace that is lower than the firm’s 3- year historical compound annual growth rate of 6.5%.
Our valuation model reflects a 5-year projected average operating margin of 4.7%, which is below Best Buy’s trailing 3-year average. Beyond year 5, we assume free cash flow will grow at an annual rate of 8.6% for the next 15 years and 3% in perpetuity. For Best Buy, we use a 9.4% weighted average cost of capital to discount future free cash flows.
Best Buy’s Margin of Safety Analysis
Image Source: Valuentum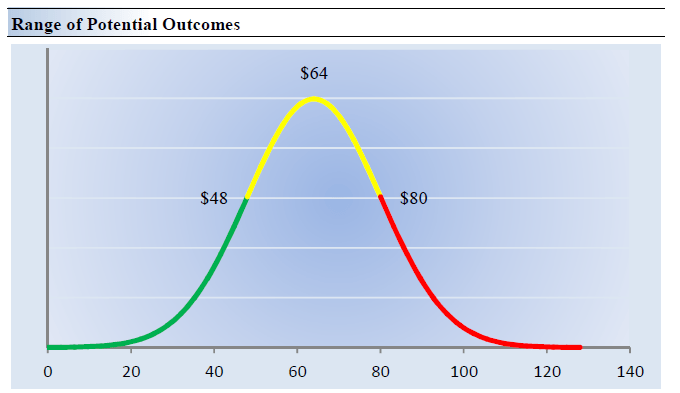
Our discounted cash flow process values each firm on the basis of the present value of all future free cash flows. Although we estimate Best Buy’s fair value at about $64 per share, every company has a range of probable fair values that’s created by the uncertainty of key valuation drivers (like future revenue or earnings, for example). After all, if the future were known with certainty, we wouldn’t see much volatility in the markets as stocks would trade precisely at their known fair values.
Our ValueRisk rating sets the margin of safety or the fair value range we assign to each stock. In the graph above, we show this probable range of fair values for Best Buy. We think the firm is attractive below $48 per share (the green line), but quite expensive above $80 per share (the red line). The prices that fall along the yellow line, which includes our fair value estimate, represent a reasonable valuation for the firm, in our opinion.
Concluding Thoughts
Shares of Best Buy are trading at ~$68 at the time of this writing, about in-line with our fair value estimate. The company’s yield stands at ~5.2%. The firm continues to battle competition, and while it is facing an uneven sales cycle with difficult year-over-year comparisons, strong performance in e-commerce has been a key driver, and we can never count Best Buy out.
The firm had a net cash position at the end of fiscal 2022, but this has changed through the course of its fiscal year. The company continues to generate free cash flow, however, and while we’ll have to see how things shake out during the all-important holiday selling season, through the first half of its fiscal year, free cash flow has come up short relative to cash dividends paid. Both of these are big changes relative to last fiscal year, and readers should expect a Dividend Cushion ratio much lower than that of last fiscal year’s, of which our systematic dividend methodology is based upon.
All told, it is difficult for us to get too excited about any big box retailer given the threats posed by the proliferation of e-commerce and rising competitive headwinds. We think Best Buy’s dividend is okay at the moment (based on last fiscal year’s Dividend Cushion ratio), but investors need to pay close attention to its industry backdrop and ever-increasing competition to consider it to be sustainable over the long run. We’re also noticing some important changes in its financials that are raising red flags, suggesting a much lower Dividend Cushion ratio next fiscal year and potential serious risks to the payout. Readers should take note.
Be the first to comment