


Deepak Sethi/E+ via Getty Images
Introduction
We review our investment case on Visa Inc. (NYSE:V), with share price back to where it was at our last update three months ago. We continue to believe Visa is one of the best “blue chip” stocks in today’s market.
Since we initiated our Buy rating on Visa in June 2019, shares have gained 32% (including dividends) in the roughly 3.5 years. Performance in 2022 has been more disappointing, with Visa shares having lost 2.4% year-to-date, roughly in line with both Buy-rated Mastercard (MA) (lost 3.4%) and Hold-rated American Express (AXP) (lost 4.3%):
|
Visa Share Price (Last 5 Years) 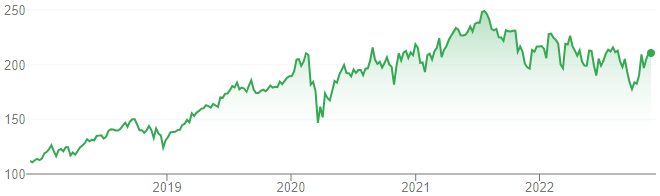 Source: Google Finance (22-Nov-22). |
Visa volumes and revenues have been growing consistently since the temporary disruption by COVID-19 in early 2020. In its most recent quarter, both revenues and Adjusted EPS grew by nearly 20% year-on-year, despite currency headwinds and the closure of Visa’s business in Russia. FY22 Adjusted EPS was 26.8% higher year-on-year and 37.7% higher than 3 years ago. FY23 guidance is for another year of double-digit growth in revenues and likely EPS in constant currency, though with earnings being H2-weighted and only growing at high-single-digits in U.S. dollars. Visa stock currently trades at 27.8x FY22 EPS and has a 0.9% Dividend Yield. Our updated forecasts indicate a total return of 108% (21.3% annualized) by September 2026. Buy.
Visa Buy Case Recap
We believe Visa’s low-teens EPS CAGR and premium valuation would continue, driven by:
- Electronic payment volumes are growing structurally from both GDP growth and the continuing shift away from cash and cheques; even in the U.S. and Europe, a significant amount of consumer spending remains in cash; the potential is even greater in newer geographies
- Visa and Mastercard are increasingly penetrating new payment verticals including Business-to-Business, Business-to-Consumer and Peer-to-Peer; they are also increasingly providing value-added services that utilise their platform status and wealth of data, adding further revenue growth
- Incumbent payment networks enjoy natural advantages in scale and network effects; regulations ensure a high barrier to entry
- Payment networks have natural operational leverage, being highly scalable and having largely fixed costs, so earnings grow faster than revenues
COVID-19 was a significant short-term negative for Visa, with travel restrictions disrupting high-margin cross-border volumes, but a long-term positive, accelerating the shift to electronic payments.
Visa’s volumes and revenues have been growing consistently since COVID’s temporary disruption in early 2020.
Visa’s Consistent Volume & Revenue Growth
Visa’s volumes and revenues fell in Q3 FY20 (April-June 2020), the first full quarter after COVID lockdowns in the U.S. and Europe, but have since been growing consistently. Interestingly, revenues even grew sequentially in the last two fiscal Q2s, unlike the typical post-holiday seasonal dip seen in pre-COVID years:
|
Visa Revenues vs. Volume (Since CY19) 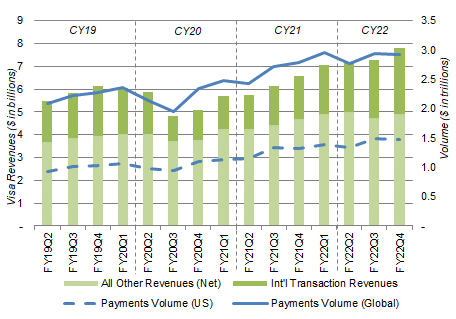 Source: Visa company filings. NB. FY ends Sep 30. |
By Q4 FY22, Visa’s revenues have grown 61% from the trough. Its structural growth has been so strong enough to be clearly visible in the USD reported figures, despite the impact of the strong U.S. dollar and Visa closing its business in Russia in 2022. (Russia was 4% of Visa’s FY21 revenues; Ukraine was another 1%.)
Visa’s Q4 FY22 Results
In Visa’s most recent quarter, Q4 FY22, both Net Revenues and Adjusted EPS growing by nearly 20% year-on-year in U.S. dollars; excluding currency, Net Revenues grew 22% and Adjusted EPS grew 24%:
|
Visa P&L (Non-GAAP) (Q4 FY22 vs. Prior Periods) 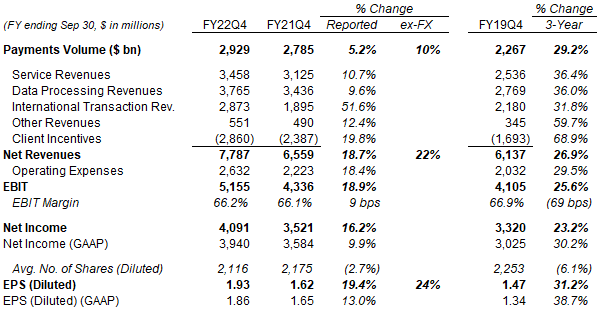 Source: Visa results releases. NB. Each quarter’s Service Revenues are based on volumes in the preceding quarter. |
While Visa’s P&L was helped by the post-COVID rebound in Travel, the benefit was mainly in International Transaction Revenues (up 51.6% year-on-year). All other revenue lines still grew at 10% or higher in U.S. dollars, showing the underlying strength of Visa’s growth. Management also stated that, at constant currency, revenues grew by 20% or more in each of Visa’s three “growth engines” – consumer payments, new flows, and value-added services.
The loss of all Russia-related revenues since Q3 FY22 was a significant headwind. Excluding Russia and currency, Data Processing revenues grew 15%, Net Revenues grew 27% and Adjusted EPS grew 30% year-on-year.
Visa’s most recent acquisitions, Currencycloud and Tink, were also headwinds to earnings, as they added 0.5 ppt to Net Revenues but 3 ppt to Operating Expenses.
Visa’s Payments Volume, if excluding both Russia and China as well as currency, grew 16% year-on-year. In fact, it grew at double-digits in every region, apart from CEMEA (Central Europe, Middle East & Africa):
|
Visa Payments Volume By Region (Q4 FY22) 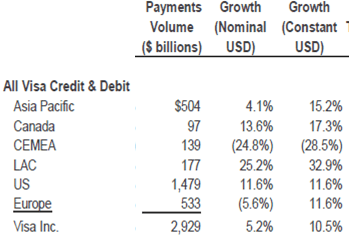 Source: Visa results supplement (Q4 FY22). |
The 32.9% growth in LAC (Latin America & Canada) is notable because it includes Brazil, where the new Pix payment platform (operational since November 2020) is seen by some investors as a potential threat to the Visa/ Mastercard ecosystem. Visa’s continuing strong growth in the region showed that this is not the case.
Alternative platforms like PIX help Visa indirectly, as CEO Alfred Kelly explained at an investor conference in May:
“We believe that both Pix and UPI (in India) are actually processing transactions that are generally not card transactions, they’re new transactions … The reality is that if these guys are helping to be catalysts for digitization, as long as the playing field is even, that’s a good thing for the ecosystem … We think Pix is attracting different types of transactions, and it gives us the ability, now that these people are getting into payments in a different way other than cash … to go cross-sell other products and bring them into our bank to do, or our fintech to do, other things with us”
Q4 FY22 provided a good snapshot of how Visa is one of the strongest businesses in our coverage.
Visa’s FY22 Results
With a strong Q4, full-year FY22 Adjusted EPS was 26.8% higher year-on-year and 37.7% higher than 3 years ago:
|
Visa P&L (Non-GAAP) (FY22 vs. Prior Years) 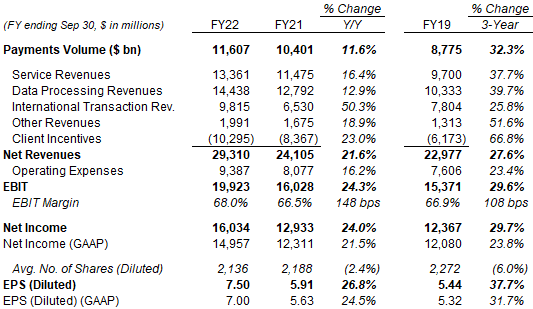 Source: Visa results releases. NB. Each quarter’s Service Revenues are based on volumes in the preceding quarter. |
Russia and currency were also significant headwinds for FY22 results, with the latter reducing Net Revenue growth and Adjusted EPS growth by approximately 2 ppt each.
FY22 also does not represent a full recovery in Travel. As we explained in our Raytheon Q3 results review, Global Revenue Passenger Miles (“RPM”) was still just 75% of 2019 levels in July-September (compared to 70% in April-June), while the number of U.S. travellers through TSA checkpoints were just 91% of 2019 levels in July-September.
Taking these factors into account, Visa’s FY19-22 growth rates are in line with our view of a long-term mid-teens Adjusted EPS growth.
Visa’s FY23 Outlook
Visa’s FY23 guidance implies double-digit growth in revenues and likely EPS in constant currency, including:
- Net Revenue growth to be in the mid-teens excluding currency and Russia, but high-single-digits in reported dollars
- Adjusted OpEx growth to be low-double-digits excluding currency, but high-single-digits in nominal dollars
Using our interpretations of what terms like “mid-teens” mean and adding other management comments, we believe Visa’s FY23 outlook implies an 8% growth in Adjusted EBIT and a 6.5% growth in Net Income:
|
Visa Non-GAAP P&L Outlook (FY23) (Our Estimates) 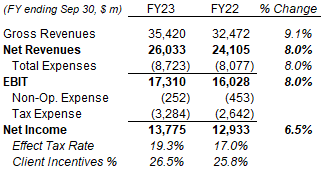 Source: Librarian Capital estimates. |
The gap between Adjusted EBIT growth and Net Income growth is due to a higher tax rate.
Earnings growth in FY23 will be H2-weighted, as H1 will still see a contribution from Russia in the prior-year comparable, while new costs from the acquired Tink and Currencycloud businesses will be included from the start.
Other Recent News
The U.S. Federal Reserve Board finalized the updates on its rule concerning debit card transactions in October and, as expected, imply little change from the status quo. As the Fed’s own press release stated, “the final rule is substantially similar to the proposal issued last year” and “does not modify requirements concerning interchange fees”. The requirement for each debit card issuer to enable two unaffiliated networks for card-not-present transactions is already met by “many, if not most” of Visa issuers, according to comments made by management.
PayPal (PYPL) has reached agreement with Apple (AAPL) to allow U.S. PayPal and Venmo credit/debit cards to be added to Apple Pay, and for PayPal merchants to accept contactless credit/debit cards on their iPhone PayPal and Venmo apps. PayPal has consequently signalled that its in-store strategy will now move away from QR codes to focus on credit/debit cards. This further strengthens the Mastercard/Visa ecosystem, and benefits Visa directly as the issuer of Venmo credit cards.
Visa announced on November 17 that CEO Alfred Kelly is stepping down in February 2023, to be replaced by longstanding Visa and current President Ryan McInerney. Kelly has held the CEO role since 2013 and will become executive chairman (he is already chairman). This appears a long-planned succession and likely implies continuity.
Valuation – Is Visa Overvalued?
At $210.33, relative to FY22 financials, Visa shares are trading at a 27.8x P/E and a 3.9% FCF Yield:
|
Visa Net Income, Cash Flows & Valuation (FY19-22) 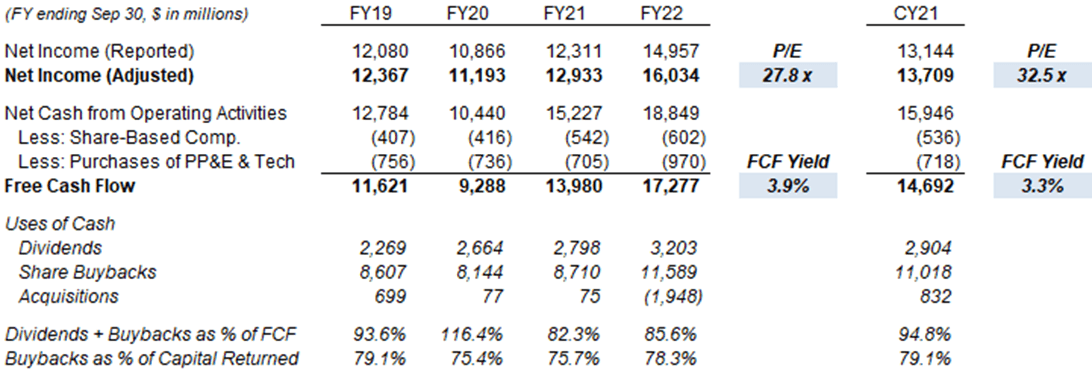 Source: Visa company filings. |
Relative to CY21 financials, Visa has a 32.5x P/E and a 3.3% FCF Yield.
Visa has a Dividend Yield of 0.9%, based on a quarterly dividend of $0.45 ($1.50 annualized), raised 20% in October.
Visa performed the equivalent of $12.5bn of share repurchases in FY22, equal to 2.8% of the current market capitalization, with $11.6bn of actual buybacks and another $850m added to the MDL litigation escrow account (which has the same effect as buybacks). $12bn was added to the buyback program in October, leaving a $17.1bn balance.
Visa Stock Forecasts
We reduced our FY23 forecast in line with the latest guidance, cut our exit multiple and extended our forecasts to FY26.
Our key assumptions now include:
- FY23 Net Income growth of 8% (was 12.5%)
- From FY24, Net Income to grow at 12.5% each year (unchanged)
- From FY23, share count to fall by 1.5% each year due to buybacks (unchanged)
- FY23 dividend of $1.80 (was $1.90)
- From FY24, dividends to be on a 22.5% Payout Ratio (unchanged)
- P/E of 35x at FY26 year-end (was 40x)
Our new FY25 EPS forecast is 2.4% lower than before ($11.00); our FY26 EPS forecast is $12.26:
|
Illustrative Visa Return Forecasts 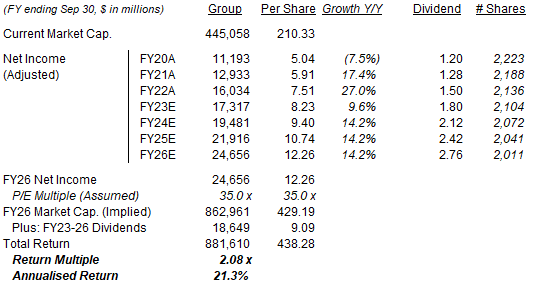 Source: Librarian Capital estimates. |
With shares at $210.33, our forecasts indicate a total return of 108% (21.3% annualized) by September 2026.
Is Visa Stock A Buy? Conclusion
We reiterate our Buy rating on Visa Inc. stock.
Be the first to comment