

nespix/iStock via Getty Images
Written by Nick Ackerman, co-produced by Stanford Chemist. This article was originally published to members of the CEF/ETF Income Laboratory on April 11th, 2022.
Virtus Total Return Fund (NYSE:ZTR) is a fund I like to revisit every so often. Unfortunately, it continues to remain at a stubborn premium. Otherwise, it would be a consideration for my portfolio. Until then, it remains on the watchlist but can be a solid “Hold” for other investors who might already have a position.
The fund has quietly been holding up relatively well this year. The main support for the fund seems to be from the utility exposure. Utilities are having a strong year as a safety play. This is a 60/40 fund, but the majority of the equity sleeve is allocated to utilities. The fixed-income sleeve is dominated by high yield and bank loans. However, high quality and some non-agency residential MBS also have some material exposure.
The Basics
- 1-Year Z-score: 0.70
- Premium: 4.88%
- Distribution Yield: 9.92%
- Expense Ratio: 1.34%
- Leverage: estimated 26.43%
- Managed Assets: $604.32 million
- Structure: Perpetual
ZTR’s investment objective is quite simple: “capital appreciation, with current income as a secondary objective.” As previously mentioned, they intend to do this via a 60/40 split. Though they will focus the equity portion on “owners/operators of infrastructure in the communications, utility, energy, and transportation industries.” The fixed-income sleeve is designed “to generate high current income and total return through the application of active sector rotation, extensive credit research, and disciplined risk management designed to capitalize on opportunities across undervalued areas of the fixed income markets.”
The fund is a fair size at around $604 million in total managed assets. They utilize leverage to juice up their returns potentially. Currently, leverage comes to 26.43%. Not the most overly leveraged fund, but regardless, leverage adds risks. The expense ratio of this fund comes to 1.34%. When including leverage expenses, this comes to 1.73%.
ZTR Expense Ratio (Virtus)
The borrowings for this fund are similar to other CEFs; they are based on LIBOR “plus an additional percentage rate on the amount borrowed.” That means that as interest rates head higher, the borrowing expenses for ZTR will also rise.
ZTR Performance – Utilities Saving The Day
Below is the YTD performance of ZTR. I have also included iShares iBoxx $ High Yield Corporate Bond ETF (HYG) to represent the high yield space. Additionally, I added the SPDR S&P 500 ETF (SPY) for some context of what the “market” has been doing so far this year.
Ycharts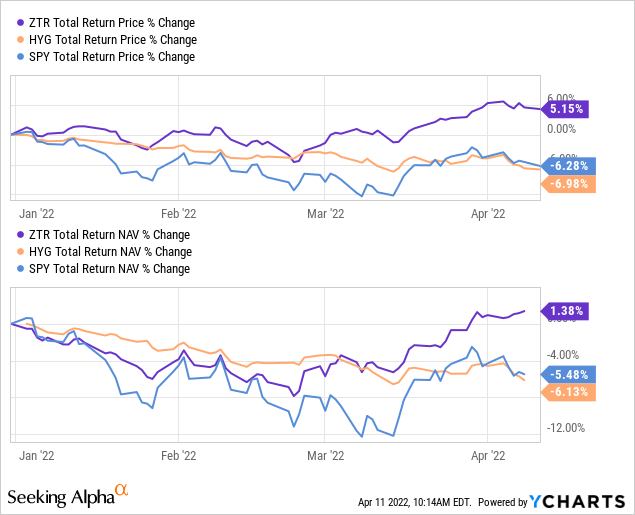
Here is a breakdown from Seeking Alpha on the “U.S. Equity Sectors” being represented by the appropriate SPDR ETF. The table is sorted by YTD performance, best to worst. As we can see, utilities are coming in second place at this time. This is only behind energy, where ZTR also has some exposure.
U.S. Equity Sectors (Seeking Alpha)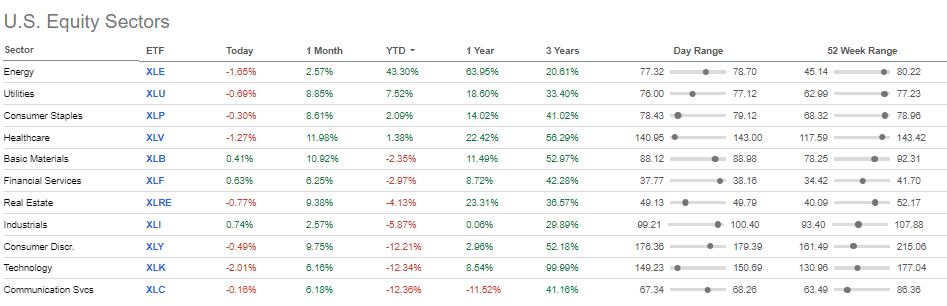
One fund that is similar to ZTR is Franklin Universal Trust (FT). This fund has a similar 60/40 weighting but in reverse. They overweight fixed-income rather than equities. 8 out of the top 10 positions in the fund are listed as utility names.
That being said, FT has been able to hold up just about as well as ZTR on a total NAV return basis. Except, the fund has been slipping on a total share price basis.
Ycharts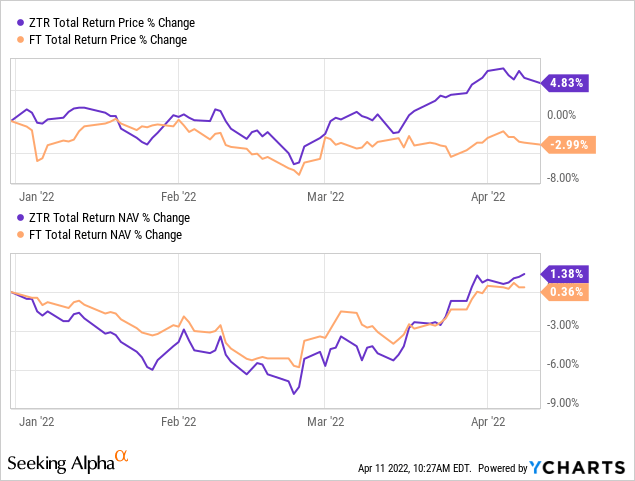
That could be creating a potential opportunity for investors to switch over from ZTR to FT for the more active traders out there. Over the long run, ZTR has edged out FT in terms of total returns. That isn’t too surprising given the larger weighting of equity positions.
Here is the performance of these two funds over the last ten years. The caveat here is that the performance of ZTR over longer periods is hard to track. I explained further in my previous article, but several reorganizations of funds have provided the ZTR we have today.
Ycharts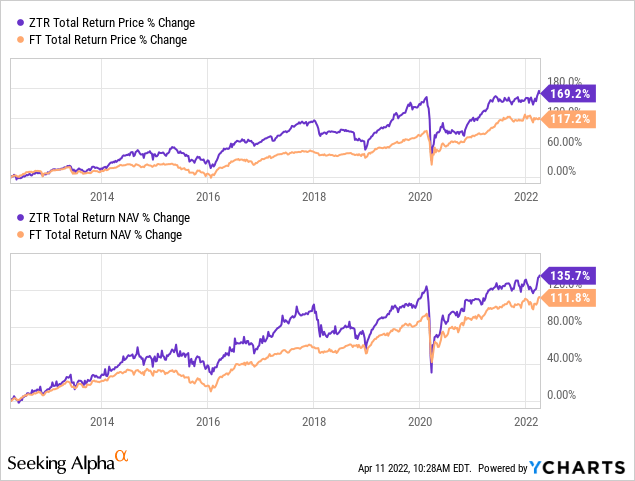
For the valuations, ZTR has historically traded at a more narrow discount. At the same time, both funds are above their ten-year averages. It is just that ZTR is more so.
Ycharts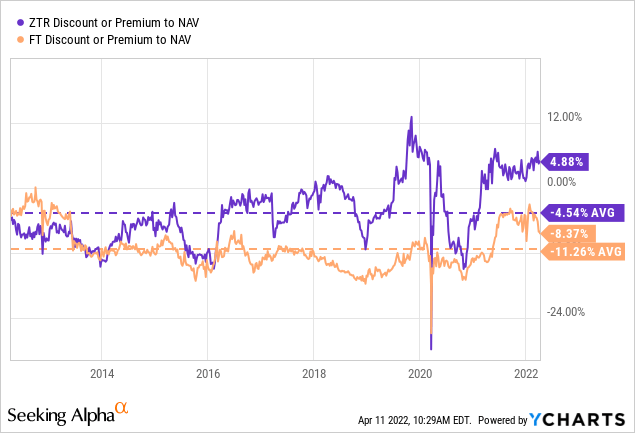
If we look at the 1-year z-score of each fund, ZTR comes in at 0.70 and FT at -0.65. So again, showing the relative discount to the average discount over the last year favors FT.
On the other hand, investors that are focused on income only won’t find this an appealing switch at all. ZTR’s distribution rate is coming in at a juicy 9.92%. FT is at just 6.30%. Of course, that means FT could have a better chance to grow its price and NAV per share going forward. Some investors would rather just take all that income and gain upfront; hence, an income investor.
Distribution – Attractive Near 10% Yield
Here’s where ZTR gets a bit more interesting for most investors: that 9.92% distribution yield. I worry because the NAV rate is coming in at 10.40%. That is a high bar to achieve to continue paying out the same distribution. Again here, the longer-term distribution history isn’t as relevant because of the reorganizations. However, they last cut their monthly distribution in 2020. That was shortly after the COVID-induced panic selling.
ZTR Distribution History (CEFConnect)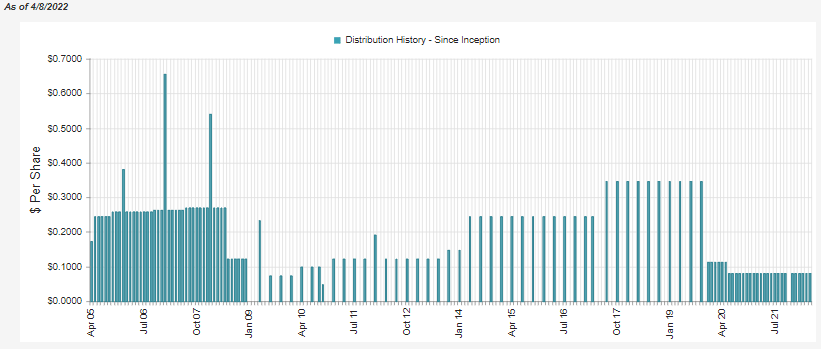
For the calendar year 2021, the fund’s NAV rose. It went from $9.37 on January 1st, 2021, to $9.43 on December 31st, 2021. That would indicate that it covered the distribution through that period. However, the fund did not cover its distribution for its fiscal year, which ends in November. We can see that from the net investment income and realized gains they reported. These figures combined fell short of the amount paid to shareholders.
ZTR Annual Report (Virtus)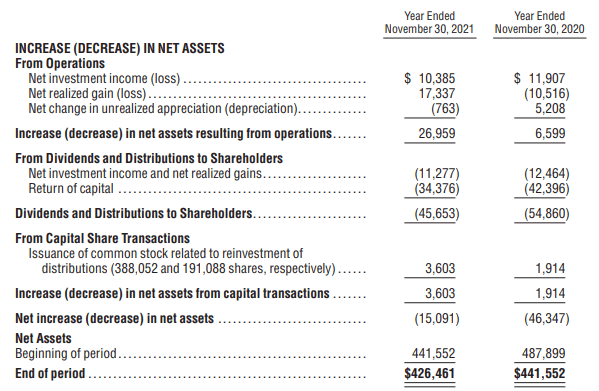
This is something to continue to monitor for ZTR. I continue to remain skeptical that they can keep supporting this elevated distribution. That being said, they can continue to pump out this same distribution for however long they want to essentially. At least until the NAV of the fund would go to $0.
For tax purposes, the fund reports a sizeable amount classified as return of capital. As we discussed the shortfall in coverage, at least some of this is destructive ROC during some periods.
ZTR Annual Report (Virtus)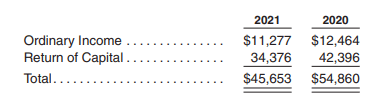
ZTR’s Portfolio
Taking a look at their bond sleeve first, as that has been the laggard, we see that the fund is fairly well split between investment grade and junk-rated debt. This is a fairly unique fund in that the fund is split 60/40; then, within their credit sleeve, they diversify further by splitting assets across the credit quality spectrum. Since our previous update, these weightings have not changed materially.
ZTR Credit Quality (Virtus)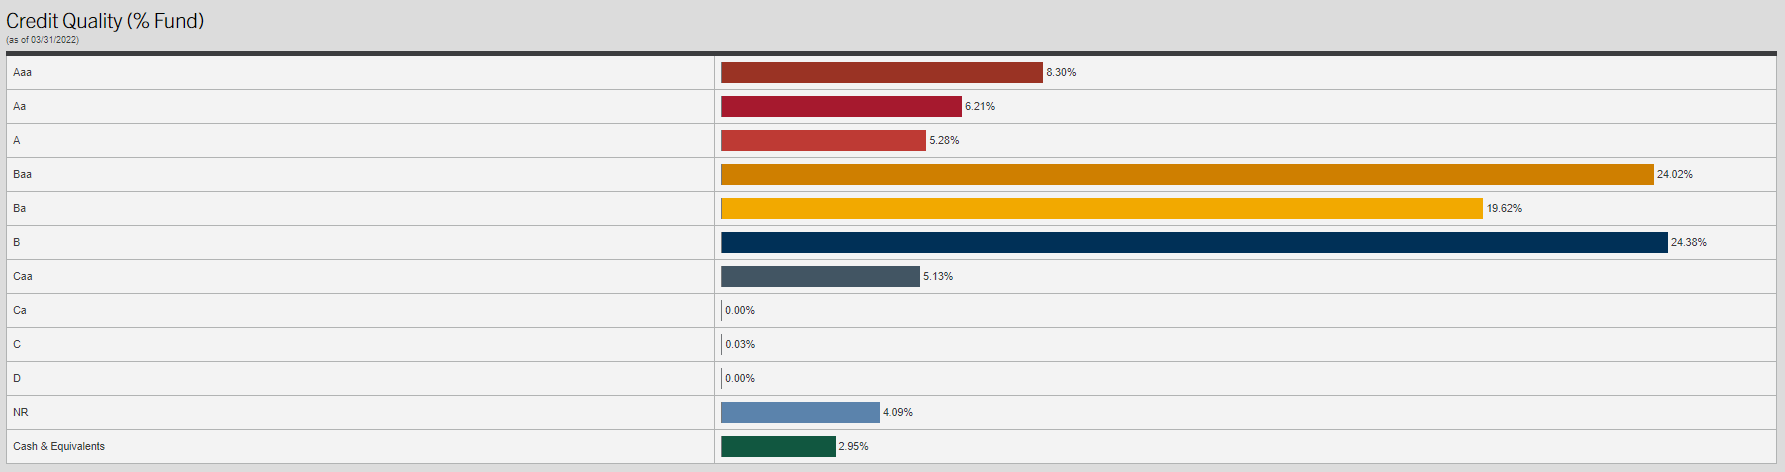
Unfortunately for that strategy, on a YTD basis, investment-grade bonds have been getting hit even harder. The reason for this is due to the rising interest rates. Investment-grade bonds are going to be more sensitive. Below we can see a YTD performance comparison between HYG and iShares iBoxx $ Investment Grade Corporate Bond ETF (LQD).
Ycharts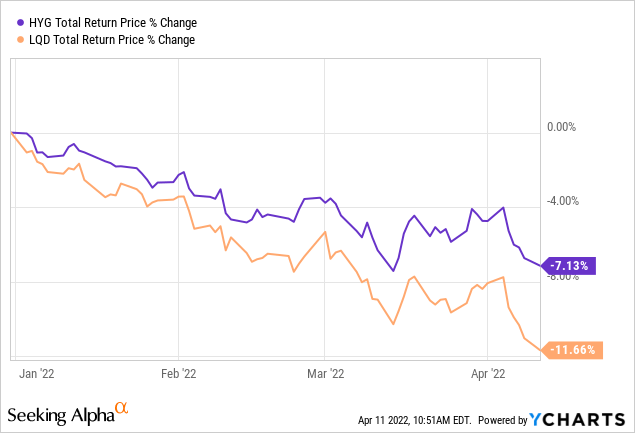
Over the long run, the weighting to investment grade should leave ZTR a bit safer due to the risk of default being diminished. At the end of Q4 2021, they listed an effective duration of 3.57 years. The average maturity came to 5.66 years.
What should be also helping to keep some of the fund’s sensitivity to interest rate increases lower is the fund’s allocation to bank loans. Bank loans are often floating rates. So as interest rates rise, after the floor is breached, the income from these loans can also increase. These are often issued by below-investment-grade companies as well. Similar to the credit quality ratings, the allocations here have not changed substantially since our previous coverage.
ZTR Fixed-Income Allocation (Virtus)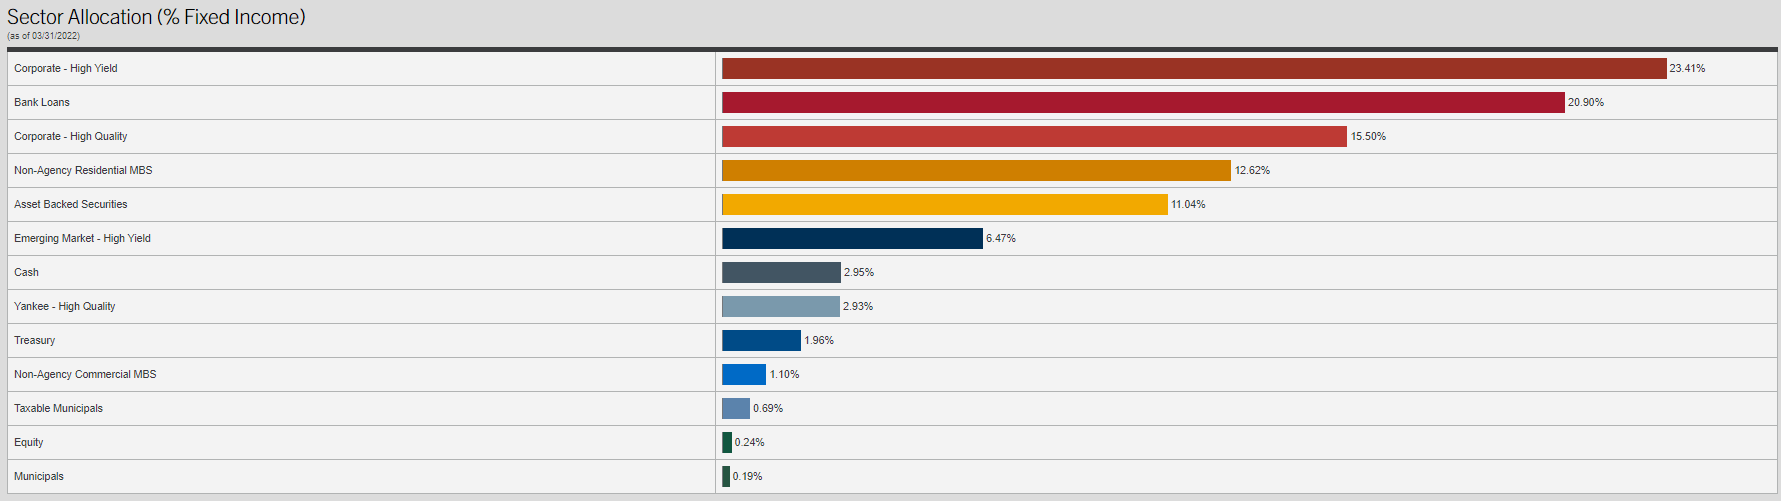
Taking a look at the equity sleeve of the portfolio, the more significant weighting overall, we have utilities coming in at a substantial weighting. This is followed by a material allocation to industrials and energy. Real estate and communication services make a small appearance but are unlikely to have a meaningful impact. These weightings are also similar to the previous allocations when we saw them on June 30th, 2021.
The sectors doing the heavy lifting to get ZTR out of negative performance for the year have been the utility and energy sectors.
ZTR Equity Allocation (Virtus)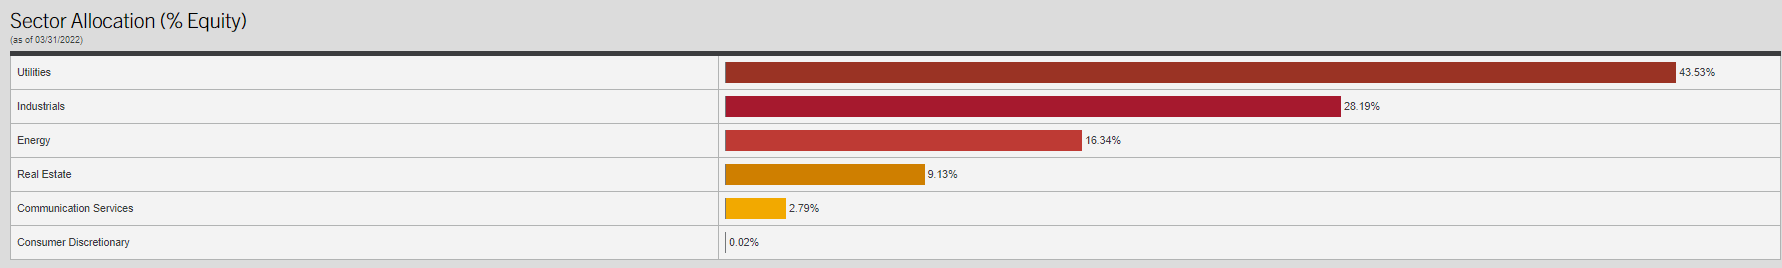
When we look at the top ten holdings, it also highlights that this fund isn’t just restricted to U.S.-based companies. They are holding some foreign positions as well. That can make it an even more diversified holding for investors.
ZTR Top Ten (Virtus)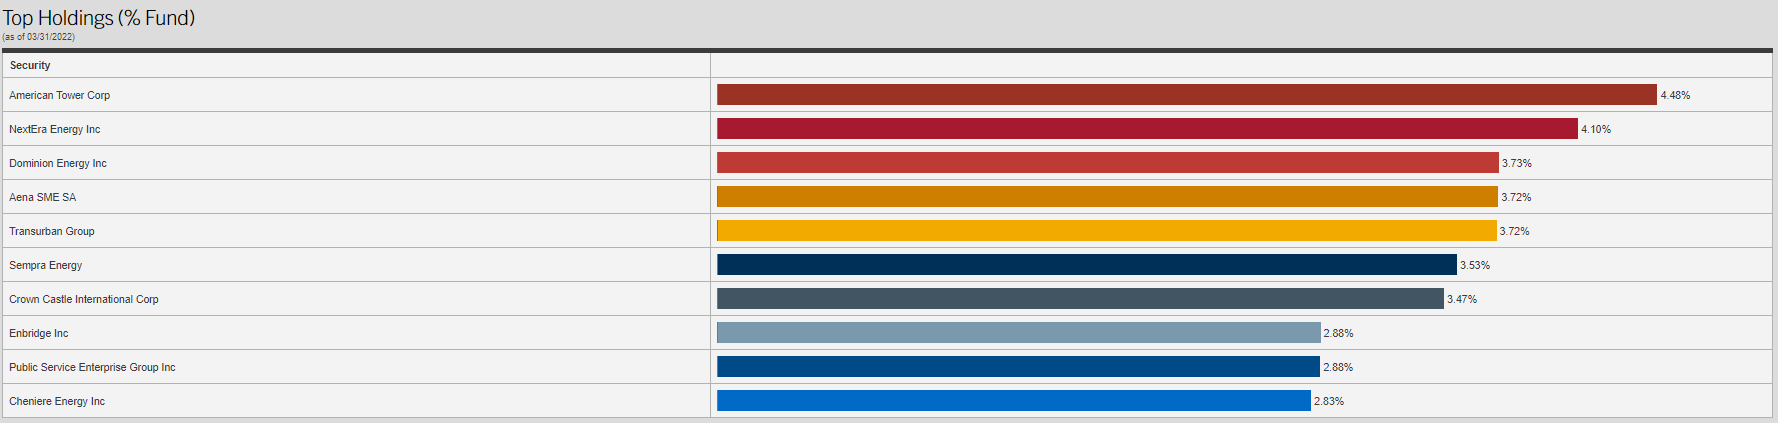
American Tower Corp. (AMT) comes in as the largest holding, topping the NextEra Energy (NEE) utility shares that was previously the largest holding. During the time frame we are looking at, NEE has outperformed AMT quite substantially too. This would indicate that the managers have increased their position in AMT to make it larger. Additionally, they could have reduced their position in NEE.
The total percentage weighting of both NEE and AMT has been reduced from our previous dive into the fund.
Ycharts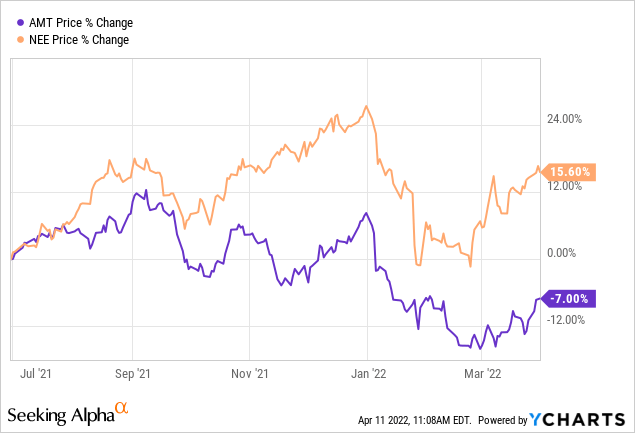
The top ten make up 35.34% of the assets in the fund as of March 31st, 2022. That was only an ever so slight reduction from the 35.74% it had previously.
There were several new additions to the top ten that we didn’t see previously. That included Dominion Energy (D), Transurban Group (OTCPK:TRAUF), Enbridge (ENB), Public Service Enterprise Group (PEG) and Cheniere Energy (LNG). TRAUF is traded on the pink sheets, which can add additional risks. It is a company with a headquarters in Australia. We also have ENB, a Canadian company, representing another holding headquartered outside the U.S.
Conclusion
ZTR is a unique fund with plenty of diversification. Unfortunately, it is trading a bit rich at this time. FT could potentially be a better value for investors at this time. On the other hand, the significantly lower distribution yield isn’t likely to impress income investors. However, I do suspect that FT’s distribution is a bit more sustainable and worry that ZTR could require further cuts in the future.
Be the first to comment