

We Are
The Vanguard U.S. Value Factor ETF (BATS:VFVA) is an actively-managed U.S. value ETF, focusing on mid-cap equities. VFVA’s comparatively cheap valuation and reasonably strong performance track-record make the fund a buy, and a slightly superior investment relative to most broad-based value index ETFs. On the other hand, the fund is significantly riskier than average, and so is only appropriate for more aggressive investors, in my opinion at least.
VFVA – Overview
VFVA is a U.S. value ETF. The fund uses a rules-based quantitative model to evaluate U.S. stocks, and invests in those with cheap prices and valuations. VFVA’s holdings sport an average PE ratio of 7.5x, and an average PB ratio of 1.2x. Both figures are low on an absolute basis, and lower than those of its peers, so the fund’s strategy seems to be reasonably effective and well-targeted.
Fund Filings – Chart by author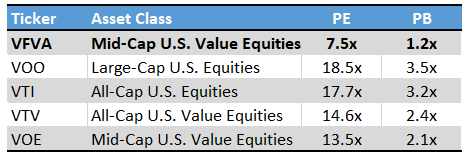
VFVA is technically actively-managed, but as it follows an explicit rules-based investment strategy it is, in practice, closer to a smart-beta or niche index fund. VFVA could plausibly moderately under or overperform relative to its index, depending on the effectiveness of its strategy, but significant differences in performance are unlikely, as the fund’s strategy is simply not that aggressive or discretionary. Although these issues are not negatives or positives per se, I do think they are important factors for investors to consider.
The fund invests in U.S. stocks of all sizes and market-capitalizations. Most of the fund’s holdings are small-cap stocks, with the fund sporting a median market-cap of just $8B. As a comparison, the S&P 500 has a median market-cap of $161B, while VOE, a mid-cap value ETF, has a $24B for the same metric. On the other hand, most of the fund’s top holdings are large-cap equities, such as AT&T (T) and CVS (CVS). In my opinion, VFVA is best characterized as a mid-cap focused fund, although the situation is murky, and others might see things differently.
VFVA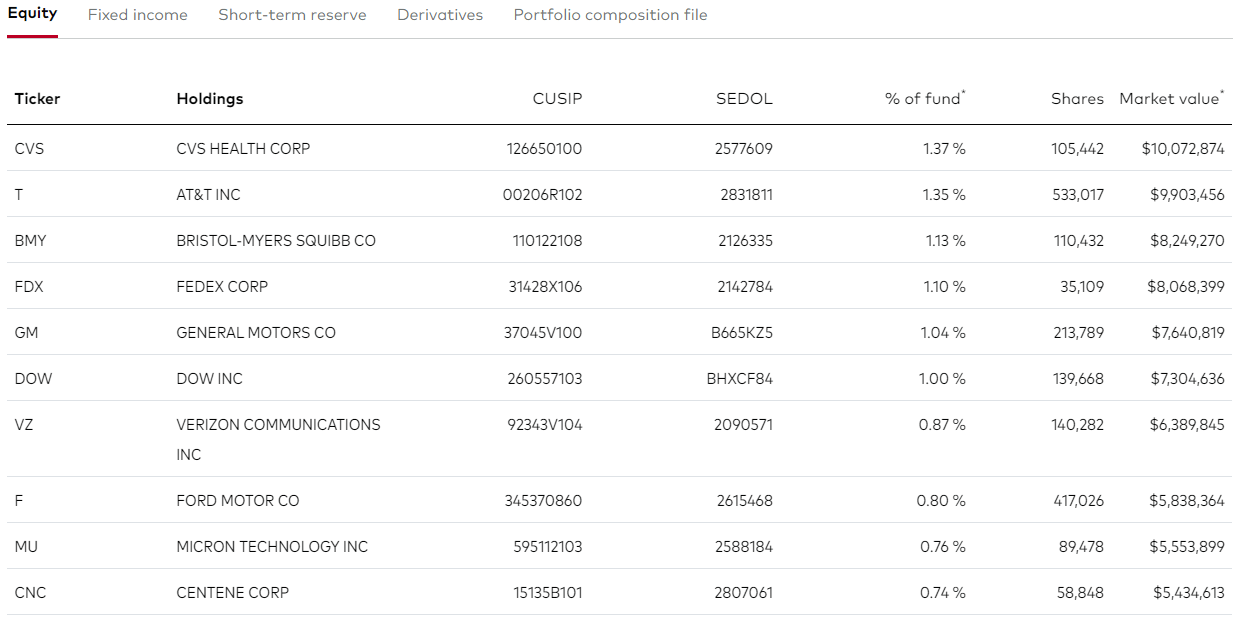
VFVA invests in stocks from all relevant industries, but is overweight cheaply valued old-economy industries, including energy, materials, and financials. On the flipside, the fund is underweight the high-growth, but expensive, tech industry. Allocations are consistent with current industry valuations and conditions. Industry allocations are as follows.
VFVA
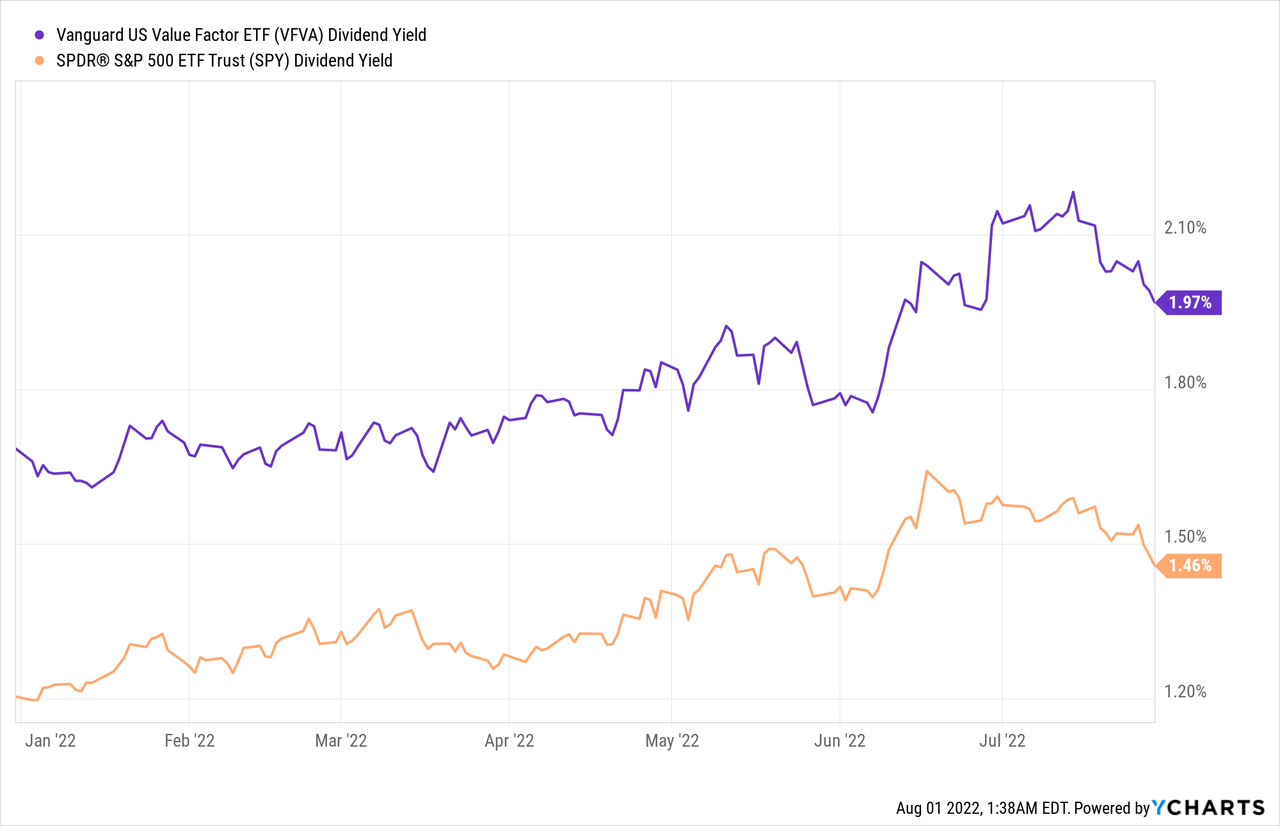
VFVA currently yields 2.0%, slightly higher than the equity average. The fund’s above-average yield is a small benefit for investors, but a benefit nonetheless.
Besides the above, nothing much else stands out about the fund, its strategy or holdings. It is a U.S. value fund, focusing on mid-cap equities, with the holdings and characteristics one would expect from such a fund.
VFVA versus Value Index ETFs
When analyzing actively-managed funds, I like to focus on the differences between said funds and their respective indexes. A strong actively-managed fund should differ from the index in positive ways, a weak one would compare unfavorably to the index. VFVA compares favorably to its peers in some key metrics, making the fund a reasonably strong investment opportunity.
VFVA invests in U.S. equities of all sizes and from all industries, making it as diversified as most broad-based U.S. value funds, including the Vanguard Value ETF (VTV). VFVA is somewhat more diversified than funds focusing on a specific slice of the market, including VOE, targeting the mid-cap sector, and the Vanguard Small-Cap Value ETF (VBR), targeting small-caps. Although VFVA is slightly more diversified than these funds, all lack exposure to several well-known mega-cap names, including Microsoft (MSFT) and Amazon (AMZN). These exclusions are incredibly important, and mean that the (lack of) diversification of these funds is quite similar.
VFVA’s holdings are most similar in size to those of VBR, meaning small-caps. On the other hand, VFVA’s largest holdings are most similar in size to those of VTV, meaning large-caps. I would split the difference and say that VFVA is therefore mostly similar to VOE, meaning mid-caps, although there is definitely some nuance / complications here. Median market caps for these funds are as follows, weighted average market-caps for VFVA would almost certainly be significantly higher.
Fund Filings – Chart by author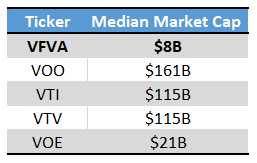
VFVA does sport a materially lower valuation than its peers, a significant benefit for the fund and its shareholders.
Fund Filings – Chart by author
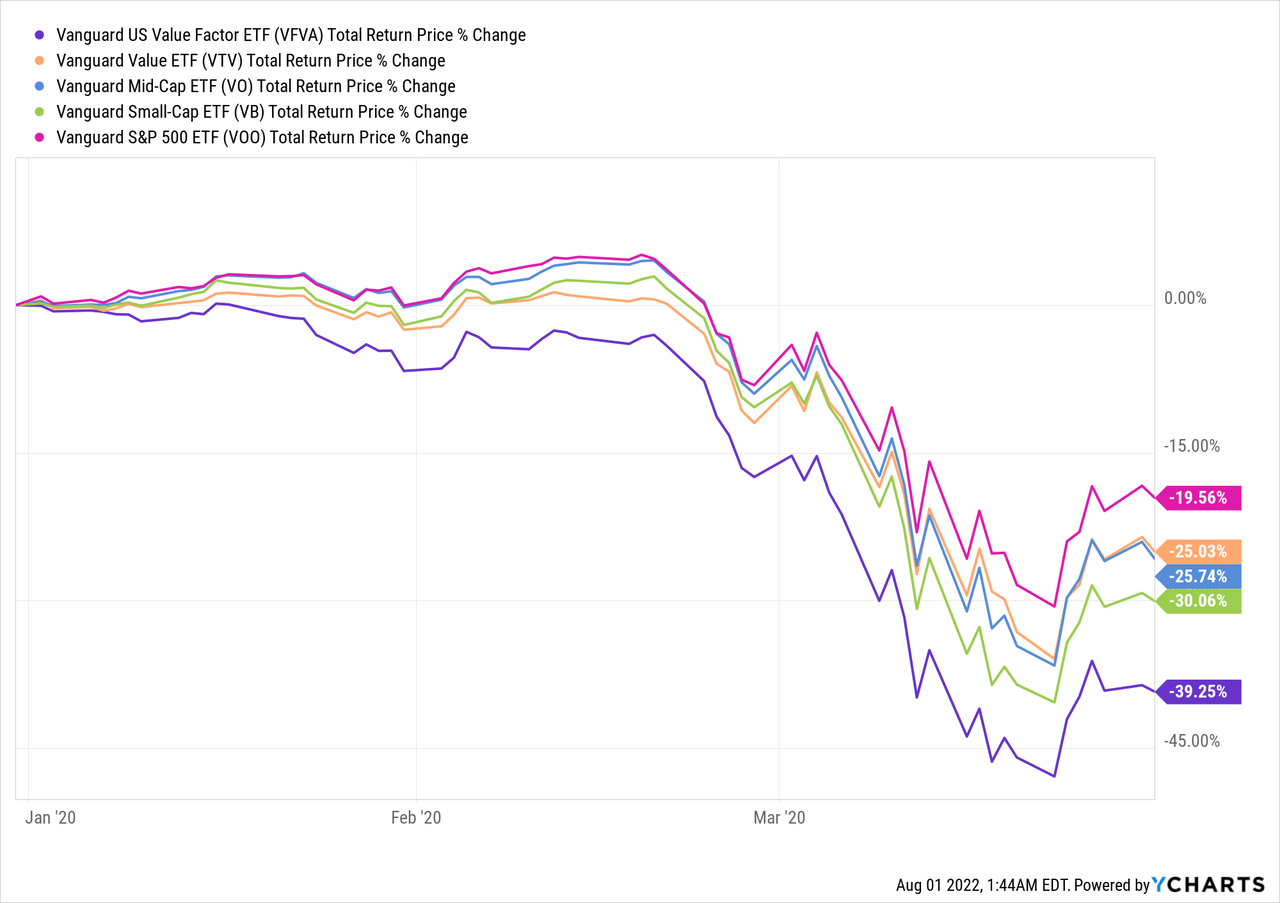
VFVA’s comparatively cheap valuation has two key implications for investors. In most cases, companies that trade with cheap valuations do so due to (perceived) risk and low growth prospects. These issues tend to be particularly salient during downturns and recessions, as investors tend to sell their risky investments during these, and these are very risky investments. Investors should expect VFVA to underperform relative to its peers during most downturns and recessions, as was the case during 1Q2020, the onset of the coronavirus pandemic. VFVA suffered losses of almost 40% during said time period, twice as large as those of the S&P 500, and moderately larger than those of its peers.
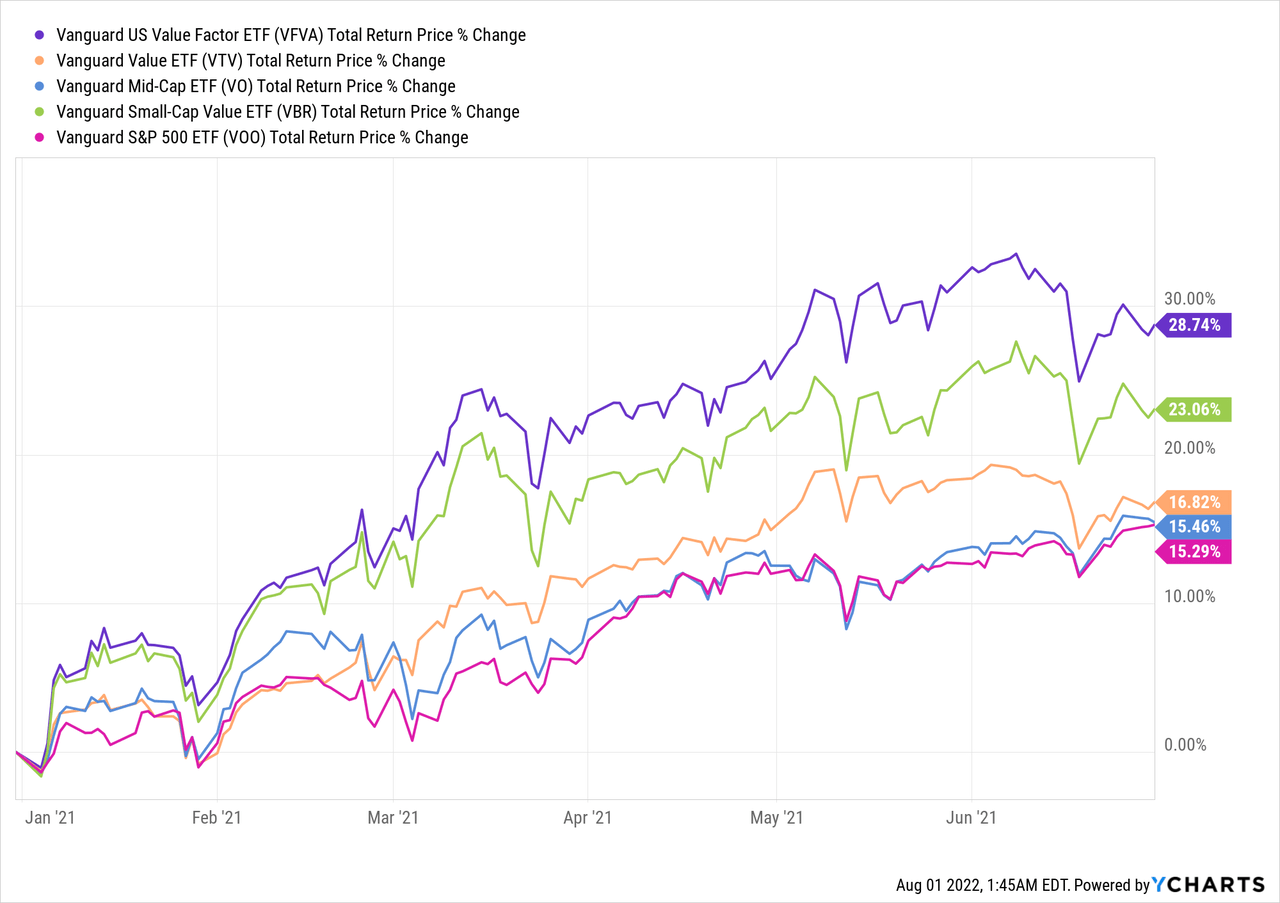
VFVA’s cheap valuation does have one significant benefit: potential capital gains are above-average, contingent on valuation gaps narrowing and investor sentiment improving. Valuations have being narrowing on and off for almost two years now, and VFVA does tend to outperform when this happens, as expected. Best example of this is 1H2021, during which valuation gaps narrowed as mass vaccination campaigns meant the pandemic was drawing to a close, meaning pandemic-hit industries and sectors would soon recover. Value stocks outperformed during said time period, and the cheaper the valuation the greater the outperformance. VFVA itself was the top performer in its peer group, as expected.
In my opinion, VFVA will outperform its peers once valuations (continue to) normalize. This is ultimately dependent on fickle market sentiment, so outperformance is far from guaranteed, but I do believe that it is likely. Economic conditions remain reasonably strong, as evidenced by a strong jobs report. Inflation expectations have been decreasing as well, and hopefully actual inflation goes down as well. Insofar as economic conditions continue to improve, investor sentiment should improve as well, leading to tighter valuation and value stock outperformance. That has mostly
As a final point, a quick table comparing VFRA’s performance with that of its peers. The fund’s performance track-record is reasonably good, with the fund outperforming its peers and the S&P 500 for the past three years or so. Performance is, from what I’ve seen, somewhat spotty, and dependent on starting conditions and time period selected.
Seeking Alpha – Chart by author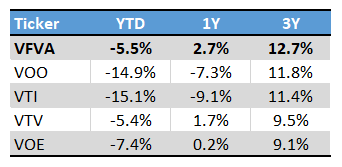
Conclusion – Buy
VFVA’s comparatively cheap valuation and reasonably strong performance track record make the fund a buy, and a slightly superior investment relative to most broad-based value index ETFs.
Be the first to comment