agrobacter
This ETF article series aims at evaluating products regarding the relative past performance of their strategies and quality metrics of their current portfolios. As holdings and weights change over time, updated reviews are posted when necessary.
VFVA strategy and portfolio
The Vanguard U.S. Value Factor ETF (BATS:VFVA) has 635 holdings, a distribution yield of 2.00% and a total expense ratio of 0.13%. Distributions are paid quarterly. It is actively managed and doesn’t track a specific index. As explained in the prospectus by Vanguard, a quantitative model is used to “generate higher returns relative to the broad U.S. equity market by investing in stocks with relatively lower share prices relative to fundamental values as determined by the advisor.” The turnover is high: 43% of average asset value in the last fiscal year.
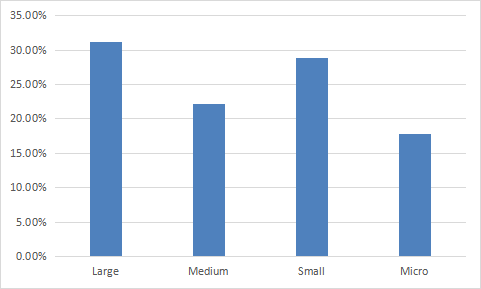
VFVA invests almost exclusively in U.S. companies (98.9% of asset value), in all size segments from large companies to micro-cap. The Russell 3000 (IWV) is used as a benchmark.
chart: author; data: Fidelity
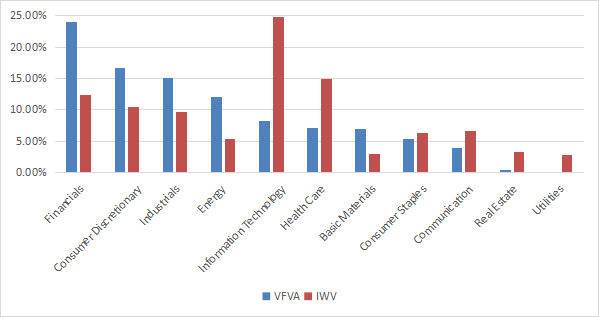
The top four sectors are financials (24%), consumer discretionary (16.6%), industrials (15.1%) and energy (12.1%). Other sectors are below 9%. Compared to the Russell 3000, the fund overweights these top 4 sectors, and also materials. It underweights technology, healthcare, communication and it almost ignores real estate and utilities.
VFVA sectors (chart: author; data: Vanguard)
As expected, VFVA is much cheaper than its benchmark the Russell 3000 index (IWV). The next table reports the usual valuation ratios.
|
VFVA |
IWV |
|
|
Price / Earnings TTM |
7.83 |
18.39 |
|
Price / Book |
1.34 |
3.33 |
|
Price / Sales |
0.7 |
2.1 |
|
Price / Cash Flow |
5.6 |
13.83 |
Source: Fidelity
VFVA currently holds 635 stocks. The top 10 holdings (listed below with valuation ratios) represent about 11% of the portfolio value, and the heaviest one weighs about 1.5%. As a consequence, risks related to individual companies are very low.
|
Ticker |
Name |
Weight (%) |
P/E TTM |
P/E fwd |
P/Sales TTM |
P/Book |
P/Net Free Cash Flow |
Yield% |
|
Comcast Corp. |
1.49% |
29.62 |
9.43 |
1.23 |
1.85 |
14.34 |
3.17 |
|
|
AT&T, Inc. |
1.46% |
7.06 |
7.34 |
1.05 |
1.19 |
24.71 |
5.83 |
|
|
Fidelity National Information Services, Inc. |
1.27% |
42.66 |
9.80 |
2.74 |
0.88 |
29.21 |
2.87 |
|
|
CVS Health Corp. |
1.19% |
41.38 |
11.34 |
0.41 |
1.81 |
7.70 |
2.26 |
|
|
Exxon Mobil Corp. |
1.18% |
9.28 |
8.29 |
1.22 |
2.56 |
10.68 |
3.19 |
|
|
Ford Motor Co. |
1.08% |
6.56 |
7.31 |
0.38 |
1.38 |
70.84 |
4.14 |
|
|
Marathon Petroleum Corp. |
0.97% |
5.32 |
4.73 |
0.35 |
2.28 |
4.91 |
2.47 |
|
|
General Motors Co. |
0.85% |
6.98 |
5.74 |
0.41 |
0.92 |
71.07 |
0.88 |
|
|
Toll Brothers, Inc. |
0.81% |
5.55 |
5.02 |
0.57 |
0.99 |
12.34 |
1.70 |
|
|
Altria Group, Inc. |
0.76% |
17.24 |
9.16 |
3.86 |
N/A |
52.56 |
8.47 |
Ratios: Portfolio123
Since inception (02/13/2018), VFVA has lagged its benchmark IWV by one percentage point in annualized return (see next table). It shows a much higher risk in drawdown and volatility (standard deviation of monthly returns). However, it has beaten both the Russell 1000 Value Index (IWD) and the Russell 2000 Value Index (IWN), which is a good point. Compared to other competitors, FVA beats some of them (VLUE, IVE), and is almost on par with other ones (VTV, FVAL). Risk adjusted performance (Sharpe ratio) is dragged down by high volatility.
|
Total Return |
Annual.Return |
Drawdown |
Sharpe ratio |
Volatility |
|
|
VFVA |
48.24% |
8.68% |
-47.97% |
0.37 |
26.30% |
|
IWV |
54.73% |
9.67% |
-33.46% |
0.48 |
18.76% |
|
IWD |
39.79% |
7.34% |
-36.21% |
0.36 |
18.47% |
|
IWN |
31.31% |
5.93% |
-45.99% |
0.29 |
25.14% |
|
VTV |
50.50% |
9.02% |
-34.61% |
0.46 |
17.67% |
|
VLUE |
29.57% |
5.63% |
-37.68% |
0.25 |
21.06% |
|
IVE |
45.23% |
8.21% |
-34.71% |
0.42 |
18.17% |
|
FVAL |
50.21% |
8.98% |
-36.13% |
0.43 |
19.73% |
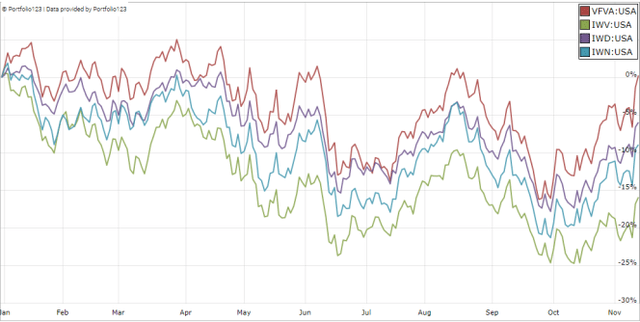
In 2022 to date, VFVA beats all of them. For readability, the next chart plots only IWV, IWD and IWN:
VFVA vs. benchmark and competitors in 2022 (Portfolio123)
The two weaknesses of most value ETFs
What does numbers say about VFVA strategy? The fund is actively managed and the quantitative model is not disclosed. However, the fact that VFVA has a return since 2018 and a sector composition similar to competitors suggests that it has the same shortcomings. The first one is to classify all stocks on the same criteria. It means the valuation ratios are considered comparable across sectors. Obviously they are not: you can read my monthly dashboard here for more details about this topic. A consequence is to privilege sectors where valuation ratios are naturally cheaper. It explains why financials has such a heavy weight in VFVA portfolio, and why technology is so underweight. Technology is a sector with large intangible assets (massive R&D, large user databases, etc…), which are not correctly reflected by valuation ratios.
The second shortcoming comes from the price/book ratio (P/B), which adds some risk in value strategies. Speaking probabilities, a large group of companies with low P/B contains a higher percentage of value traps than a same-size group with low price/earnings, price/sales or price/free cash flow. Statistically, such a group will also have a higher volatility and deeper drawdowns. The next table shows the return and risk metrics of the cheapest quarter of the S&P 500 (125 stocks) measured in price/book, price/earnings, price/sales and price/free cash flow. The sets are reconstituted annually between 1/1/1999 and 1/1/2022 with elements in equal weight.
|
Annual.Return |
Drawdown |
Sharpe ratio |
Volatility |
|
|
Cheapest quarter in P/B |
9.95% |
-72.36% |
0.48 |
21.05% |
|
Cheapest quarter in P/E |
11.25% |
-65.09% |
0.57 |
18.91% |
|
Cheapest quarter in P/S |
12.62% |
-65.66% |
0.6 |
20.46% |
|
Cheapest quarter in P/FCF |
12.23% |
-63.55% |
0.61 |
19.05% |
Data calculated with Portfolio123
This explains my choice of not using P/B in my Dashboard List model (more info at the end of this post).
Takeaway
VFVA is an actively managed value fund using a proprietary quantitative model. It has failed to outperform its benchmark since inception in 2018. Price history is too short to judge it relative to a broad index, but it is long enough to compare it to same-style ETFs. Doing so, the picture looks much better: VFVA total return is close to the best value funds since 2018, and it tops the list in 2022. However, there’s a caveat: VFVA risk metrics are significantly higher than for its competitors. Volatility points to two shortcomings. First, it probably ranks value stocks regardless of their sectors, hence a high exposure to financials. Second, price/book (or another book-based ratio) probably is a major factor of the model, increasing the risk of buying value traps, and therefore volatility and drawdowns. An efficient value model should compare stocks in comparable sets (sector, industry), like I do in the Dashboard List. This model uses three valuation metrics, excluding price/book. Moreover, a simple ROE rule helps filter out some value traps and normalize the number of components.


Be the first to comment