

FG Trade
By Jill Mislinski
Note: The charts below have been updated to include the latest report on U.S. Vehicle sales from the BEA.
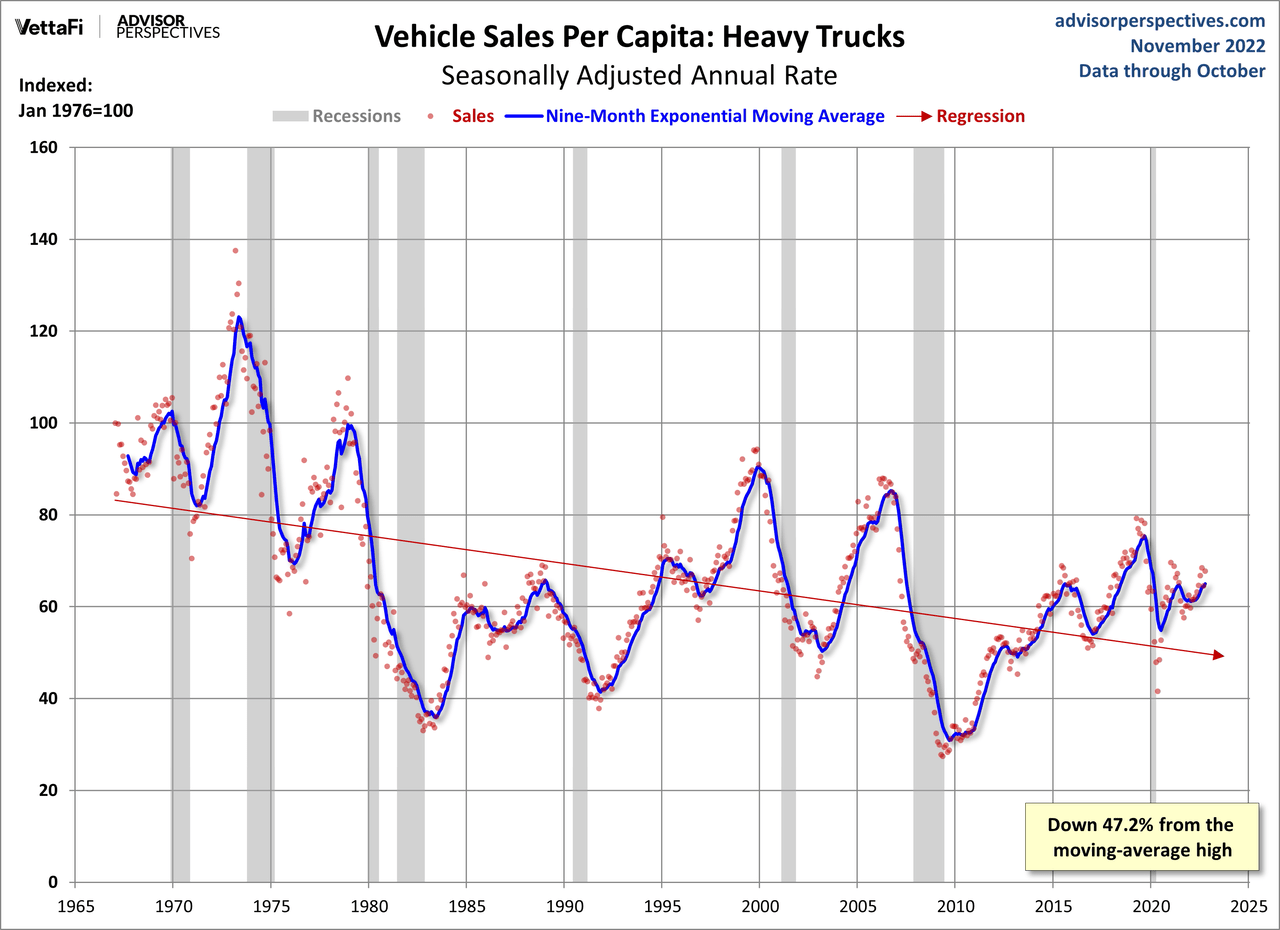
For the past few years, we’ve been following a couple of transportation metrics: Vehicle Miles Traveled and Gasoline Volume Sales. For both series, we focus on the population-adjusted data. Let’s now do something similar with the Vehicle Sales report from the Bureau of Economic Analysis. This data series stretches back to January 1976 and for heavy trucks, since 1967. Since that first data point, the Civilian Noninstitutional Population Age 16 and Over (i.e., driving age, not in the military, or an inmate) has risen about 59%.
Here is a chart, courtesy of the FRED repository, of the raw data for the seasonally adjusted annualized number of new vehicles sold domestically in the reported month. This is a quite noisy series – the absolute average month-over-month change is 4.4%.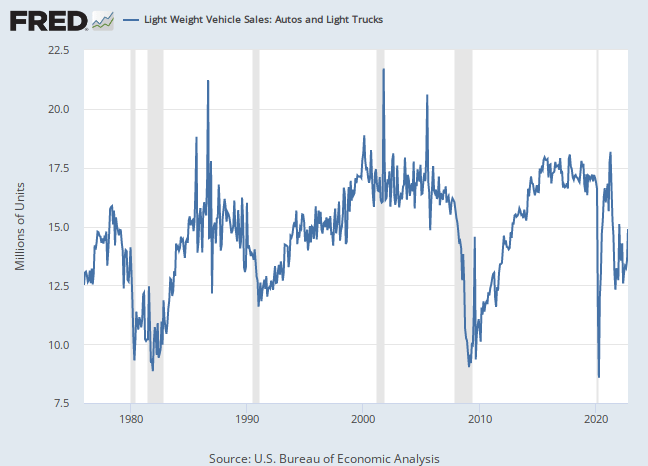
The latest data point is the October count published by the BEA in their monthly Auto and Truck Seasonal Adjustment report, which shows a seasonally adjusted annual rate of 14.9 million units, which is a 9.8% increase from the previous month’s figure from the BEA.
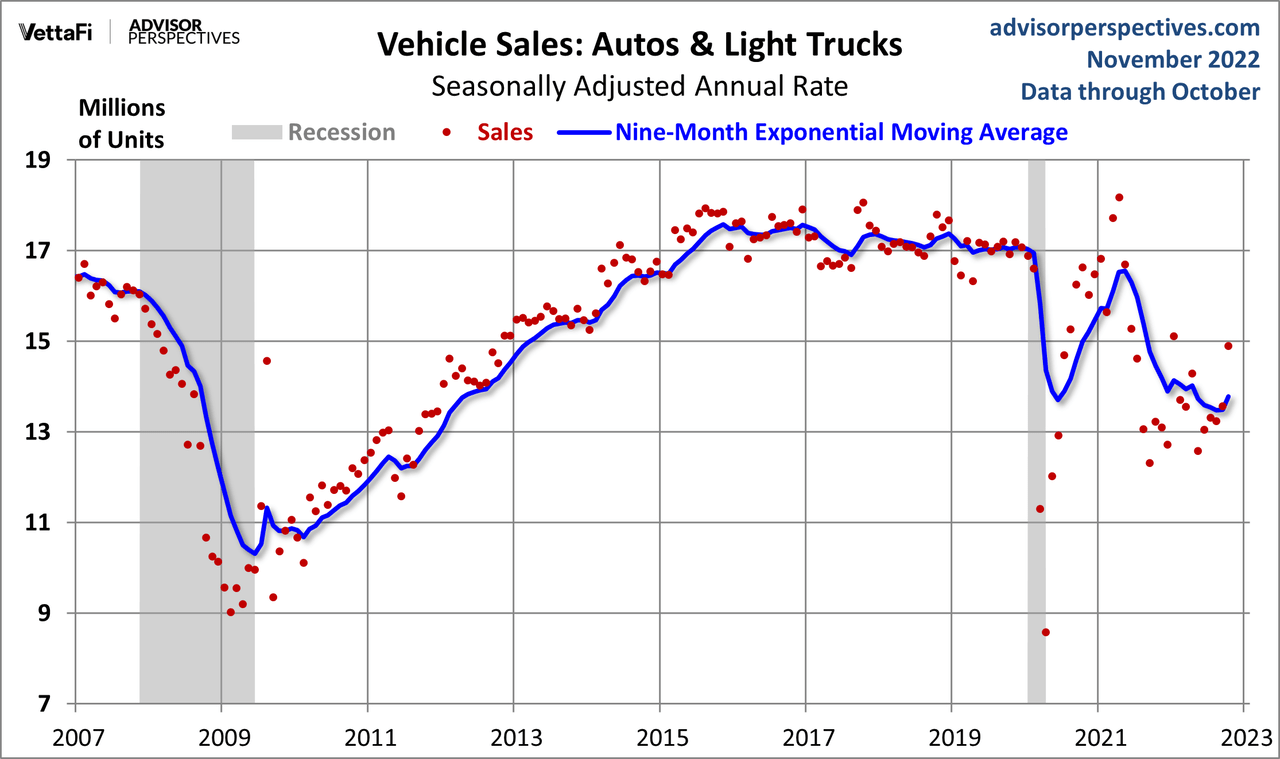
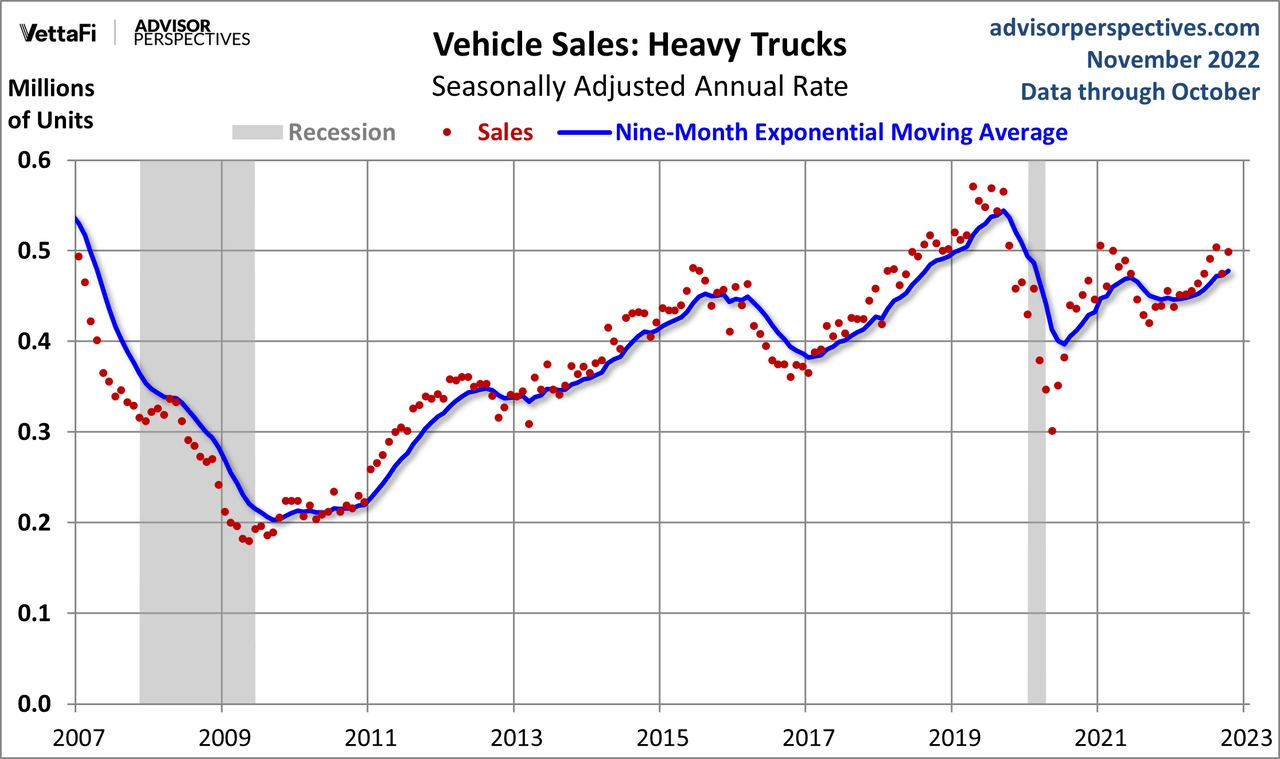
The first chart shows the series since 2007, which illustrates the dramatic impact of the Great Recession. The blue line smooths the volatility with a nine-month exponential moving average suggested by our friend Bob Bronson of Bronson Capital Markets Research. The moving average reduces the distortion of seasonal sales events (e.g., Memorial Day and Labor Day weekend) and thus helps us visualize the trend.
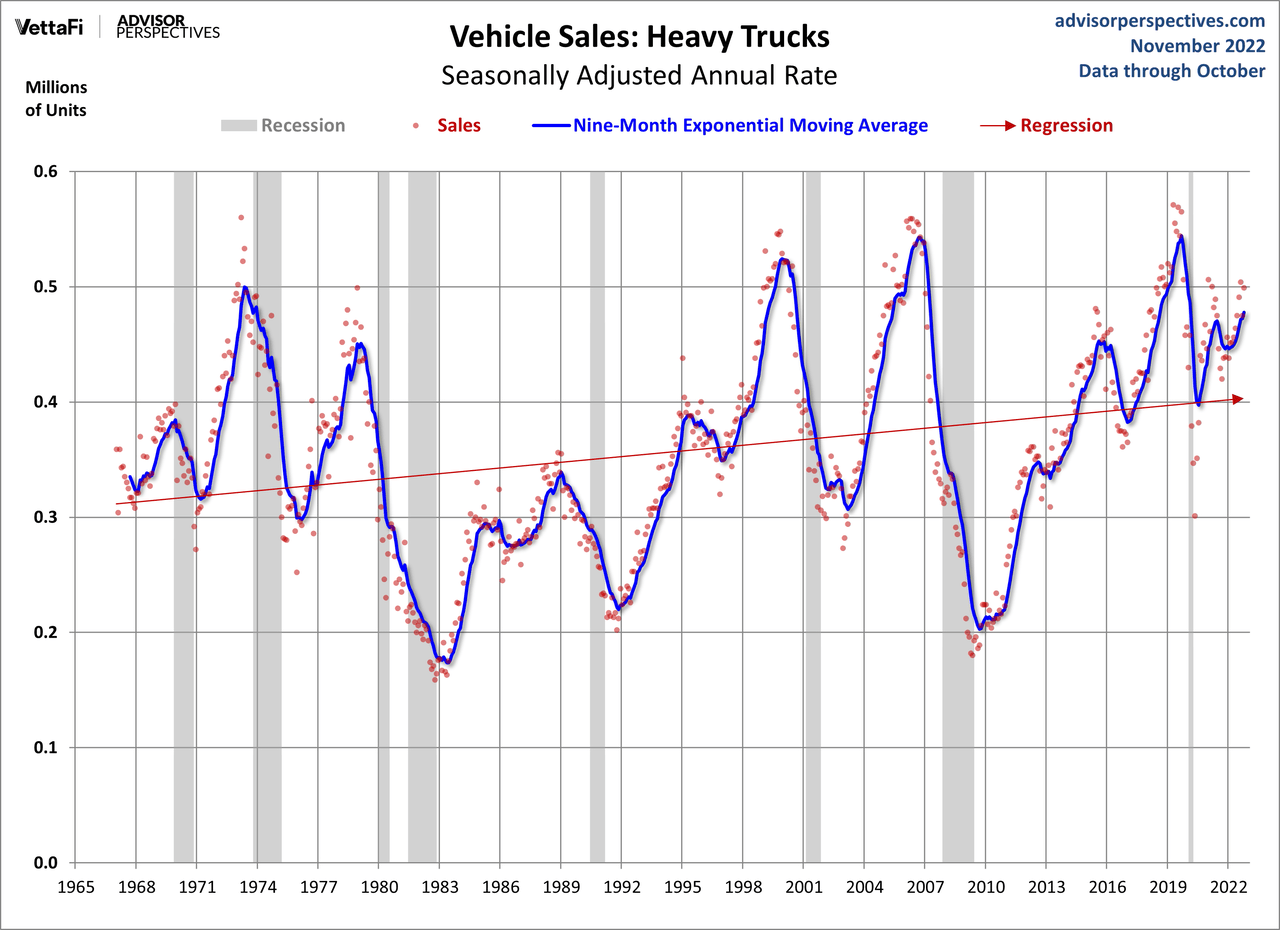
Here is the complete series of data from 1976. We’ve added a linear regression (the red line) to further illustrate the direction of the long-term trend.
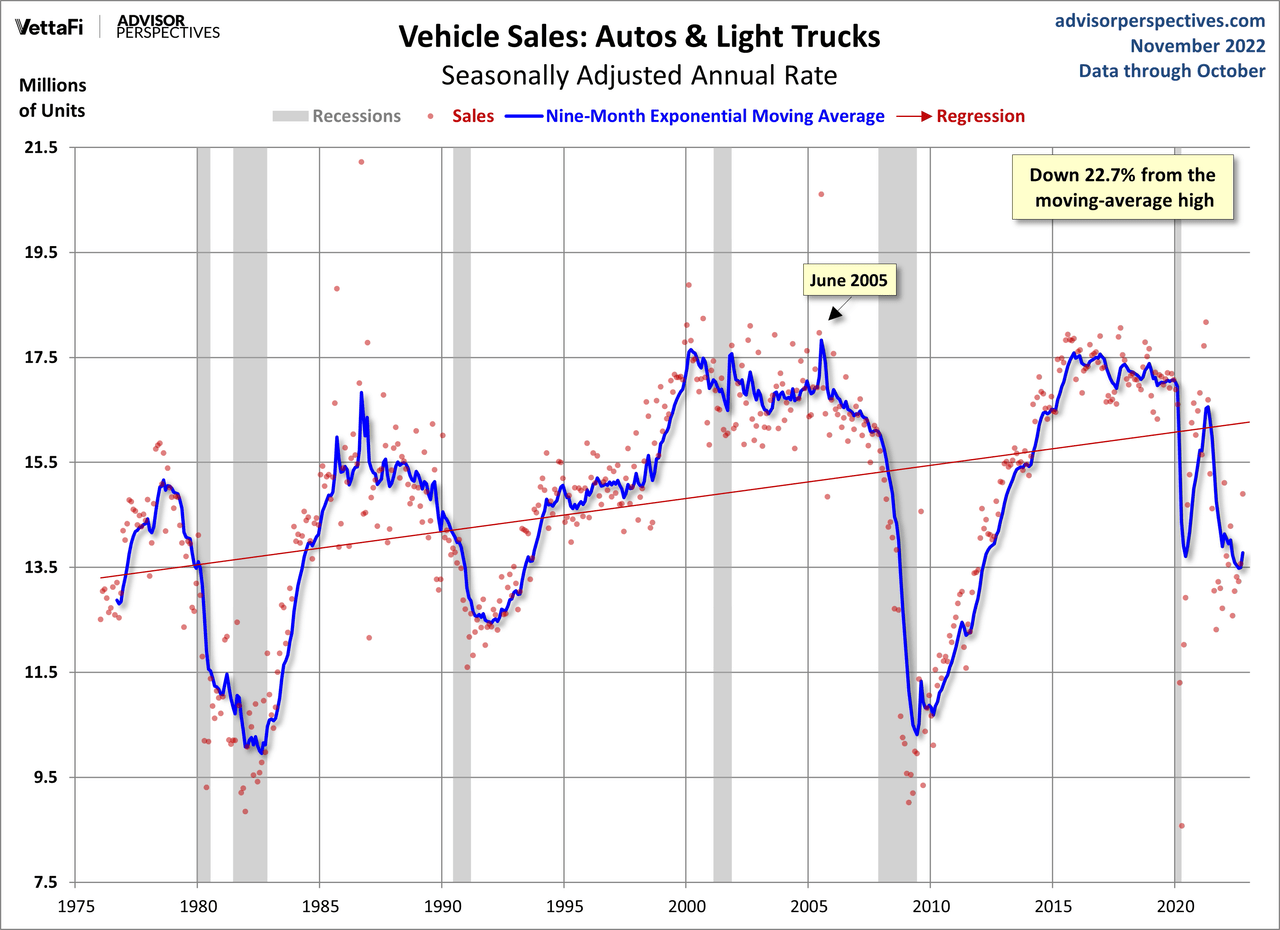
In the chart above, the latest moving average value is 22.7% below its record high in July 2005.
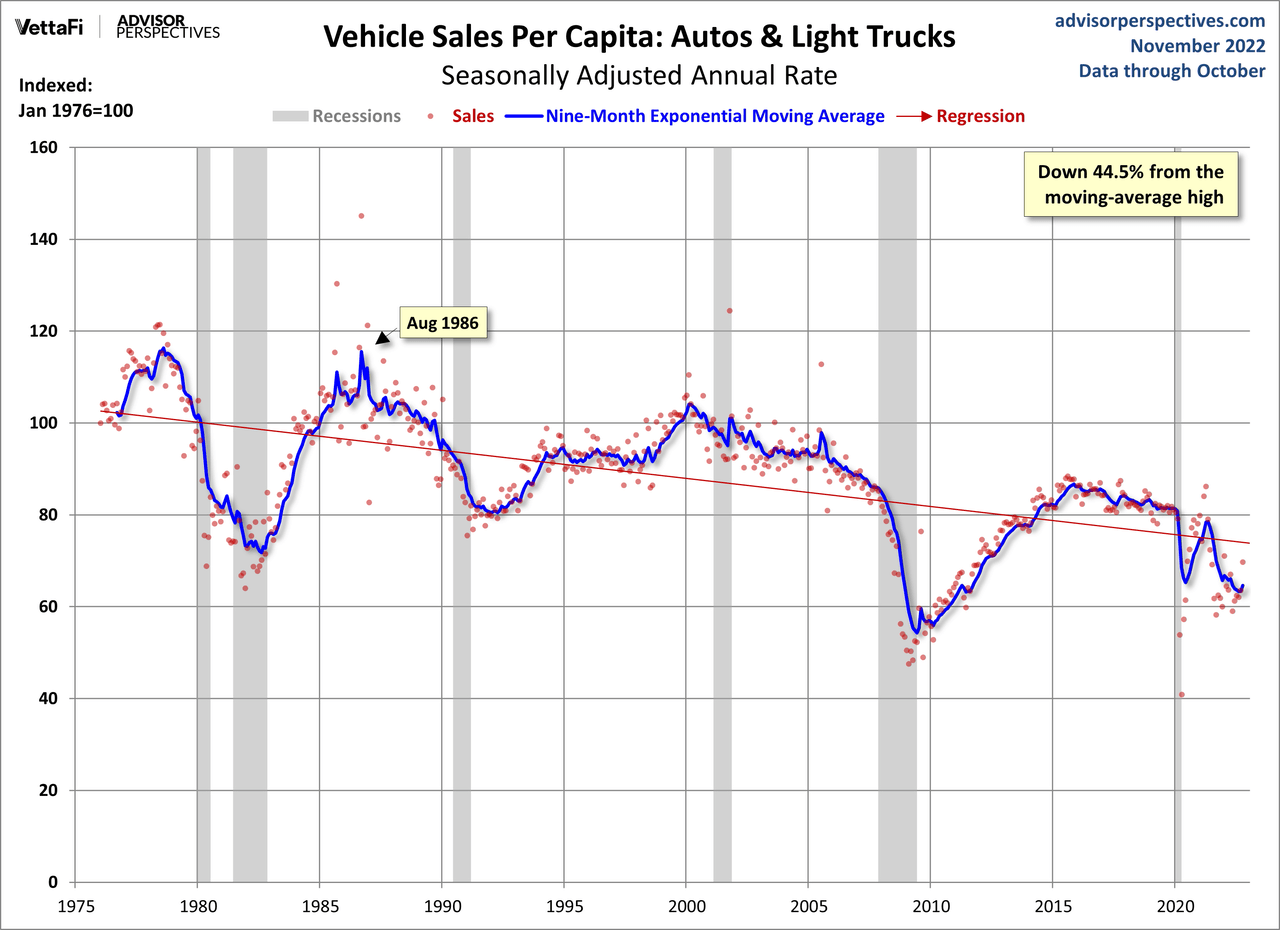
Here is the same chart with two key modifications:
- We’ve created a per-capita version using the FRED’s CNP16OV series for the adjustment.
- We’ve indexed the numbers so that the first data point, January 1976, equals 100.
 We’ve repeated these charts using heavy trucks for comparison:
Editor’s Note: The summary bullets for this article were chosen by Seeking Alpha editors.
Be the first to comment