

Sohel Parvez Haque/iStock via Getty Images
This ETF article series aims at evaluating products regarding the relative past performance of their strategies and quality metrics of their current portfolios. As holdings and weights change over time, updated reviews are posted when necessary.
SPHQ strategy and portfolio
The Invesco S&P 500 Quality ETF (NYSEARCA:SPHQ) has been tracking the S&P 500 Quality Index since 12/6/2005. It has a distribution yield of 1.89% and an expense ratio of 0.15%. The fund invests in the 100 S&P 500 companies with the highest quality score, based on return on equity, accruals ratio and financial leverage ratio. It is rebalanced and reconstituted semi-annually.
The heaviest sector is technology, with about one third of asset value (33.5%). It is followed by energy (14.5%), consumer staples (13.6%) and financials (13.2%). Other sectors weigh 25% in aggregate and less than 8% individually. Compared with the parent index S&P 500 (SPY), the fund overweights technology, energy, consumer staples, materials and to a lesser extent financials. It underweights all other sectors. It almost ignores real estate and utilities.
SPHQ sectors ( Chart: author with Invesco data)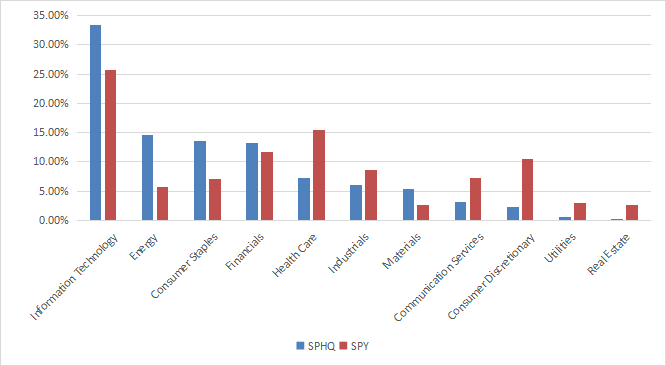
SPHQ is cheaper than SPY regarding the price/earnings and price/cash flow ratios (see next table). Price/book and price/sales are more expensive, but not much different.
|
SPHQ |
SPY |
|
|
P/E TTM |
16.46 |
19.48 |
|
Price/Book |
3.91 |
3.61 |
|
Price/Sales |
2.48 |
2.31 |
|
Price/Cash Flow |
12.6 |
14.31 |
Data: Fidelity
The top 10 holdings, listed below, weigh 41.1% of asset value. The heaviest one weighs about 6%, so risks related to individual companies is moderate.
| Ticker | Name | Weight% | EPS growth %TTM | P/E TTM | P/E fwd | Yield% |
| XOM | Exxon Mobil Corp. | 5.78 | 987.11 | 9.29 | 8.36 | 3.19 |
| AAPL | Apple, Inc. | 5 | 8.83 | 22.86 | 22.38 | 0.66 |
| V | Visa, Inc. | 4.87 | 25.45 | 29.3 | 24.29 | 0.89 |
| CVX | Chevron Corp. | 4.51 | 240.94 | 10.54 | 9.84 | 3.06 |
| MSFT | Microsoft Corp. | 4.49 | 3.73 | 24.66 | 24.05 | 1.19 |
| PG | Procter & Gamble Co. | 4.18 | 5.42 | 23.72 | 23.56 | 2.67 |
| MA | Mastercard, Inc. | 3.5 | 23.12 | 32.54 | 30.89 | 0.6 |
| PEP | PepsiCo, Inc. | 3.15 | 19.2 | 25.85 | 26.67 | 2.55 |
| KO | The Coca-Cola Co. | 2.89 | 12.24 | 26.13 | 24.01 | 2.95 |
| COST | Costco Wholesale Corp. | 2.78 | 16.61 | 37.5 | 33.83 | 0.73 |
Performance
Since inception in December 2005, SPHQ has lagged SPY by about 1.23 percentage point in annualized return, with a slightly higher risk measured in drawdown and volatility (standard deviation of monthly returns).
|
Total Return |
Annual.Return |
Drawdown |
Sharpe ratio |
Volatility |
|
|
SPHQ |
247.67% |
7.65% |
-57.82% |
0.48 |
16.16% |
|
SPY |
321.14% |
8.88% |
-55.42% |
0.56 |
15.65% |
Year-to-date, SPHQ is slightly ahead of SPY. Compared to 2 other quality factor ETFs in 2022, it beats the iShares MSCI USA Quality Factor ETF (QUAL), but lags the American Century STOXX U.S. Quality Value ETF (VALQ).
SPHQ vs. 2 competitors and SPY in 2022 (Portfolio123)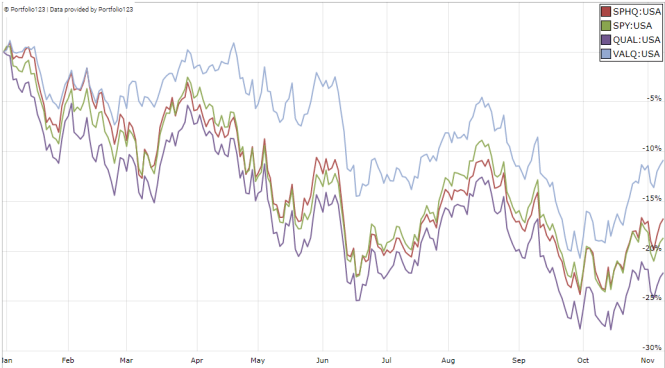
Comparing SPHQ with my quality model
In previous articles, I have shown how three factors may help cut the risk in a dividend portfolio: Return on Assets, Piotroski F-score, and Altman Z-score.
The next table compares SPHQ since inception with a subset of the S&P 500: stocks with a dividend yield above the average of their respective indexes, an above-average ROA, a good Altman Z-score and a good Piotroski F-score. It is rebalanced annually to make it comparable with a passive index.
|
Total Return |
Annual.Return |
Drawdown |
Sharpe ratio |
Volatility |
|
|
SPHQ |
247.67% |
7.65% |
-57.82% |
0.48 |
16.16% |
|
Large cap quality subset |
674.57% |
12.87% |
-40.18% |
0.81 |
15.04% |
Past performance is not a guarantee of future returns. Data Source: Portfolio123
SPHQ lags my S&P 500 quality subset by 5.2 percentage points in annualized return. However, SPHQ performance is real, whereas the subset is simulated. My core portfolio holds 14 stocks selected in this subset (more info at the end of this post).
Scanning SPHQ with quality metrics
SPHQ currently holds 99 stocks, of which 6 are risky regarding my metrics. In my ETF reviews, risky stocks are companies with at least 2 red flags among: bad Piotroski score, negative ROA, unsustainable payout ratio, bad or dubious Altman Z-score, excluding financials and real estate where these metrics are less reliable. Here, risky stocks weight only 2.1% asset value, which is a good point.
According to my calculation of quality metrics (reported in the next table), SPHQ quality is significantly superior to the benchmark. In particular, the aggregate return on assets is very strong.
|
Altman Z-score |
Piotroski F-score |
ROA% TTM |
|
|
SPY |
3.44 |
5.78 |
7.58 |
|
SPHQ |
4.99 |
6.44 |
13.77 |
Takeaway
SPHQ invests in the 100 best-ranked S&P 500 stocks using a quality score based on ROE, accruals and financial leverage. It is overweight in technology, with about one third of asset value in this sector. As expected, my own quality metrics confirm the high quality of SPHQ portfolio. Moreover, its exposure to risky stocks regarding my criteria is only 2%. Surprisingly, it is also a bit cheaper than its parent index S&P 500 in valuation. However, historical performance is underwhelming: it has lagged SPY since inception, and its recent performance is average compared with other quality ETFs. For transparency, I have a passive allocation in quality-oriented ETFs (SPHQ is not part of it) and a dividend quality active portfolio of 14 stocks (“Stability” model).
Be the first to comment