

marchmeena29/iStock via Getty Images
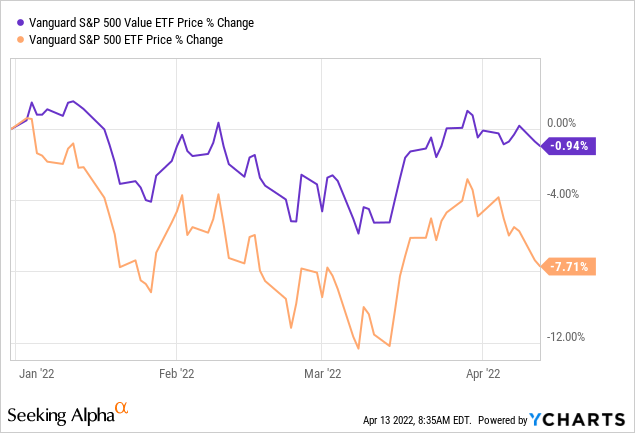
As you know, the macro-environment currently facing investors is filled with uncertainty: high inflation, expectations for rising interest rates, increased market volatility, and massive geopolitical risks as a result of Putin’s invasion of Ukraine and the resulting economic sanctions placed on Russia by the United States, and its Democratic and NATO allies. One strategy to help a well-diversified portfolio weather the storm would be to allocate some capital to the “value” sector that has been out-of-favor for most of the biggest bull-market of our lives but which currently looks quite attractive. YTD, that has been a good move: the Vanguard S&P500 Value ETF (NYSEARCA:VOOV) has outperformed the S&P500 by 6%+. The fund will likely be a safe-haven and a good place to park some capital as the market faces the above mentioned headwinds – which could easily last for the duration of 2022 and into 2023. Perhaps even longer.
Investment Thesis
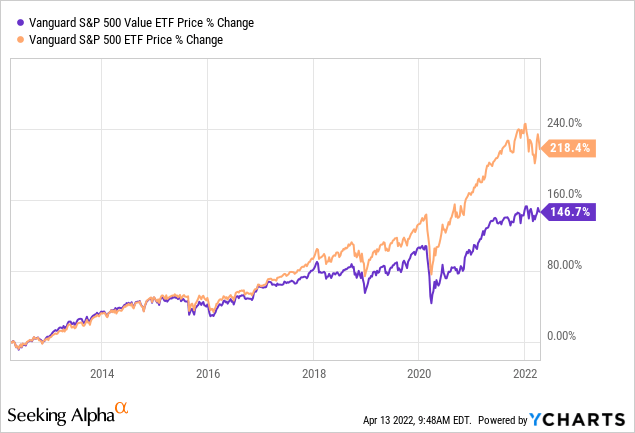
As mentioned above, YTD and on a price basis, the VOOV ETF has significantly outperformed the S&P500 as measured by the Vanguard S&P 500 ETF (VOO):
As you would expect, the VOOV value portfolio trades at a significant discount to the S&P500 in terms of P/E ratio and book value. However, as you would also expect, that comes at the expense of a lower growth, lower ROE, and lower EPS growth profile:
VOOV vs VOO Common Valuation Metrics (Vanguard)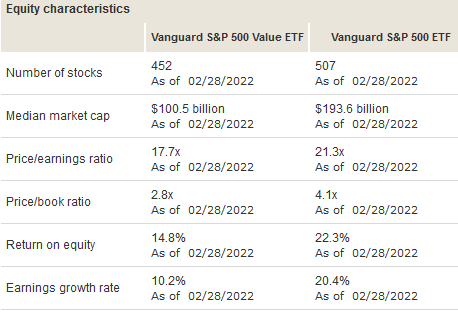
It’s a trade-off of valuation metrics. To sum it up, VOOV basically offers investors a lower risk/reward proposition during this time of increased market volatility and risks. A safe-haven, if you will. So let’s take a look at the top-10 holdings in the VOOV Value ETF and see how it has positioned investors to succeed going forward.
Top-10 Holdings
The top-10 holdings in the VOOV ETF are shown below and equate to 17.4% of what I consider to be a very well-diversified portfolio of 452 companies:
Vanguard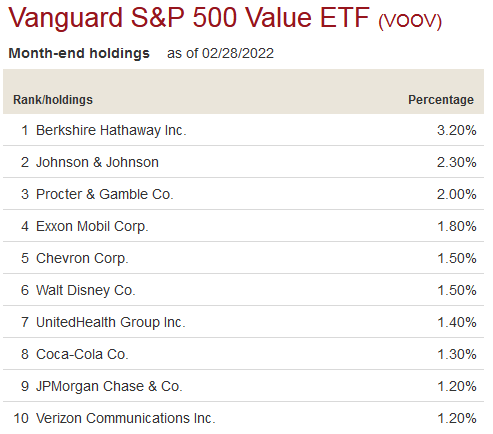
The #1 holding with a 3.2% weight is perennial value stock Berkshire Hathaway (BRK.A). Berkshire has a portfolio of well-diversified investments in insurance, rail, and utilities – just to name a few. Yet the #1 holding in Berkshire’s portfolio is Apple (AAPL), which now equates 47.6% of its stock holdings.
Consumer staples company Proctor & Gamble (PG) is the #2 holding with a 2.0% weight. Yesterday, PG raised its quarterly dividend 5% and now yields 2.3%. Historically, the consumer staples sector can raise prices to keep place with inflation. See the Forbes article Stocks That Benefit From Surging Inflation.
The #4 and #5 holdings, Exxon Mobil (XOM) and Chevron (CVX), were also mentioned in the Forbes piece referenced above. Exxon and Chevron are up 54% and 66%, respectively, over the past year. The companies are generating massive free-cash-flow at current oil & gas prices, and forward strip pricing continues to be bullish for the remainder of this year (see my recent Seeking Alpha piece The FCG ETF: Because Nat Gas Strip Pricing Is Bullish). Both stocks generate excellent income: Exxon yields 4.1% and Chevron yields 3.4%.
In addition, three Engine #1 representatives won seats on Exxon Mobil’s board-of-directors and could help unleash significant shareholder value from a company that has been an unmitigated disaster over the past decade – note the stock is currently trading at about where it was 10-years ago and during the biggest bull-market of our lives. I say that because contrary to public opinion, the reason so many institutional holders voted for Engine #1 directors over the executive management team’s recommendations wasn’t due solely to environmental issues, it was due to #1’s main goal: increase total returns to shareholders. Note that since #1 has had a major presence on the BOD, Exxon has significantly pared back its massive cap-ex expansion plans, has begun to sell more non-core low-margin assets, and has become a much more efficient company after slimming down its workforce and taking steps like consolidating its headquarters in Houston.
In the healthcare sector, in addition to #2 holding Johnson & Johnson (JNJ), VOOV’s top-10 holdings also include UnitedHealth Group (UNH). UnitedHealth is up 41.8% over the past year (+6.3% YTD), has a forward P/E of 24.7x, and pays a $5.80/share dividend (1.1% yield).
Verizon (VZ) rounds out the top-10 with a 1.2% weight. Verizon yields 4.8% and should continue to benefit from a strong 5G upgrade cycle as it continues to turn-off previous generation networks. Indeed, despite me being totally content with my 8-year old iPhone 5C, I was forced to upgrade to a new iPhone given the old 3G network will be turned off by year-end. Verizon is down ~10% from its all-time high, but up 2.4% YTD while the broad market has struggled and is down significantly.
Performance
While I am making the argument that the VOOV ETF is an excellent safe-haven play, note that it also has a strong long-term performance track-record – delivering 12.5% average annual returns since the fund’s inception in 2010:
VOOV Performance Track Record (Vanguard)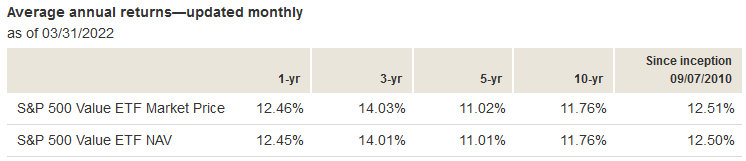
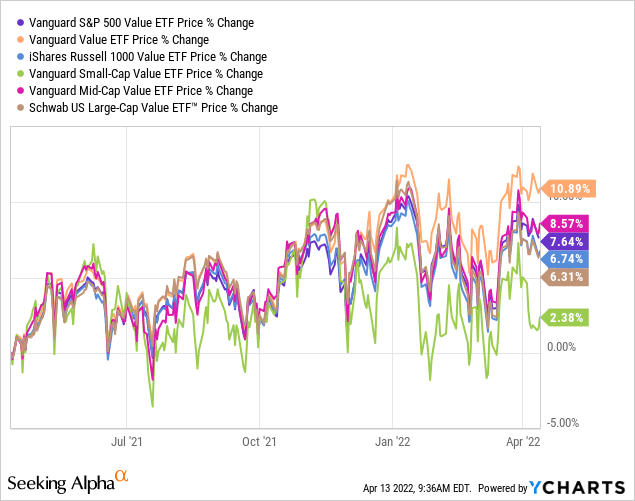
As compared to other value funds across all market-cap sectors, note that the Vanguard Value ETF (VTV) and Vanguard Mid-Cap Value (VOE) have actually performed better than VOOV over the past year. However, over the past three years all three of these Vanguard funds have returned basically the same (~14% annually):
Risks
All the typical risks of the current macro environment hold for the VOOV ETF as well: covid-19 related supply-chain risks & factory shut-downs, rising inflation, rising interest rates, and massive geopolitical uncertainty due to Putin’s invasion of Ukraine and the resulting sanctions on Russia by the United States and free-world Democratic countries in NATO. All of these factors threaten global growth and could easily push the U.S. into recession in 2023.
That said, and as reported earlier, the generally lower valuation levels of the VOOV ETF (P/E=17.7x and price-to-book of 2.8x) as compared to the S&P500 and other broad market averages bode well for the fund to act as a safe-haven during increased market volatility.
Summary & Conclusions
After reviewing the VOOV Value ETF’s portfolio, I am convinced it has performed as a safe-haven so far this year – and will continue to do so moving forward. That being the case, investors should consider the fund as a core holding within a well-diversified portfolio built for the long-term and to hold through thick-n-thin. However, I recommend investors continue to over-weight the S&P500, i.e., the Vanguard S&P600 ETF (VOO), over the long-term – perhaps allocating 25% of whatever he or she holds in VOO (or whatever S&P500 fund) into the VOOV fund. Such an allocation can provide ballast to a portfolio while navigating ever-more uncertain times. Also, note the expense fee of VOO is only 0.03% as compared to 0.10% for VOOV, and that is significant over a long-term horizon.
I’ll end with a 10-year price-chart comparison which demonstrates why, over the long-term, I continue to allocate more capital to the S&P500 as compared to the S&P500 Value fund in my own personal portfolio:
Be the first to comment