

SomeMeans/iStock via Getty Images
Investment Thesis
Shares of the Vanguard Mega Cap Growth ETF (NYSEARCA:MGK) have declined approximately 30% YTD, leaving investors and analysts wondering when it will bottom out. There are many contributing factors to this decline, but none are more powerful than the less-than-impressive earnings results most mega-cap stocks reported in recent quarters. Furthermore, negative guidance from company management provides Wall Street analysts with an additional reason to downgrade expectations further. It’s this knock-on effect that’s been so devastating, and while it’s tempting to try to catch the falling knife that is MGK, it’s not prudent nor even necessary, given the alternatives. This article details the earnings surprise trends for MGK’s top 25 holdings and compares its fundamentals alongside the iShares Russell Top 200 Growth ETF (IWY), the more diversified and superior choice. In short, my recommendation is straightforward: there’s no need to buy MGK today.
MGK Overview
Strategy Discussion
Vanguard uses CRSP Indexes that use dynamic breakpoints to determine how securities are classified. Instead of an arbitrary number like $250 billion to define a mega-cap stock, the universe is defined as securities inside the top 70% by market capitalization. To avoid unnecessary turnover and trading costs, the Index won’t exclude current constituents so long as they remain in the top 76%, making the index efficient. A security’s growth score is measured according to six factors:
- Future long-term earnings per share growth
- Future short-term earnings per share growth
- Three-year historical earnings per share growth
- Three-year historical sales per share growth
- Current investment-to-assets ratio
- Return on assets
Valuation ratios like price-earnings and price-cash flow are excluded, as is typical for a growth model. This lack of valuation focus has contributed to MGK’s steep decline this year. Although this is not a criticism of the strategy, investors should keep it in mind if the current risk-off environment continues.
Sector Exposures and Top Ten Holdings
Relative to the SPDR S&P 500 ETF (SPY), MGK has nearly double the exposure to the Technology (49.23%), Consumer Discretionary (20.70%), and Communication Services (13.09%) sectors. There’s not much diversification, and investors should shoot for a more diversified fund after the incredible post-pandemic run-ups of stocks like Amazon (AMZN) and Tesla (TSLA). That’s why I also included IWY in the table below. You’ll notice its Health Care exposure is twice that of MGK, resulting in a less-volatile fund due to the inclusion of companies like UnitedHealth Group (UNH) and AbbVie (ABBV).
Morningstar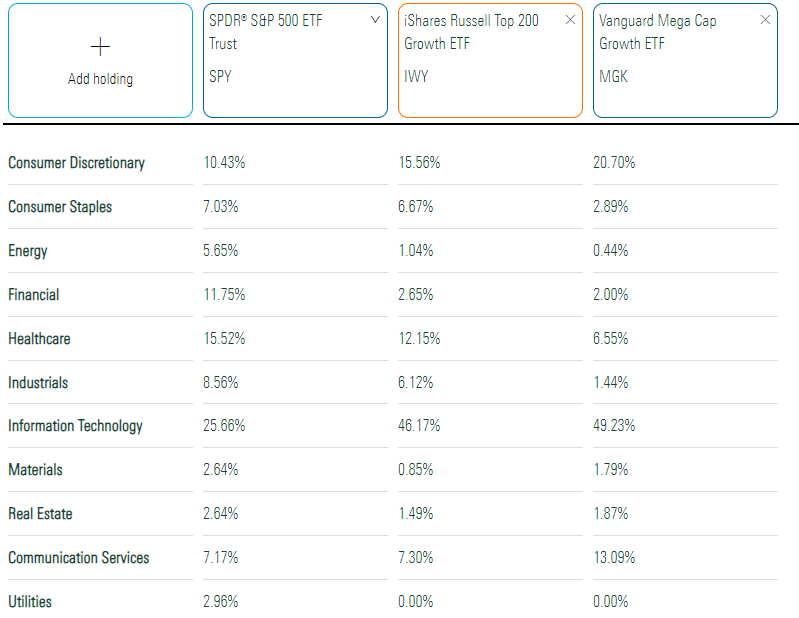
MGK’s top ten holdings as of September 30 are listed below. Vanguard’s delay in updating their holdings is 30-45 days, so while this listing could be better, it’s reasonably accurate. Based on one-month price returns, the main changes would be lower weights assigned to Amazon, Tesla, and Meta Platforms (META), with higher weights given to Visa (V) and NVIDIA (NVDA).
Vanguard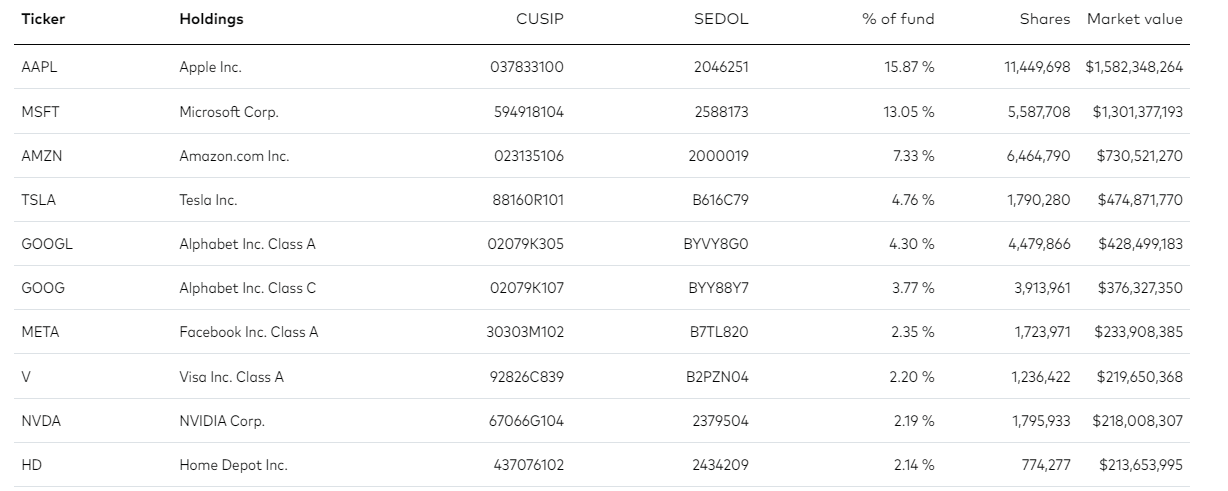
MGK’s top 25 holdings have market capitalizations above $100 billion, accounting for 75.98% of the portfolio. For comparison, IWY’s top 25 holdings total 72.23%, so it’s better diversified while keeping the same theme.
Performance
MGK has an excellent long-term track record, gaining an annualized 13.34% since its September 2009 inception compared to 12.37% for SPY. However, these returns were lower than IWY’s 14.38% annualized gain, and the table below shows that IWY was also less volatile. As a result, IWY has the best risk-adjusted return (Sharpe Ratio).
Portfolio Visualizer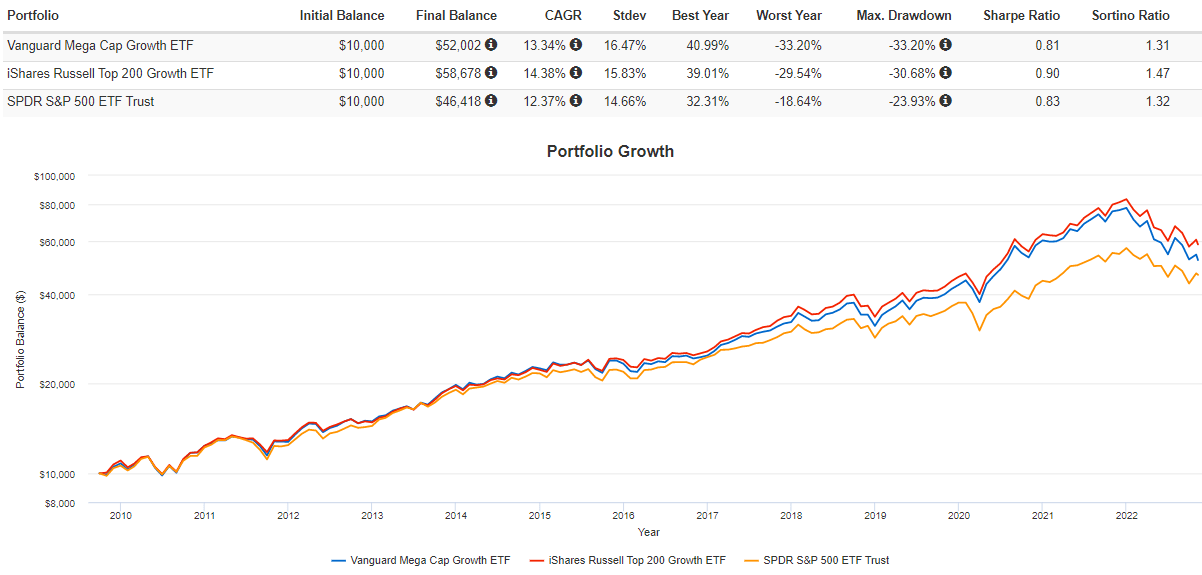
MGK has declined this year by 33.20%, erasing all of last year’s 28.58% gains. Investors are still 21.09% above 2019’s ending balance, but it’s easy to imagine those gains may also be wiped out. By comparison, IWY is 28.37% above its 2019 ending balance.
Portfolio Visualizer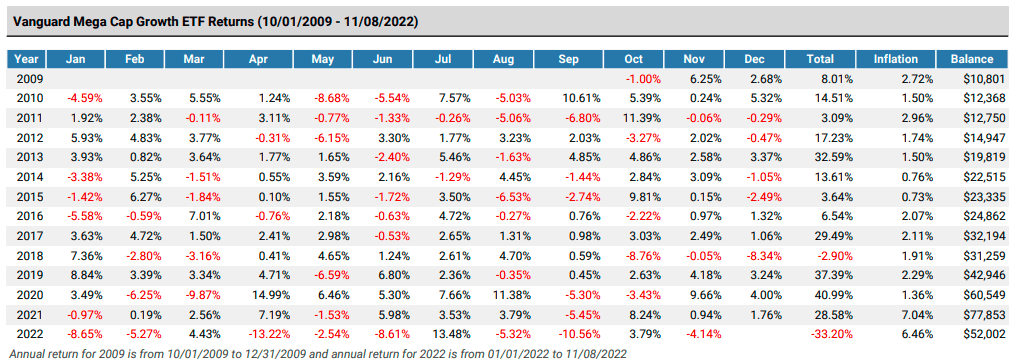
ETF Analysis
Meta Platforms: A Case Study
You should have a good reason to purchase MGK or any security. It could be as simple as following a dollar-cost-averaging strategy or even boosting your portfolio’s growth profile efficiently. What doesn’t make sense is to purchase based on a belief that prices can’t decline further. Take Meta Platforms, for example. In 2022, Seeking Alpha contributors published 326 articles with the following ratings distributions:
- Strong Sell: 3
- Sell: 20
- Hold: 60
- Buy: 153
- Strong Buy: 90
That’s three-quarters of articles recommending a buy or a strong buy, yet the company provided few reasons to believe a turnaround was imminent. Meta Platforms began the year trading at 23.81x forward earnings and a 30.31% estimated earnings growth rate. However, when it became clear that the 1.32% Q3 2021 earnings surprise wasn’t a one-off, analysts slashed future expectations, and the stock is now down close to 70% YTD. Competing with the double-digit positive earnings surprises from the previous five quarters was hard, so the normalization of its valuation was perfectly reasonable.
Seeking Alpha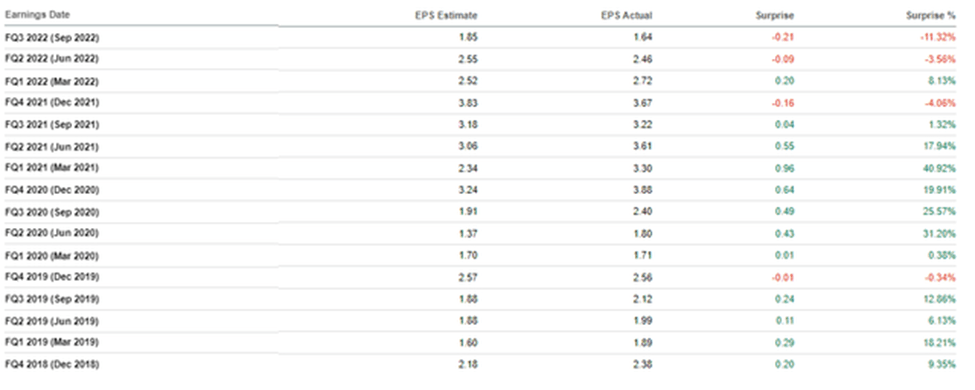
Today, Meta Platforms trades at just 10.61x forward earnings but has a -6.84% earnings growth rate. Investors shouldn’t pay a premium for a company that consistently disappoints come earnings time. For those wanting a deeper dive, Albert Lin, a Seeking Alpha contributor who has identified Meta Platforms as a value trap all year, provides an excellent summary of the company’s challenges. It remains to be seen how effective Mark Zuckerberg’s layoff plans will be, but it’s safe to say that spending is out of control.
Seeking Alpha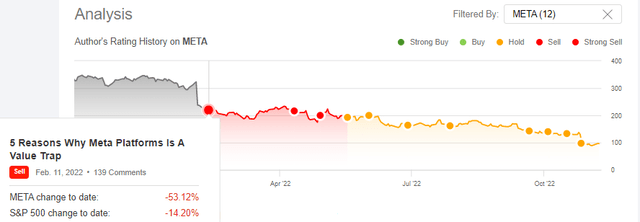
Earnings Surprise Trends
The following table summarizes the last eight quarters of earnings surprises for MGK’s top 25 holdings. The bottom rows highlight the median for the group and the aggregate earnings surprise for the S&P 500 Index.
The Sunday Investor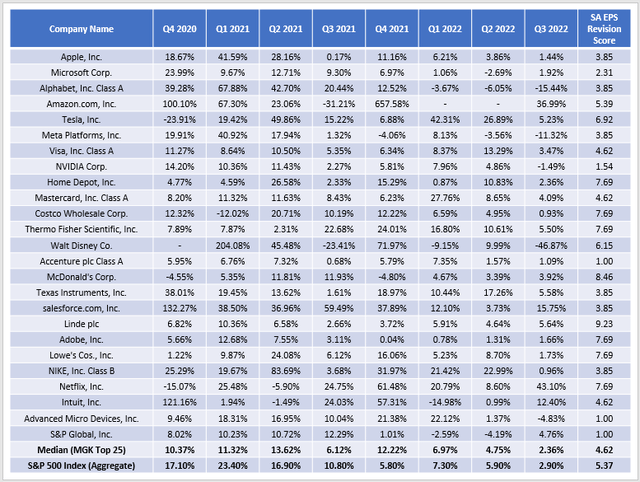
The downward trends are concerning. In March, MGK traded at 34.00x forward earnings with 25.40% estimated earnings growth. Today it’s 25.90x with 14.97% earnings growth, and we’ve had at least four consecutive disappointing earnings seasons. The long-term average earnings surprise is between 5-7%, so this quarter’s 2.90% figure is a real eye-opener. Before putting our faith back in these mega-cap growth stocks, the least we should ask for is a reversal of these trends. Unfortunately, we’ll have to wait until January to see what happens next.
Fundamentals Snapshot By Company
Although MGK is likely to be a successful in the long-term, I urge readers to consider alternatives. Below are the fundamentals for its top 25 holdings, and I’ve included the same metrics for IWY and SPY. Each is superior in its own way, but growth investors will likely favor IWY. Its 14.14% earnings growth is less than a percentage point behind MGK, but it’s also about a point cheaper on a forward earnings and trailing cash flow basis. In addition, its 9.78 Profitability Score is the best of any of the 37 large-cap growth ETFs I monitor.
The Sunday Investor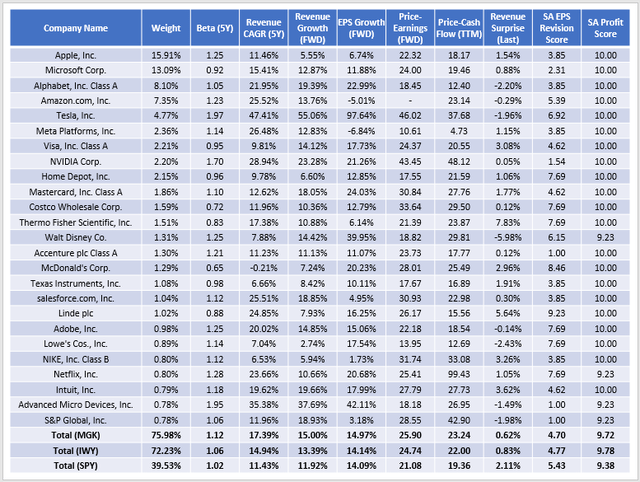
I mentioned how IWY includes more Health Care stocks. UnitedHealth Group, AbbVie, and Eli Lilly (LLY) are three examples, and PepsiCo (PEP), Coca-Cola (KO), and Procter & Gamble (PG) offer additional protection from the Consumer Staples sector. None are included in MGK but have a combined 10.76% weighting in IWY, which helps explain IWY’s lower volatility. The main issue with these companies is that they’re hardly considered growth stocks. Per the table below, only UNH has a double-digit estimated sales and earnings per share growth rate (11.04% and 13.91%).
Seeking Alpha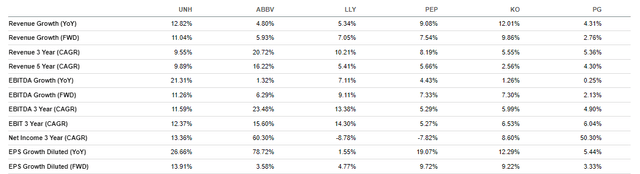
While these companies drive down IWY’s overall growth, it’s a fair compromise for added diversification and increased profitability. Also, the two sectors had a reasonably good earnings season last quarter. Yardeni Research reports an aggregate earnings surprise of 8.0% and 6.0% for Health Care and Consumer Staples, so IWY investors should at least be able to ride a little more earnings momentum as we close the year.
Yardeni Research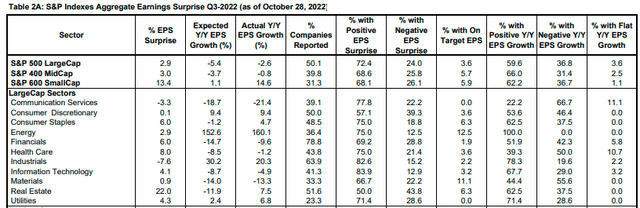
Investment Recommendation
MGK is a mega-cap growth ETF with an excellent track record with an affordable 0.07% expense ratio. Based on its 9.72 Profitability Score, investors will likely do very well in the long run if this quality is maintained. However, until the trend in earnings surprises reverses, I would wait to buy MGK. Besides, IWY provides a lot of exposure to the same highly-profitable companies but is better diversified across sectors and is performing about as well today after a softer-than-expected inflation reading. That’s my pick for any growth investor looking to sleep well at night.
What do you think? Is it fair to consider diversification and earnings momentum, or is a pure mega-cap growth ETF like MGK the way to go? Please let me know in the comments section below!
Be the first to comment