

mysticenergy
Introduction
In business, a competitor can eat your lunch by taking your customers and destroying the demand for your product. More generally, the idiom means to handily beat, defeat, or outwit a competitor. Many of us have some portion of our portfolios in oil and gas (O&G) including Vanguard Energy ETF (NYSEARCA:VDE). Others may be tempted by the O&G sector’s market-beating year-to-date returns. Both groups would be wise to realistically assess renewable energy’s current and future impact on O&G demand. As investors, we do not want the market to eat our lunch, spoil our plans, or reduce our lifestyle in retirement.
I believe that the current up-cycle in O&G is just getting started and most investors should have, at least, some broad exposure to further upside in O&G. Please see my recent analysis of FTI for a broad discussion of current O&G market conditions. Energy bulls may want to hold VDE for broad energy sector exposure while making additional targeted investments in the sector. Even investors who would not normally invest in oil and gas might consider Vanguard Energy ETF for its low expenses and safe yield.
What about renewables? Is it safe to invest in the O&G sector right now or will renewables quickly offset demand? This discussion will start with an overview of VDE including its holdings and Seeking Alpha Quant Ratings. Next, renewable energy’s current and future impact on oil and gas demand will be explored from several perspectives. We will first review the results of a rigorous levelized cost analysis by Lazard, a U.S. based financial advisory firm. We will then look at some recent coverage of energy supply by U.S. EIA and put planned U.S. offshore wind projects in context. Finally, we review some analysis by BP, a large multi-national oil company.
Vanguard Energy ETF
Vanguard Energy ETF is a broad bet on oil and gas’s future in global energy markets. VDE seeks to track the performance of the MSCI US Market Energy Index by using a full replication technique.
VDE Top 25 Holdings
| Symbol | % Weight | Industry |
Quant Rating |
| XOM | 21.8% | Exploration & Production | 4.99 |
| CVX | 16.8% | Exploration & Production | 4.98 |
| COP | 7.0% | Exploration & Production | 4.90 |
| EOG | 3.9% | Exploration & Production | 3.33 |
| OXY | 3.4% | Exploration & Production | 3.49 |
| MPC | 3.2% | O&G Refining and Marketing | 4.97 |
| PXD | 3.2% | Exploration & Production | 3.38 |
| SLB | 3.1% | Oilfield Services | 3.46 |
| VLO | 2.7% | O&G Refining and Marketing | 4.98 |
| PSX | 2.4% | O&G Refining and Marketing | 4.95 |
| WMB | 2.3% | O&G Storage and Transport | 3.29 |
| DVN | 2.2% | Exploration & Production | 4.99 |
| KMI | 2.1% | O&G Storage and Transport | 3.41 |
| LNG | 1.9% | O&G Storage and Transport | 3.13 |
| HAL | 1.7% | Oilfield Services | 3.45 |
| OKE | 1.5% | O&G Storage and Transport | 3.08 |
| BKR | 1.5% | Oilfield Services | 3.15 |
| HES | 1.5% | Exploration & Production | 3.23 |
| FANG | 1.3% | Exploration & Production | 4.90 |
| CTRA | 1.2% | Exploration & Production | 4.79 |
| MRO | 1.1% | Exploration & Production | 4.96 |
| APA | 0.8% | Exploration & Production | 3.43 |
| TRGP | 0.8% | O&G Storage and Transport | 3.13 |
| OVV | 0.7% | Exploration & Production | 3.38 |
| EQT | 0.7% | Exploration & Production | 4.91 |
VDE holdings are 100% oil and gas and include multiple industries within the sector. All 25 holdings have Quant ratings greater than 3.0, a hold rating, while many have ratings approaching 5.0, a strong buy. Exploration and Production make up about 70% of holdings while Oilfield Services; Refining and Marketing; and Storage and Transport each make up about 10% of holdings.
VDE and Peers
Seeking Alpha
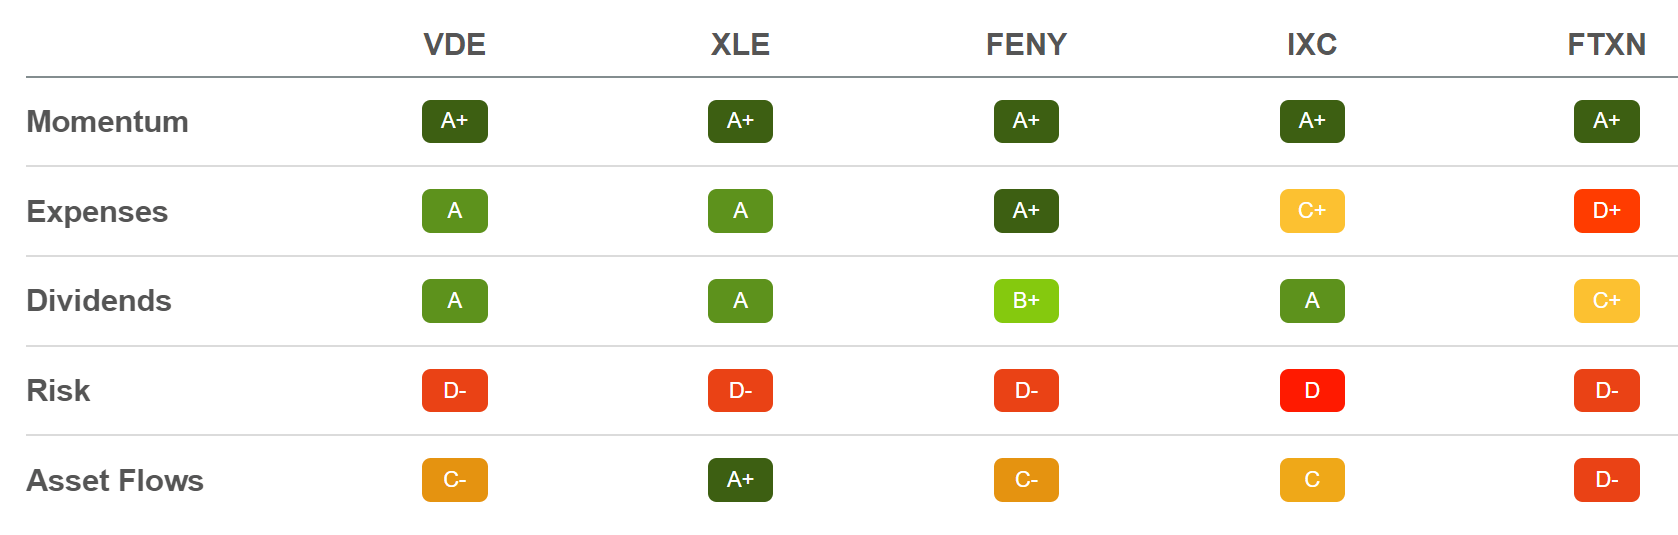
VDE compares favorably with other large oil and gas ETFs with the very good scores for momentum, expenses, and dividends. Energy Select Sector SPDR ETF (XLE) may appear to score better than VDE, but I prefer VDE for its larger number of holdings and lesser concentration. VDE has 112 total holdings with 67% of assets in its top 10 holdings while XLE has only 24 holdings and 78% of its assets its top ten holdings.
VDE Ratings
Seeking Alpha
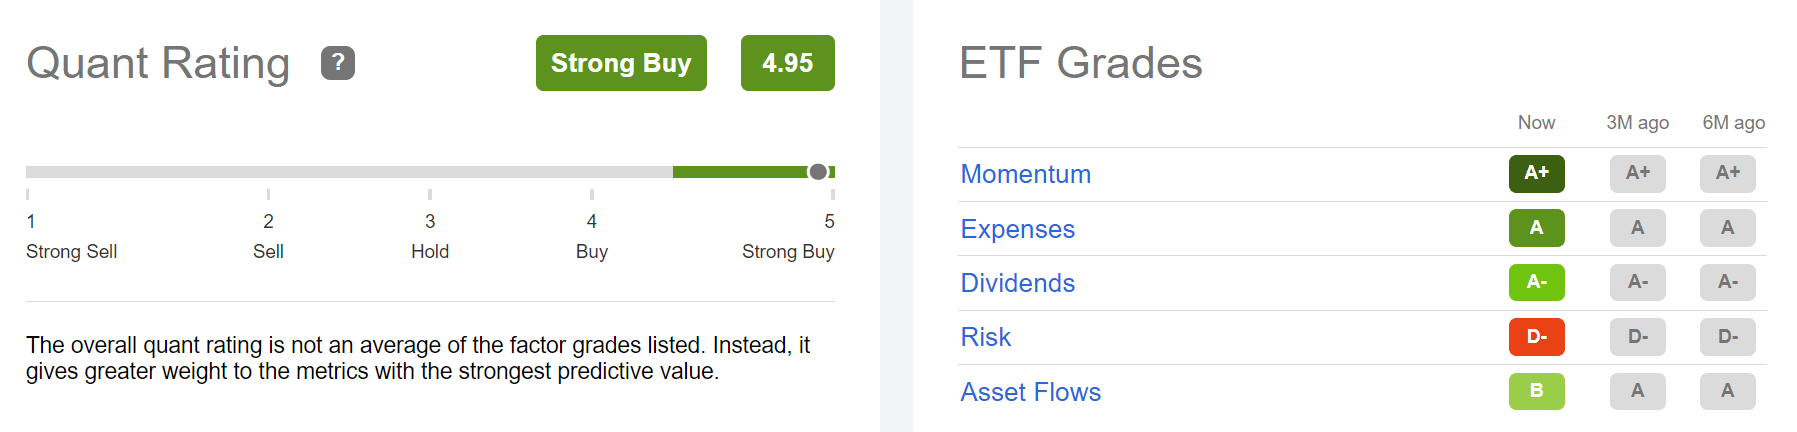
Seeking Alpha Quant metrics rate VDE a strong buy overall with robust momentum, low expenses, a safe dividend, and good asset flows. VDE does rate somewhat poorly on risk, but that risk is offset by O&G’s strong position in global energy markets.
Counting the Cost: Renewable Energy
Global prosperity depends, in large part, on cheap abundant energy for transportation; industry; and commercial & residential heating, cooling and lighting. The recent buzz around renewable energy often includes claims that wind or solar are cheaper than conventional energy. Lazard (LAZ), a North American asset management and financial advisory firm, compiles a yearly report entitled Lazard’s Levelized Cost Of Energy Analysis. These data are from the 15th and most recent iteration of that report from October of 2021.
Wind and Solar – Historic Levelized Cost of Energy (Unsubsidized)
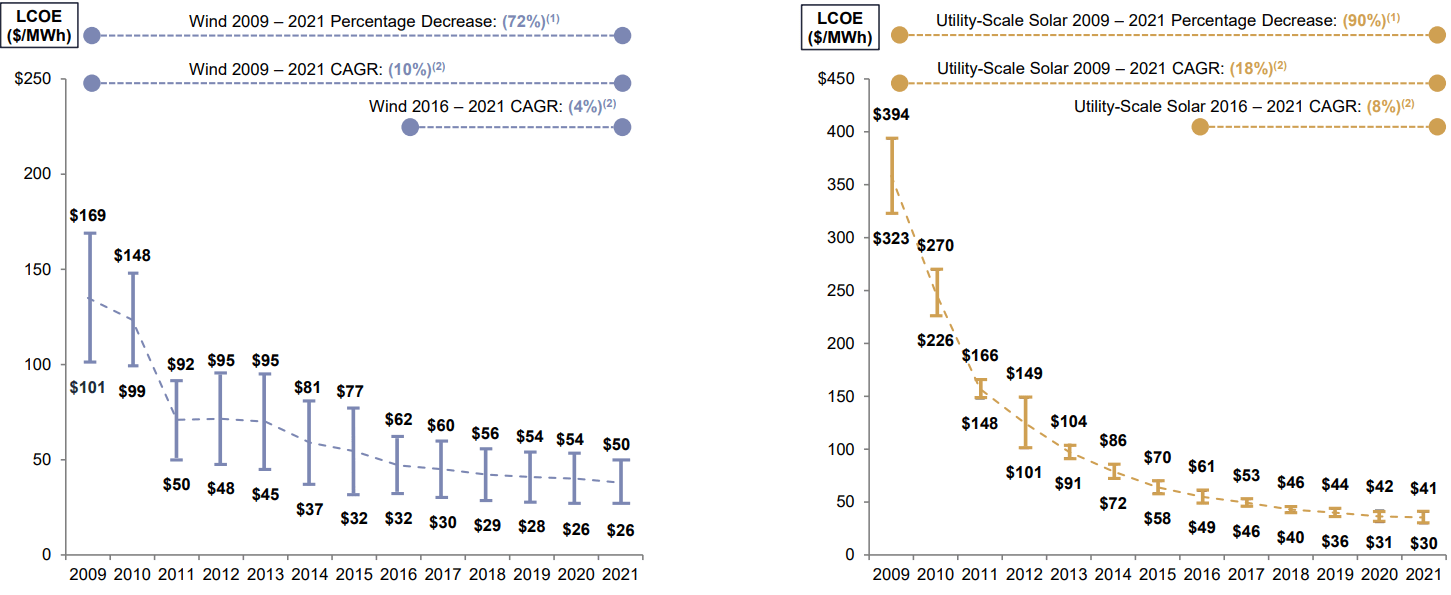
Lazard, 2021
Between 2009 and 2021, the unsubsidized, levelized cost of energy (LCOE) from wind and solar has decreased 72% and 92% respectively. Early rates of LCOE reduction were most dramatic, but have recently begun to flatten. With decreased cost of components, improved technology, and increased efficiency, renewable energy has become competitive with oil and gas in some circumstances.
Unsubsidized LCOE Comparison
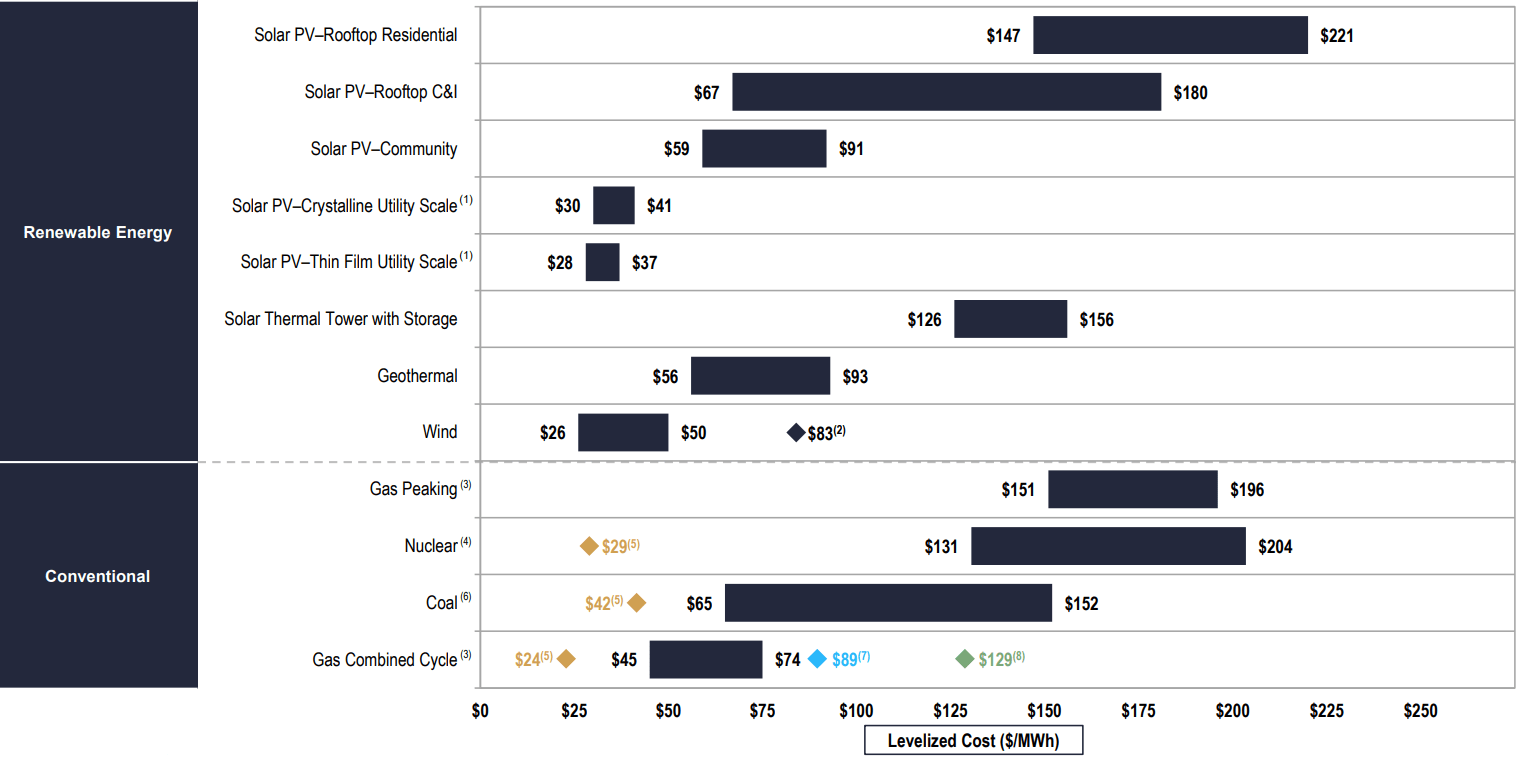
Lazard, 2021
The gas combined cycle turbine generator is the most common technology used and has an LCOE of 45-$74/MWh. The single lowest LCOE shown of $24/MWh is power generated using an existing, fully depreciated, natural gas plant.
The LCOE of renewable wind and solar can be competitive with that of a gas combined cycle turbine generated power. Combining the reported range for the two types of utility scale solar, their LCOE ranges from 24-$41/MWh. Wind has a reported LCOE range of $26-50/MWh. These data are for generation only and do not include battery storage or the capital cost of replacing existing infrastructure.
Location and Dispatch Characteristics
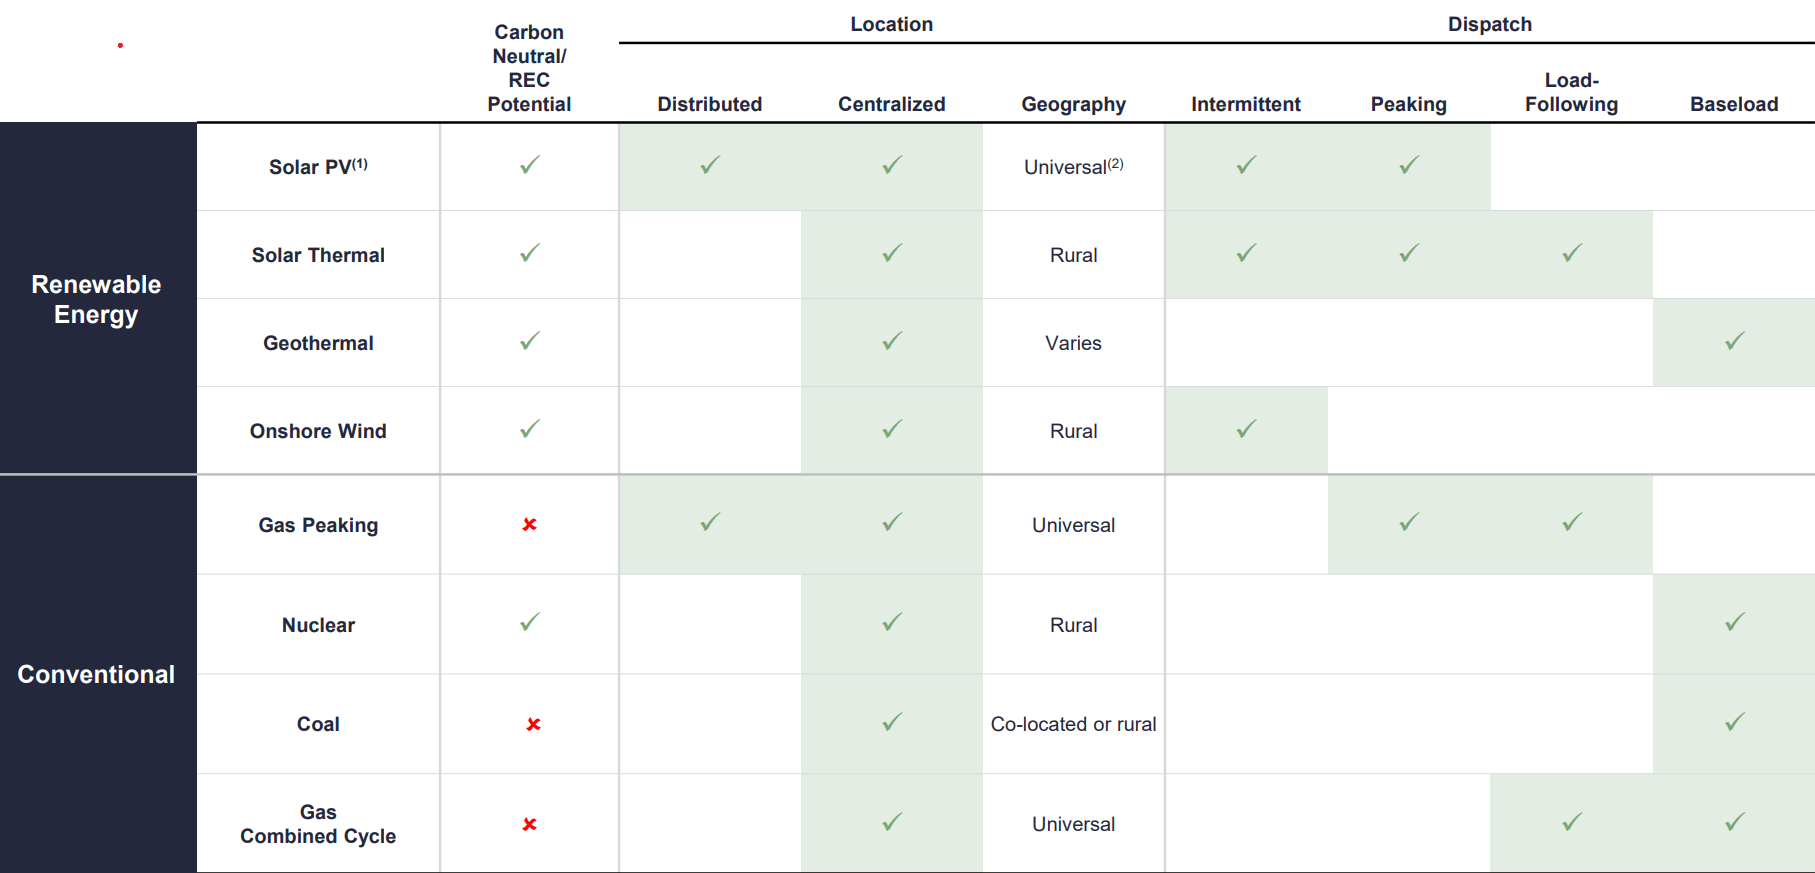
Lazard, 2021
The matrix above addresses some of the most critical and sometimes overlooked limitations of renewable wind and solar power. Renewable wind and solar are intermittent and cannot be relied upon to meet base load or respond to peak loads. Without storage, wind and solar power can only be used to meet concurrent demand or is lost if demand is not concurrent. One solution is to combine wind and/or solar with a parallel gas generation turbine plant to supply baseload respond to peak loads as necessary.
Battery storage can also be used to overcome intermittency and to maintain reserve power to meet peak demands. Lazard reports storage costs of $55-451/MWh in its Levelized Cost of Storage report. Assuming the low end of storage costs ($55/MWhr) and the cheapest wind or solar ($24 and $26/MWh respectively), the LCOE of the cheapest renewable energy with storage would be approximately $80/MWh.
At $80/MWh, power from renewable wind and solar is more expensive than generated gas power. However, renewable electricity would still be competitive with coal whose LCOE is $65 – $152/MWh. Notably, battery storage technology is improving rapidly such that its cost may decrease.
U.S. Energy: All Sources
The U.S. EIA provided a useful synopsis of present U.S. energy consumption by source and end-use in its April 2022 Monthly Energy Review.
U.S. Energy By Source
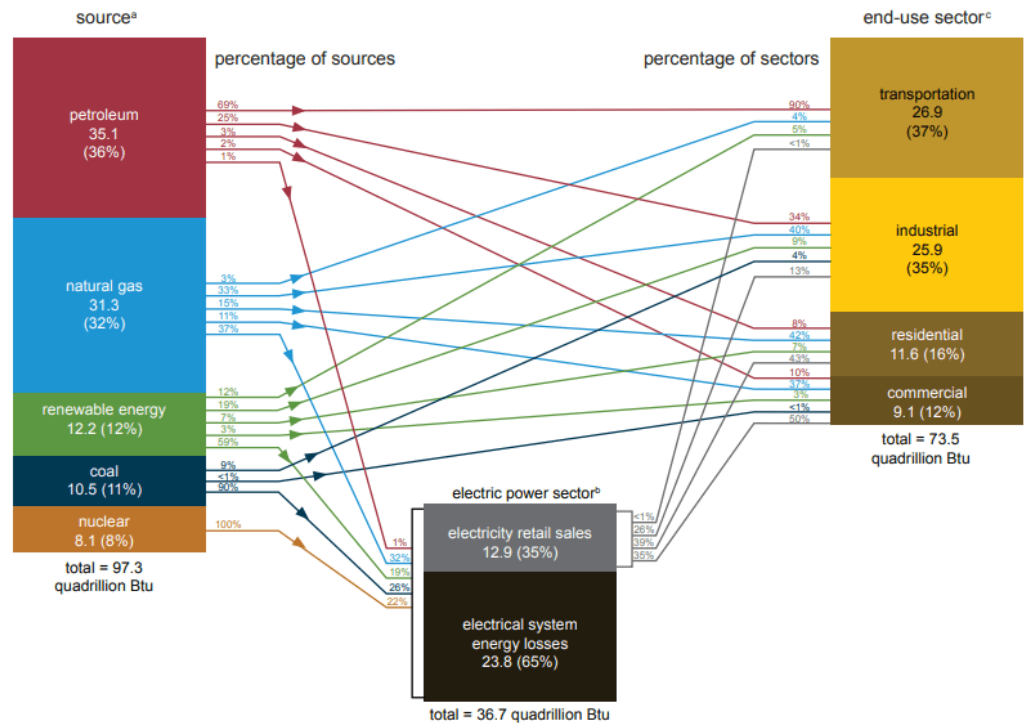
U.S. EIA, 2022
These data represent total consumption for the calendar year 2021 with oil and gas accounting for 68% of total supply. Including coal, fossil fuels provided 79% of total U.S. Energy. Transportation and industry were the biggest end-users at 37% and 35% respectively. Residential (16%) and commercial (12%) made up the remainder.
Total renewable energy was 12% of total energy supply with solar and wind providing 12% and 27% of that fraction. Renewable energy was consumed in each end-use sector both directly and through the electric power sector.
U.S. Offshore Wind Generating Capacity 2016-2029
On June 30th of 2020, EIA reported planned U.S. offshore wind projects that will add 6 gigawatts of capacity through 2029.
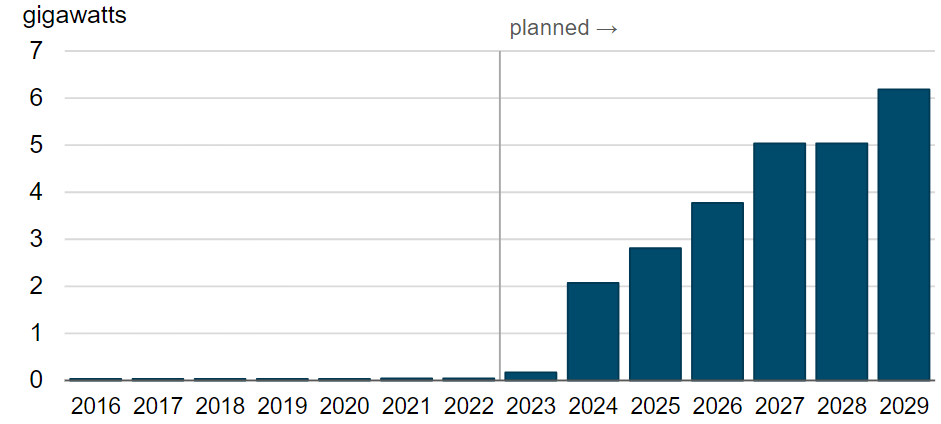
U.S. EIA. 2022
The above chart shows exponential growth in U.S. offshore wind and could foretell renewables destroying demand for oil and gas. To put planned offshore wind in perspective, it would be helpful to compare 6 gigawatts (GW) to total U.S. supply of 97.3 quadrillion btu (97.3 x 10^15 btu).
EIA provides a method to compare energy from noncombustible renewables to heat content from other sources. A fossil fuel heat equivalence, representing the heat content of fuel that would have otherwise been consumed to generate renewable power, of 8,773 btu/KWh reflects a weighted average of fuel types and the efficiency of existing plants.
Using the equivalence factor of 8,773 btu/KWh and assuming the proposed offshore wind generates at peak capacity 18hr/day over a year, a btu equivalent for the planned 6GW ( 6×10^15W) of offshore wind capacity can be calculated.
6GW x 10^6KW/GW x 18hr/day x 365.25day/yr x 8,773btu/KWh = 3.46^14btu = 0.346 quadrillion btu.
Therefore the planned capacity would be equal to about 0.36% of total U.S. energy supply (97.3 quadrillion btu) in 2021. I would appreciate anyone who is willing to double check my assumptions and unit conversions and comment. Assuming the planned offshore capacity is built and operates at near peak capacity, these projects will not destroy oil and gas demand.
Global Energy: Future Consumption From All Sources
In October of 2021, EIA published its latest International Energy Outlook.
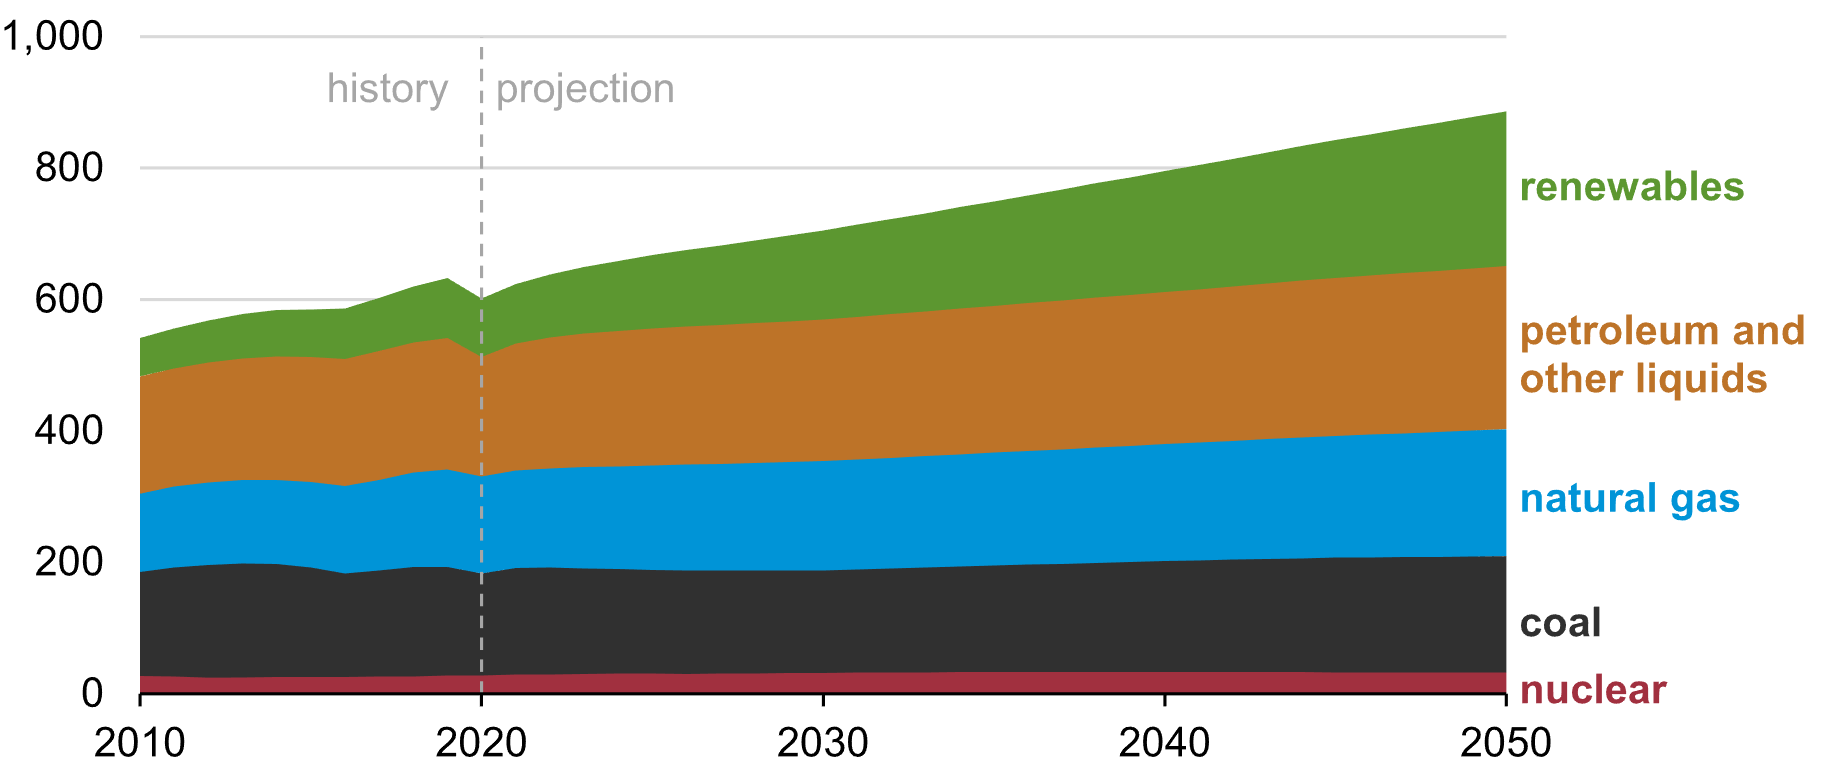
U.S. IEA, 2021
Historical and future energy consumption from all sources are plotted. EIA projects total global energy consumption to increase through 2050 with oil, gas, and even coal consumption nearly flat over the same time period. Increased energy consumption is expected to be matched by increased renewable energy supply.
An Oil and Gas Perspective
In June of 2022, BP (BP) released the 71st edition of its Statistical Review of World Energy. BP reports total CO2 emissions rose 5.7%, returning to 2019 levels, while energy demand increased 5.8% over 2020 demand, and exceeded 2019 demand by 1.3%.
Global Energy Consumption From All Sources (exajoules)
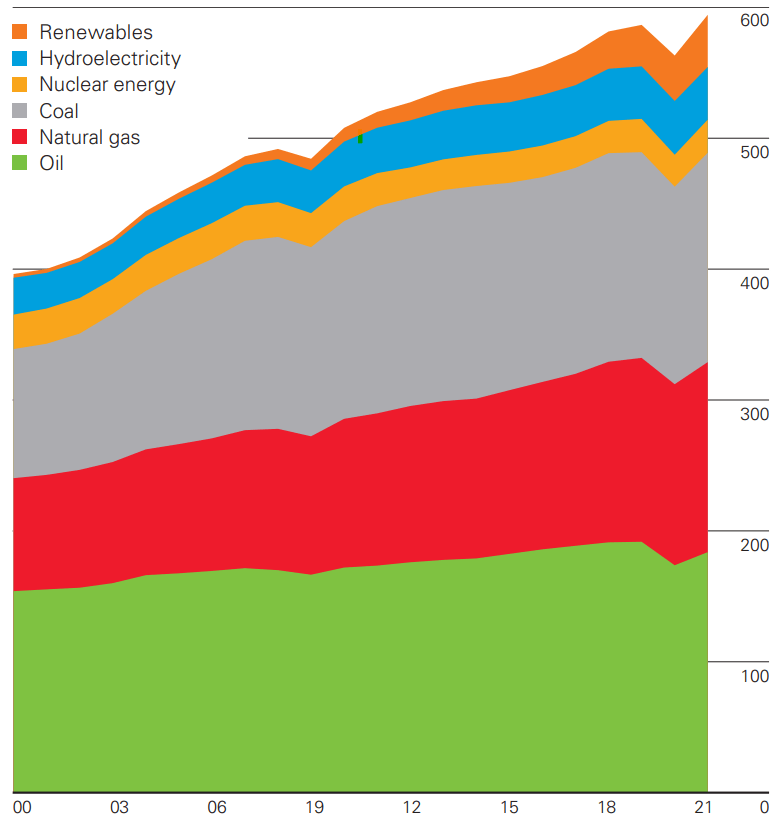
BP, 2022
Growth 2020 to 2021
Renewables: + 14.6%
Hydroelectricity: – 1.4%
Nuclear Energy: + 4.2%
Coal: + 5.5%
Natural Gas: + 5.3%
Oil: + 5.7%
Global energy consumption from all sources is shown from 2000 through 2021. Global energy was sourced in a very similar way to U.S. energy over the time period shown with fossil fuels accounting for 82% (vs 83% in 2019) of total global consumption.
BP’s Energy Outlook
BP examines three possible scenarios in its Energy Outlook for energy consumption and investments through 2050:
- New Momentum – current trend continues including increasing global energy demand and decarbonization ambitions.
- Accelerated – Increased global energy demand with more ambitious decarbonization efforts
- Net Zero – the most ambitious transformation of energy with aggressive decarbonization, societal behavior changes, and increased energy efficiency.
Global Energy Forecast
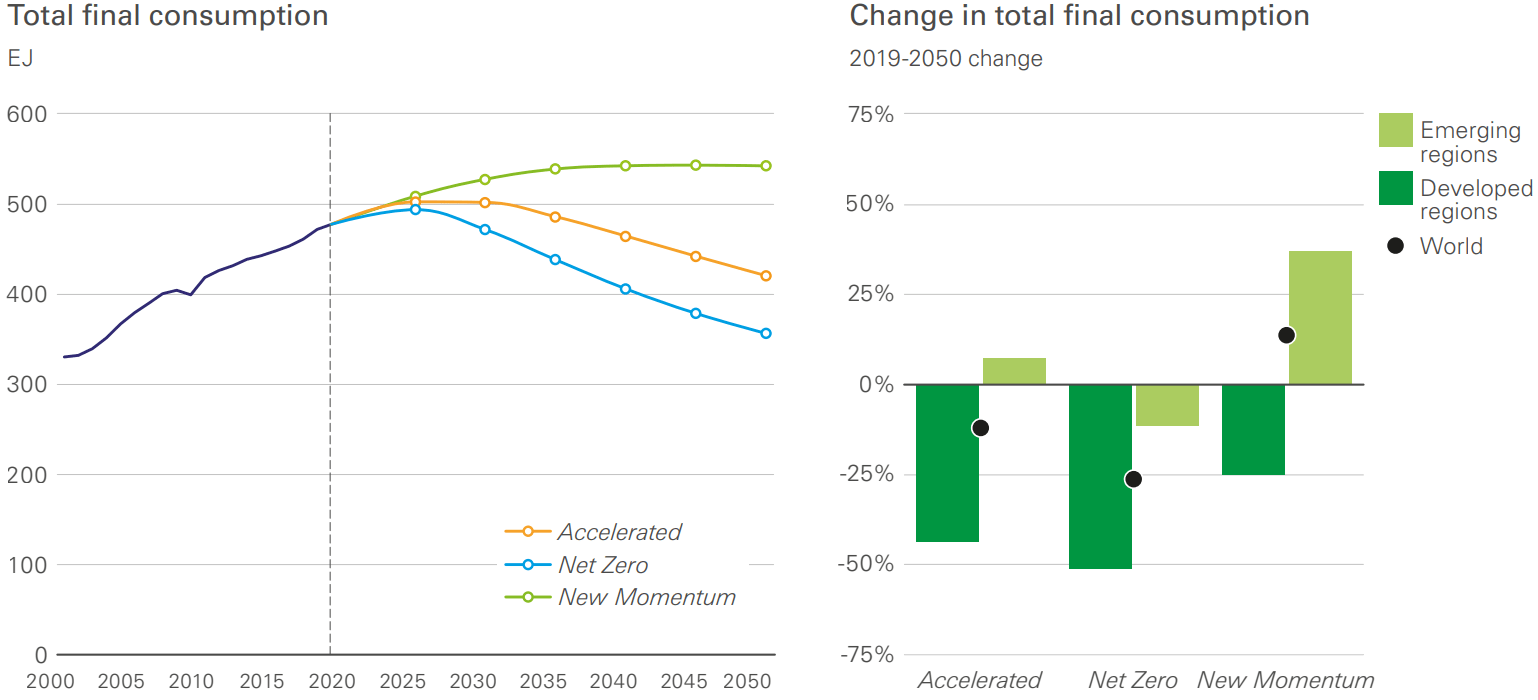
BP, 20222
Global energy consumption peaks near 2030 in all three proposed scenarios as energy efficiencies improve. In New Momentum, energy consumption flattens out after 2030. In Accelerated and Net Zero, energy consumption decreases steadily forward to 2050. All three scenarios see energy consumption falling in the developed world while generally increasing in emerging regions.
Average Annual Investment Through 2050
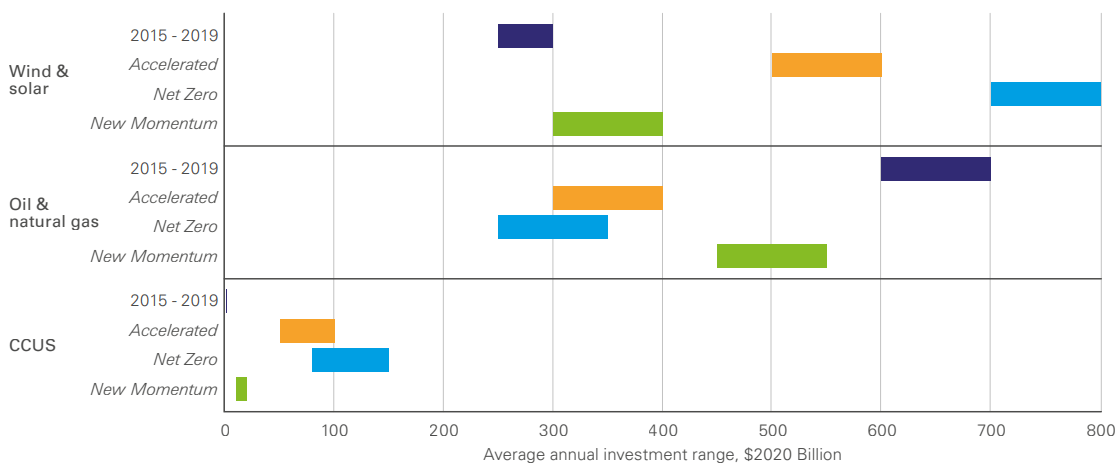
BP, 2022 (BP)
In each scenario, BP proposes an average annual investment range in renewable wind and solar, oil and gas, and carbon capture. In each scenario at least $300 billion will be invested in wind and solar while a minimum of $250 billion will be invested in oil and gas. BP also sees substantial investment in carbon capture.
Risks
The cost of energy from oil and gas vs. renewables is not the only factor to be considered in future energy decisions. Reducing carbon emissions is a growing initiative globally. Governments may subsidize renewable energy while discouraging oil and gas.
Oil and gas markets are volatile and subject to fear and speculation. According to recent Seeking Alpha coverage, signs of a global economic slowdown have caused energy commodities and equities to slide. In the last five days, WTI crude oil (CL1:COM) fell over 9% while VDE fell over 6%. Recession, or even continued fear of recession, could drive energy markets further down.
Longer term, new technology could drive down the cost of renewable energy or improve its reliability. Currently, intermittency and the cost of battery storage are wind and solar energy’s biggest shortcomings. An exponential improvement in storage technology or a substantial decrease in its cost could threaten natural gas’s dominance in electricity generation.
Conclusions
In the last few years, fossil fuel’s dominance in global energy supply seems to be challenged by renewable wind and solar energy. Renewable energy’s contribution to global energy supply is increasing, but currently, renewable energy is not cost competitive with oil and gas in most situations. Both cost and the intermittent nature of renewables are challenges. Currently renewable energy is most useful in combination with oil and gas.
Global demand for oil and gas is projected to remain constant and in some forecasts grow slightly over the next five years. It would appear that renewables are not eating oil and gas’s lunch yet and are not projected to do so over the current up-cycle in oil and gas.
In this climate, Vanguard Energy ETF is A safe bet given that the global demand for energy from all sources will be sufficient to support both O&G and renewable energy. I recommend investors buy and hold VDE for a broad exposure to the O&G sector.
Be the first to comment