

Hello my names is james,I’m photographer./iStock via Getty Images
The weakness in gold mining stocks relative to the price of gold over the past few months has left them undervalued once again and I believe it is time to buy the dip. While gold remains overvalued from a short-term perspective based on its relationship with forward-looking real U.S. bond yields, the long-term outlook remains bright. The VanEck Vectors Gold Miners ETF offers exposure to the world’s leading gold miners and looks set to outperform over the coming months and years. This marks a significant change in my stance compared to three months ago when I argued for a period of weakness in gold miners relative to gold itself (see ‘RING: Shifting From Miners To The Metal‘).
The GDX ETF
The VanEck Vectors Gold Miners ETF is the oldest, largest, and most liquid gold mining ETF which tracks the performance of the NYSE Arca Gold Mining Index. The underlying index has a market capitalization of over USD276bn, having fallen by 27% in just over two months. The ETF is dominated by Newmont (NYSE:NEM) and Barrick Gold (GOLD), whose weightings are 15% and 10% respectively, giving the index more diversification compared to the GDX’s rival the iShares MSCI Global Gold Miners ETF (RING) where these two stocks comprise 23% and 14%. This comes at the expense of a slightly higher expense ratio of 0.52% versus RING’s 0.39% and a lower dividend yield of 1.8% vs 2.4%. That said, we should see the GDX’s dividend continue to rise in line with the underlying NYSE Arca Gold Mining Index, which has risen back to multi-year highs of 2.3%.
Undervalued Once Again
Since its recent peak in April the GDX has fallen by over 20% relative to the price of gold, which has taken the ratio to its lowest level since the Covid crash and resulted in a significant fall in its valuation. The forward PE ratio now sits at a historically cheap 15.7x, while the forward EV/EBITDA ratio sits at 6.2x. As the chart below shows, 6x EV/EBITDA has been a level that has tended to mark bottoms for the GDX.
GDX EV/EBITDA (Bloomberg)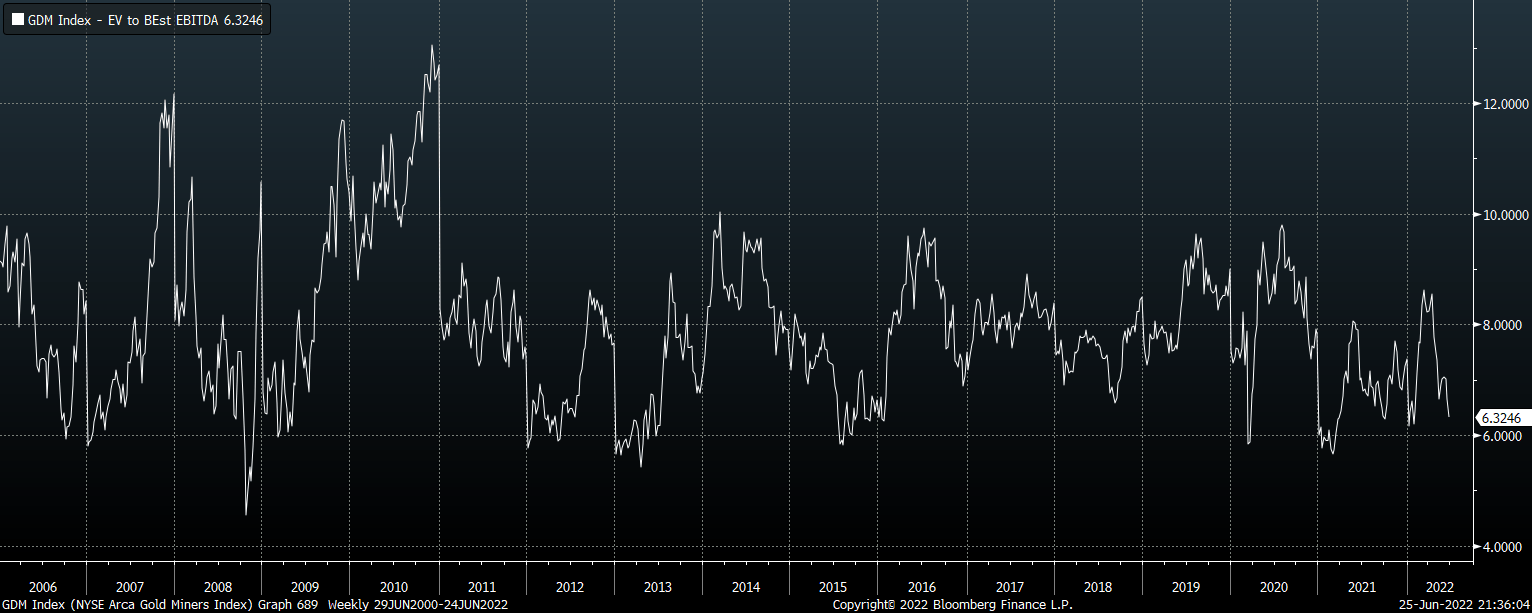
The GDX’s undervaluation can also be seen in its ratio relative to gold prices. As I have noted in previous articles, a comparison between the GDX price and gold understates the degree of the former’s undervaluation due to the rise in share issuance in the underlying companies. Nonetheless, even comparing the market cap of the underlying NYSE Arca Gold Mining Index we can see that the ratio is back below its long-term average. A comparison between the index’s enterprise value paints an even more favorable picture reflecting the decline in debt that has taken place in the sector over the past decade.
Bloomberg, Author’s calculations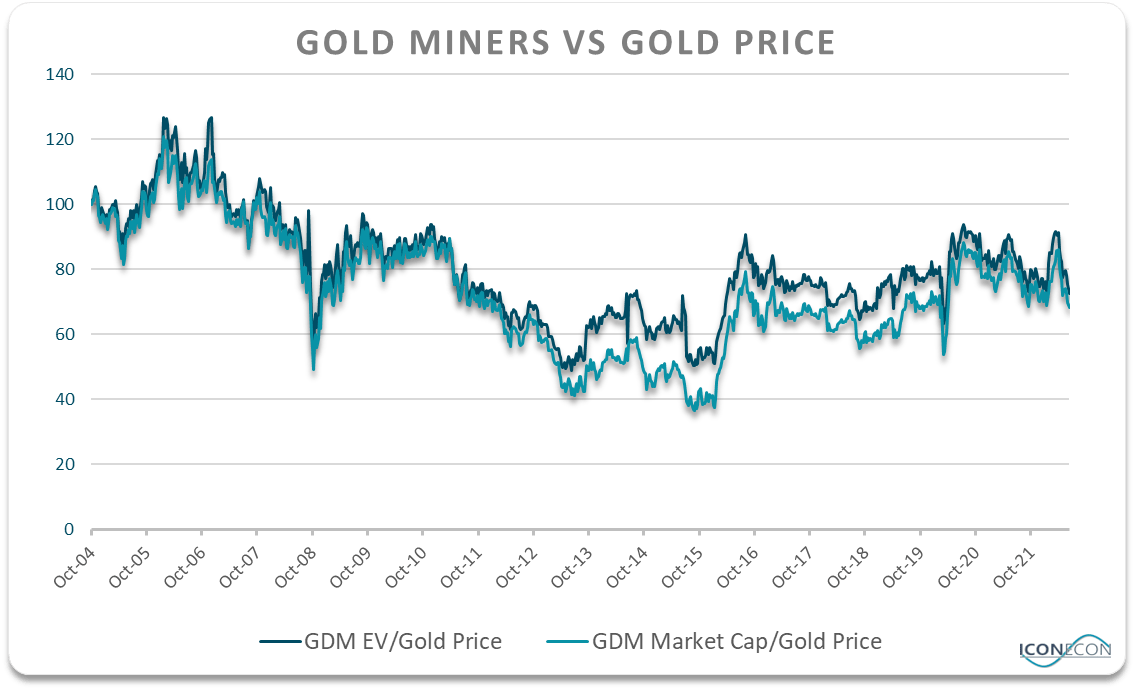
Gold Is Short-Term Overvalued But Fundamentals Remain Strong
The biggest risk to the GDX clearly comes from another leg down in gold prices, particularly given the fact that gold prices remain elevated relative to their main short-term driver, real U.S. bond yields. This can be seen in the chart below which shows the price of gold relative to the performance of U.S. inflation-linked bonds using the TIP ETF. The close correlation reflects the fact that rising interest rate expectations relative to inflation expectations undermine demand for gold as a store of value.
Gold Vs TIP ETF Price (Bloomberg)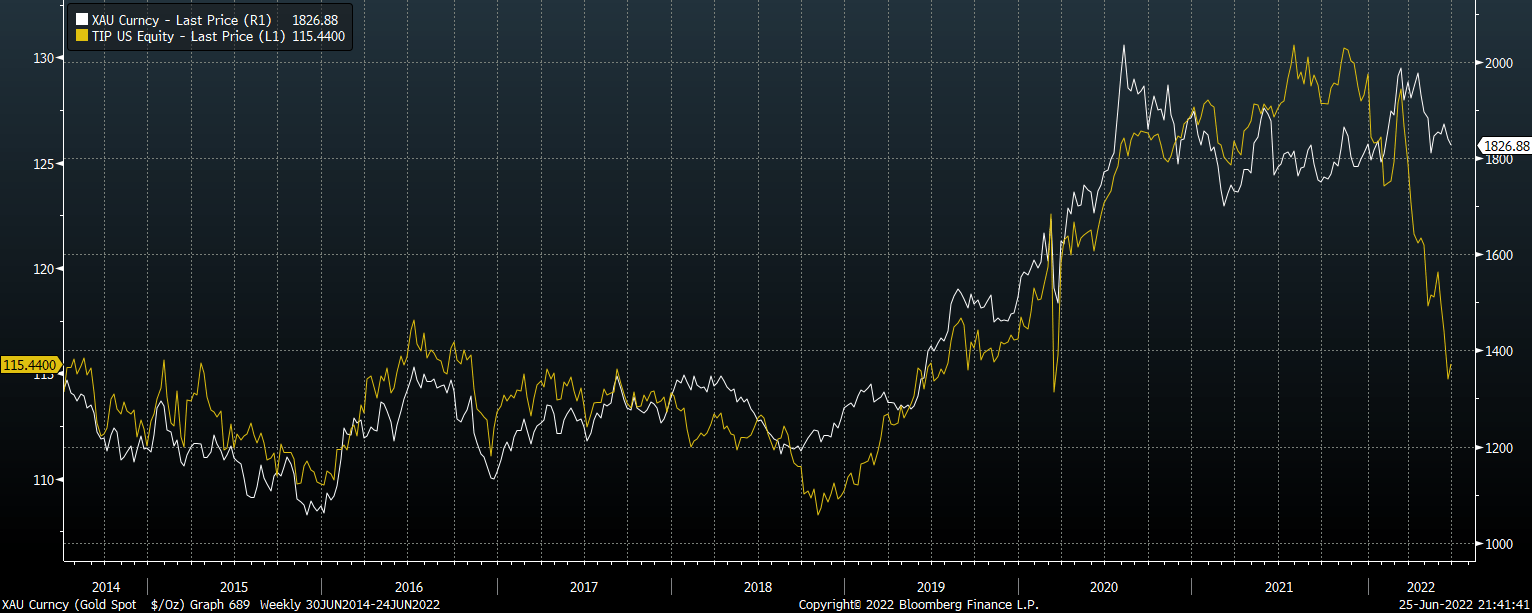
However, comparing gold to 10-year real yields ignores the impact of high rates of actual inflation seen over recent years. We should therefore compare the gold price with the total return performance of such bonds using the TIP ETF to get a fairer comparison. This correlation is much closer than using the price itself and shows that gold is only slightly overvalued.
Gold Vs TIP ETF Total Return (Bloomberg)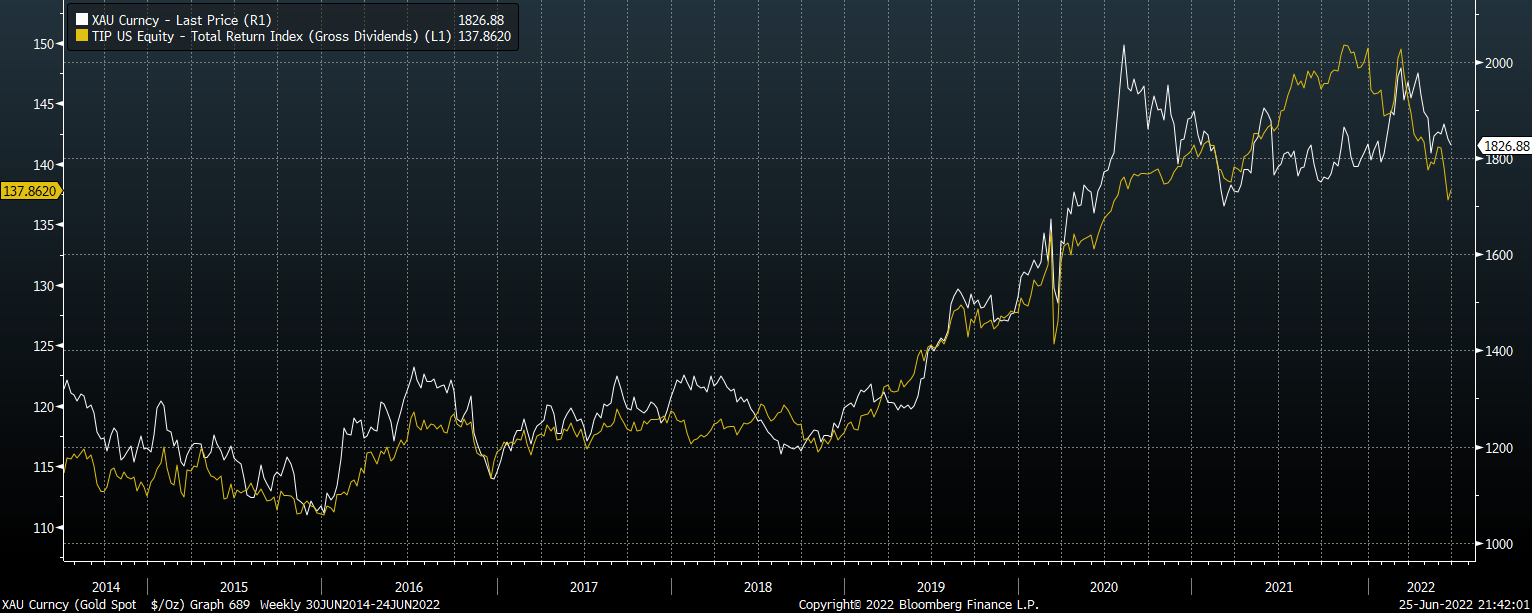
As I argued in ‘U.S. Bonds: Backing Up The Truck‘, I also firmly believe that real yields are likely to fall back down to zero over the coming months and years as the Fed is forced to end its tightening campaign amid increasing weakness in the U.S. economy. I would not be surprised to see headline CPI prints collapse over the coming months which would allow the Fed to talk down prospects of further rate hikes, which should be positive for gold prices.
Summary
After seeing heavy selling over the past few months, the GDX looks attractive once again at current gold prices. While the recent spike in inflation-linked bond yields poses a headwind for gold and therefore the GDX, we have likely seen the peak in real yields. Somewhat ironically, falling headline CPI prints are likely to be bullish for gold and the GDX as they allow the Fed to talk down prospects of future rate hikes.
Be the first to comment