

salihkilic
Introduction
As far as the laws of mathematics refer to reality, they are not certain; and as far as they are certain, they do not refer to reality.” ~ Albert Einstein
Three weeks into the new year, I have already written several forecasts of the uncertainty for 2023. This brief addition serves to augment prior articles with the fluid world of market behavior as threats of a debt ceiling standoff now dominate the headlines.
My long-term outlook for 2023 remains unchanged and is detailed in my submission to Seeking Alpha’s 2023 Market Prediction contest. I still offer readers an overly precise conviction that the S&P 500 Index (SP500) will end the year at 3,240.76 with tremendous volatility and trading opportunity.
“Extraordinary Measures” Collides With Fed’s QT Program
Over the years, I have studied and written at length about the quantitative tightening program and its market effects since its first major implementation in 2018.
In new developments this week, Treasury Secretary Yellen invoked Treasury’s authority to use “extraordinary measures” in preparation for a debt ceiling standoff. A flurry of news headlines warned of wide ranging potential disasters:
- The world’s largest economy risks defaulting on its debt for the first time in American history this summer.” ~ CNBC
- US default risk raises alarms across Wall Street” ~ Business Insider
- Debt ceiling standoff risks creating a ‘self-imposed calamity’ for global economy” ~ Fortune.
A History Lesson of Debt Ceiling Panic
Let’s put this sensational news cycle in a bit more context. Congress has approved 102 separate debt limit modifications since WWII and 20 modifications of the debt ceiling just since 2001. The exponential curve of U.S. debt levels and rising debt limits is illustrated on the chart below. We have never seen any limits last for very long before new arbitrary limits have been agreed upon in Congress. Once again it remains highly likely that the debt ceiling will be raised yet again avoiding every sensational worst case scenario for more than the 100th consecutive time. But the question we will look to discuss more closely is, what happens to markets until there is an agreement?
crfb.org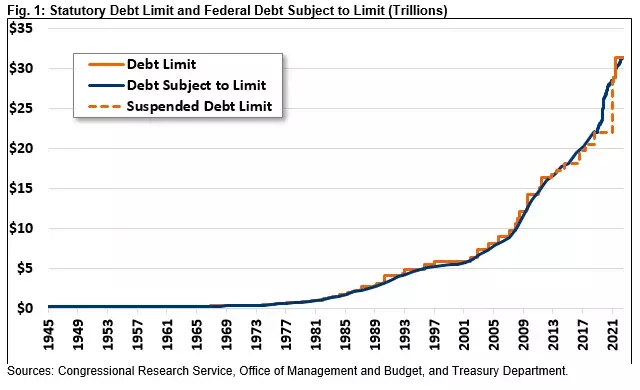
The term “extraordinary measures” was first introduced in 1985 as a means to give the Treasury more flexibility in managing obligations. According to the Bipartisan Policy Center, the Treasury Department has used these measures another six times between May 2011 and the end of 2021. Basically this process involves accounting maneuvers that allow the government to prioritize essential obligations over less critical payments that can be brought current after the critical period has ended. Secretary Yellen invoked this authority in her letter to Speaker McCarthy last week,
This letter serves to notify you, pursuant to 5 U.S.C. § 8348(L)(2), of the extraordinary measures Treasury began using today… a “debt issuance suspension period” will begin on Thursday, January 19, 2023, and last through Monday, June 5, 2023. ~ Treas. Sec. Janet Yellen
Goldman Sachs has produced an estimated timeline of how this process may unfold for as long as a debt ceiling standoff lasts in Congress. The debt limit is now fixed at $31.3 trillion until a new limit can be agreed upon. Fortunately, current cash balances in the Treasury General Account are well above average and tax receipts into tax season will also add to the size of the general account needed to operate the government for another 9 months. Goldman estimates that Congress has until late August or early September before the cash and accounting maneuvers are exhausted.
Goldman Sachs Global Investment Research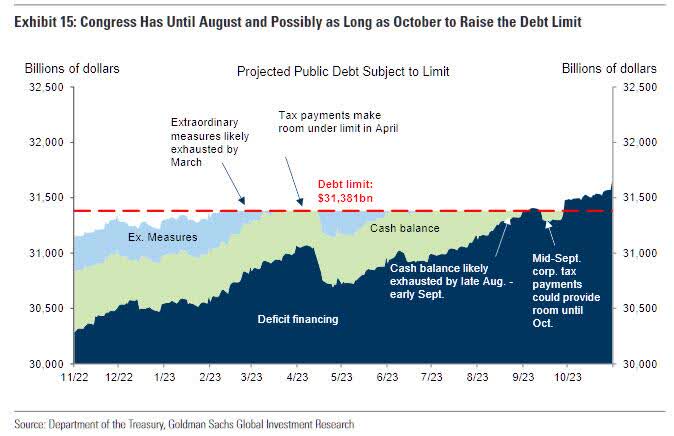
As we can see in the latest balances the general account is around $300 billion and well above pre-2020 average levels. The chart below gives us an excellent opportunity to evaluate all the prior “extraordinary measures” from 2011. We can evaluate both the Fed monetary (QE/QT) policy [blue] against the Treasury cash levels [red] line.
Yardeni.com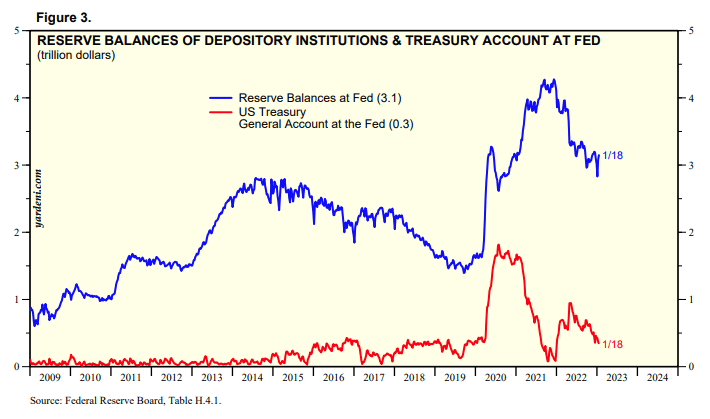
The three largest and most recent debt ceiling standoffs were in 2011, 2013, and 2021. In all three prior debt ceiling periods, the Fed was engaged in quantitative easing with increases in reserve balances. The only difference was that in 2013 the standoff in Congress led to an actual government shutdown. However, even including the most extreme case of a government shutdown in 2013, in all prior debt ceiling standoffs with “extraordinary measures” the Fed was aggressively adding to its balance sheet in favorable conditions for markets. Additionally in all three years the S&P 500 gained, +2.11% in 2011, +32.39% in 2013, and +28.71% in 2021.
Did those gains come from the Treasury using accounting measures to manage government operating expenses OR from ongoing QE and accommodative policies from the Fed at low interest rates? We cannot yet be certain without a QT period in our sample. However, the QE tapering in 2011 may be the closest comparison we have to consider along with the +2.11% returns much lower than the full QE years.
Yardeni.com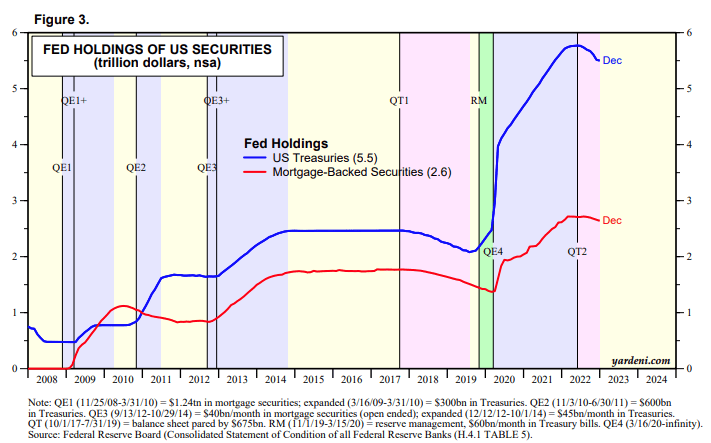
In the chart above we get another look at the periods of 2011, 2013, and 2021 overlayed on the timelines of the QE and QT programs from the Fed since 2008. We can see again that in 2011 QE2 was active and tapering off; in 2013, QE3 was increasing; in 2021, QE4 was incredibly strong and increasing. One other metric we have for comparison is the impact on the VIX volatility index surrounding the prior debt ceiling deadlines.
Goldman Sachs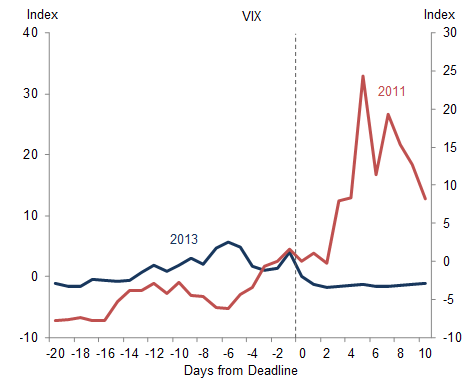
As the Goldman chart illustrates, 2011 and 2013 delivered rising volatility ahead of the deadlines, but different market volatility reactions after the deadline. In 2021, the VIX volatility index was also increasing ahead of the December deadline but like 2013, it dropped off sharply after an agreement was reached. We can probably expect similar market behavior if the debt ceiling activity for 2023 moves closer to a congressional deadline that is yet to be established. I would submit that 2011 may be a closer match to a QT period like 2023 with volatility likely to be higher during record market liquidity drain by the Fed this year.
What should we expect?
There is always the possibility that Congress comes to a budget agreement without a debt ceiling standoff. However, if prior debt ceiling events serve as an indicator, we can expect the following outcomes for 2023:
- The debt ceiling standoff will eventually result in the 103rd consecutive debt limit modification increase.
- The treasury cash levels will be depleted toward prior lows seen in 2011, 2013, and 2021, forcing both sides to finally capitulate.
- The VIX will increase ahead of growing concerns as the deadline approaches and then decline again as agreements are reached.
- I see no change in my prior market forecasts for a Fed-pivot around August/September.
- It appears to me that the QT program toward a $1 trillion balance sheet reduction target in August is a much stronger fund flow than the accounting maneuvers the Treasury may employ to keep the government solvent until September.
- We don’t have any prior examples of a debt ceiling standoff while the Fed was draining market liquidity with QT, but the closest example was 2011 with QE tapering and a 2.11% return on the S&P 500.
- In every year with QT, we have seen VIX volatility increase substantially and this may combine for increased volatility from a debt limit showdown.
VMBreakouts.com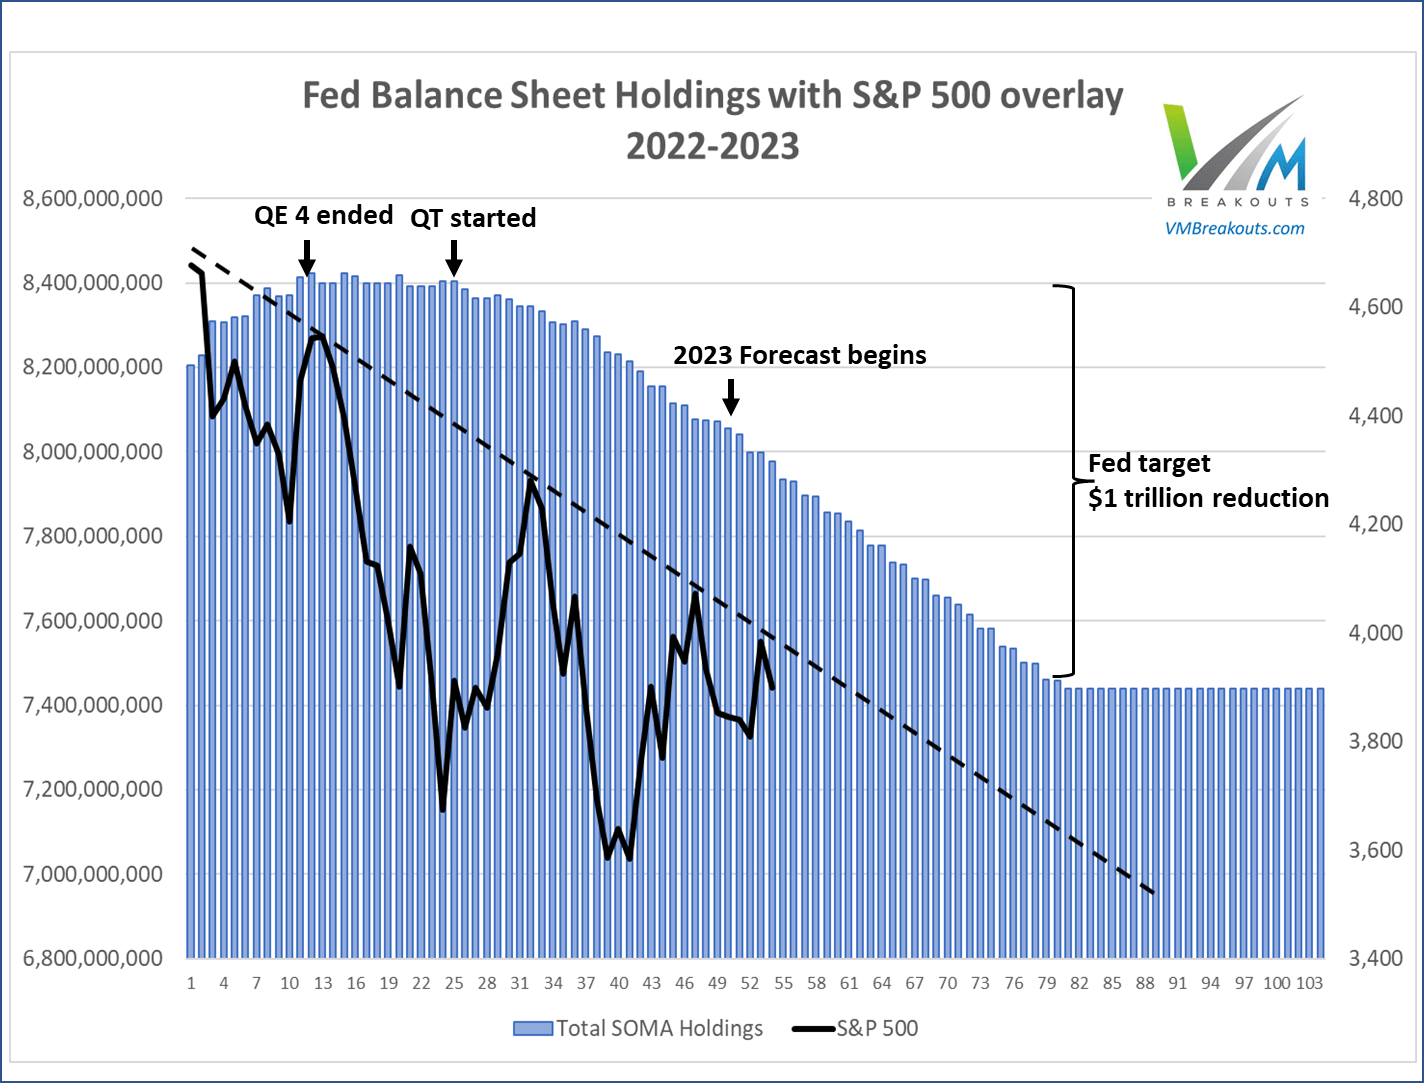
The Fed continues to aggressively reduce liquidity from markets in the most aggressive QT program in U.S. history.
Conclusion
There are countless examples from prior debt limit showdowns of the most dire predictions of sovereign default and economic calamity. In 2021, the last debt ceiling deadline was called,
The Riskiest Debt Limit Deadline in a Decade
The upcoming debt limit deadline is beginning to look as risky as the 2011 debt limit showdown that led to Standard & Poor’s downgrade of the US sovereign rating and eventually to budget sequestration, or the 2013 deadline that overlapped with a government shutdown. Like in 2011, sizeable budget deficits have motivated Republicans to use the debt limit to win policy concessions. Like in 2013, the deadline falls soon after the end of the fiscal year, raising the prospect of a government shutdown on top of debt limit uncertainty. ~ Goldman Sachs, 2021
However, just like a hundred debt ceiling modifications before, we are very likely to reach agreement with very little stimulative intervention from the Treasury General Account. In my opinion there is no reason to see inflation increased by the “extraordinary measures” the Treasury will take to prioritize payment obligations over the coming months. 2023 will be the first year in U.S. history with a debt standoff during an aggressive QT program of rising rates and draining liquidity.
FinViz.com VMBreakouts.com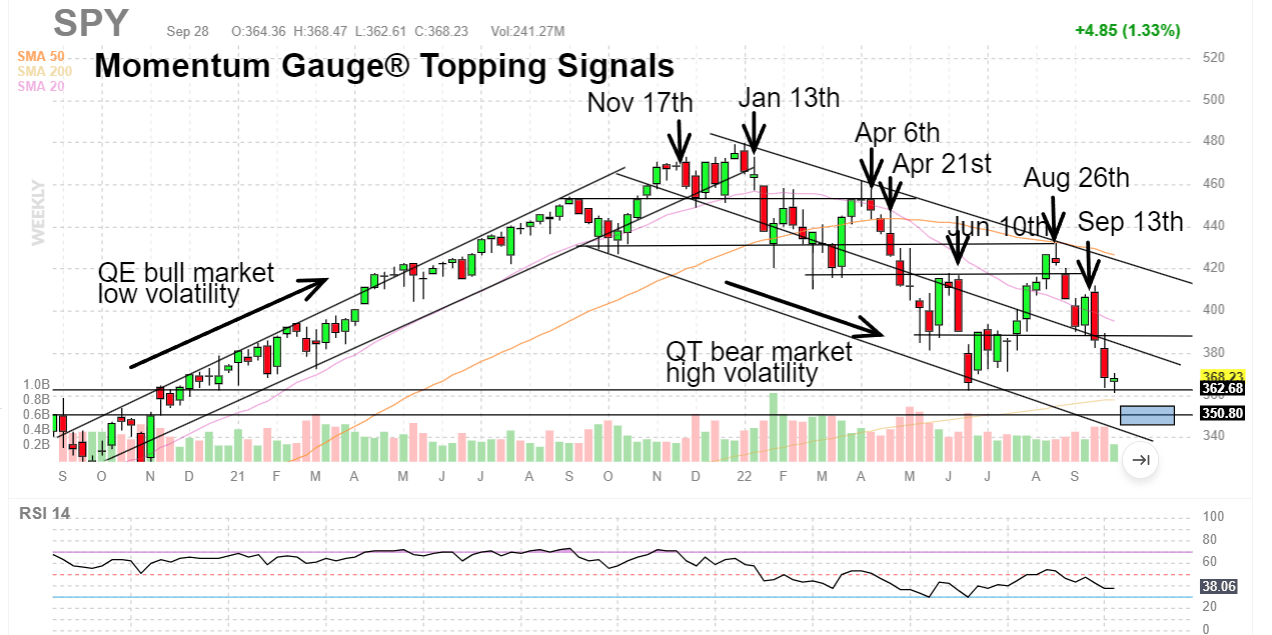
As the (SPY) chart illustrates, the largest concern I have is the increasing market volatility characteristic of all prior and ongoing QT activity. Now we may have to add increasing volatility created by impending deadlines for a debt ceiling agreement. I hope this quick review helps you better navigate the markets in the days ahead!
Have a great week of trading!
JD Henning, PhD, MBA, CFE, CAMS.
Be the first to comment