

Matt Pierce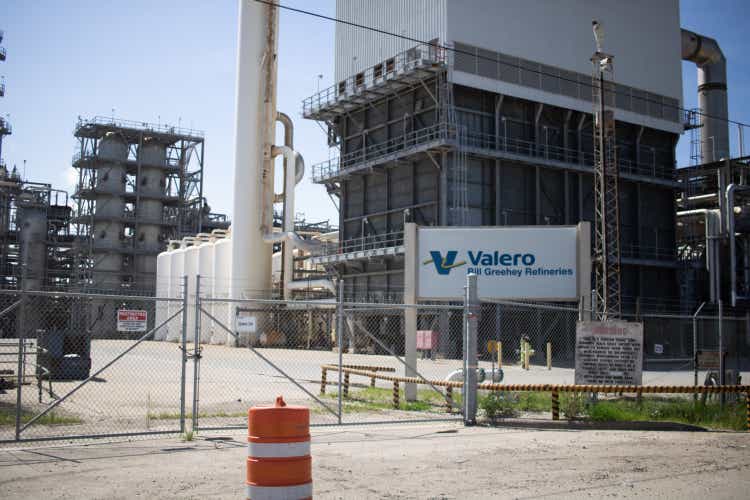
Major refining companies have come under scrutiny in recent months on soaring margins, and VLO is one example. In mid-June, President Biden wrote an open letter to oil companies stating that the exceedingly high margins were “not acceptable” because of the hardship of soaring gasoline prices on American families. The crux of the problem is that U.S. refinery capacity has been falling in recent years, with a decline of 1 million barrels a day since the start of the pandemic.
Seeking Alpha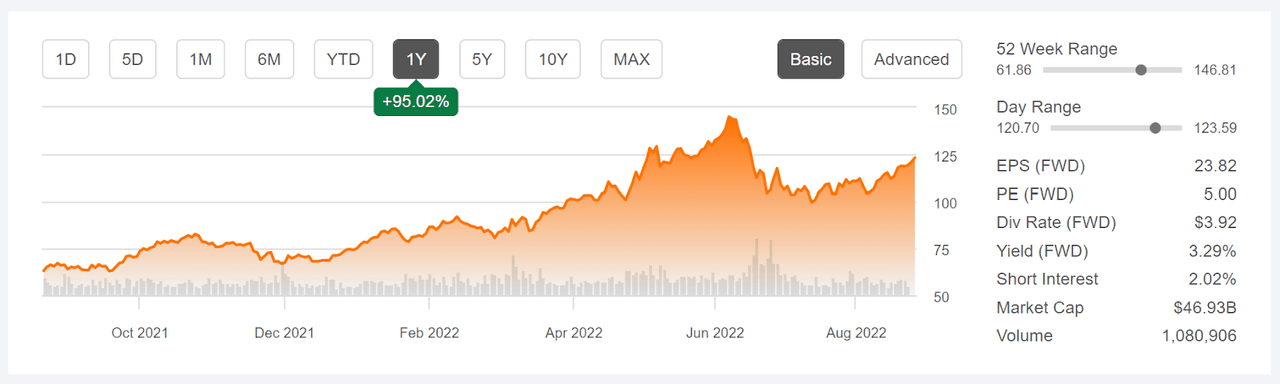
12-Month price history and basic statistics for VLO
VLO closed at the 12-month high of $145.08 on June 7th and subsequently declined rather rapidly, as gasoline prices have fallen. The U.S. average retail price of gasoline peaked at $5.11 on June 13th and has fallen fairly monotonically to reach the current price of $3.99. While the shares have risen substantially from their July lows, VLO is currently trading at $121.85, 16% below the 12-month high close. Even with this decline, VLO’s share price is 95% above where it was 12 months ago.
Looking at the quarterly earnings for VLO, it is not surprising that politicians are paying attention. VLO’s Q2 EPS, reported on July 28th, was vastly higher than for any quarter in recent years. The company’s refining margin was 4X higher than for the same time last year. Looking ahead, the consensus outlook is for earnings to revert to something closer to historical levels, but the next year is expected to be strong. One of the big questions is whether the government will move to implement a windfall tax, although the probability of this passing into law appears low.
ETrade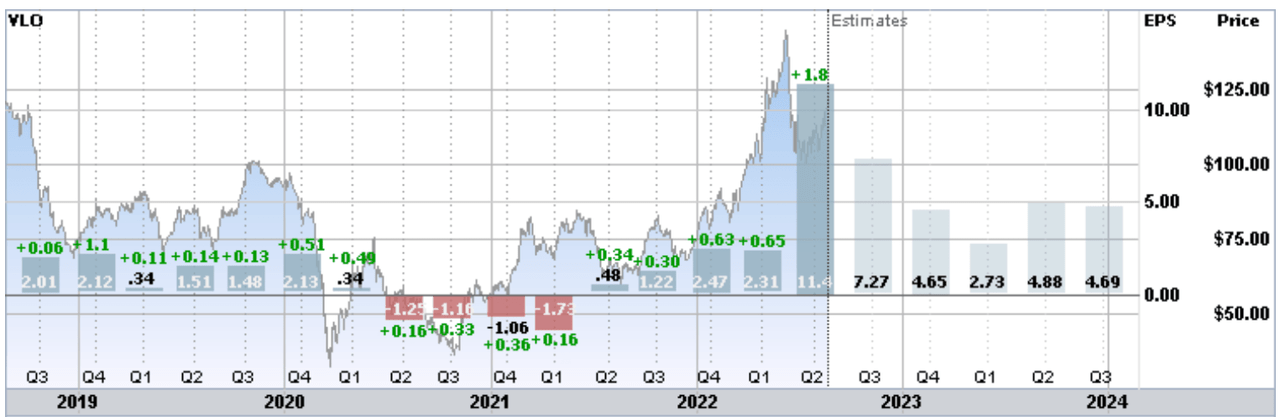
Historical (4 years) and estimated future quarterly EPS for VLO. Green (red) values are amounts by which EPS beat (missed) the consensus expected value
I last wrote about VLO on August 12, 2021, just over a year ago, and I assigned a buy / bullish rating. This was well before Russia started to invade Ukraine (February 24, 2022) and all of the subsequent turmoil in the petroleum market. At that time, the average retail price of gasoline in the U.S. was $3.27. VLO was trading cheaply, with a forward dividend yield of 5.86%. The Wall Street analyst consensus outlook was bullish, with broad agreement between the analysts that the shares were underpriced, and the 12-month consensus price target was about 34% above the share price at that time. Along with looking at the fundamentals and the Wall Street consensus, I also look at the consensus implied by the prices of options on a stock (the market-implied outlook). In mid-August, the market-implied outlook to early 2022 was neutral, with expected annualized volatility of 39%.
Seeking Alpha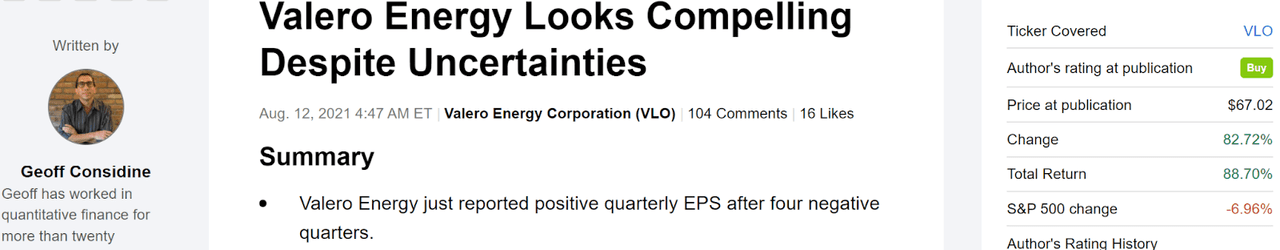
Previous post on VLO and subsequent performance vs. the S&P 500
As a rule of thumb for a buy rating, I want to see an expected 12-month return that is at least 50% of the expected annualized volatility. Taking the analyst consensus at face value, the expected 12-month total return (including the dividend) was very close to 100% of the expected volatility. Even giving the analyst outlook a substantial haircut, VLO would still meet the criterion for a buy. With the neutral market-implied outlook and the strongly bullish Wall Street consensus outlook, a buy rating was the obvious choice. I will be the first to admit, of course, that VLO’s huge rally is a result of a situation that neither I nor the market anticipated.
For readers who are unfamiliar with the market-implied outlook, a brief explanation is needed. The price of an option on a stock is largely determined by the market’s consensus estimate of the probability that the stock price will rise above (call option) or fall below (put option) a specific level (the option strike price) between now and when the option expires. By analyzing the prices of call and put options at a range of strike prices, all with the same expiration date, it is possible to calculate a probabilistic price forecast that reconciles the options prices. This is the market-implied outlook. For a deeper explanation and background, I recommend this monograph published by the CFA Institute.
With about a year since I last analyzed VLO, I have calculated an updated market-implied outlook and compared this with the current Wall Street consensus outlook in revisiting my rating.
Wall Street Consensus Outlook for VLO
ETrade calculates the Wall Street consensus outlook for VLO using ratings and price targets from 15 ranked analysts who have published their views over the past 3 months. The consensus rating on VLO continues to be a buy and the consensus 12-month price target is 17.2% above the current share price. While the consensus price target has risen substantially over the past year, the price has risen even faster, so that the price appreciation implied by the price target is less than ½ what it was a year ago.
ETrade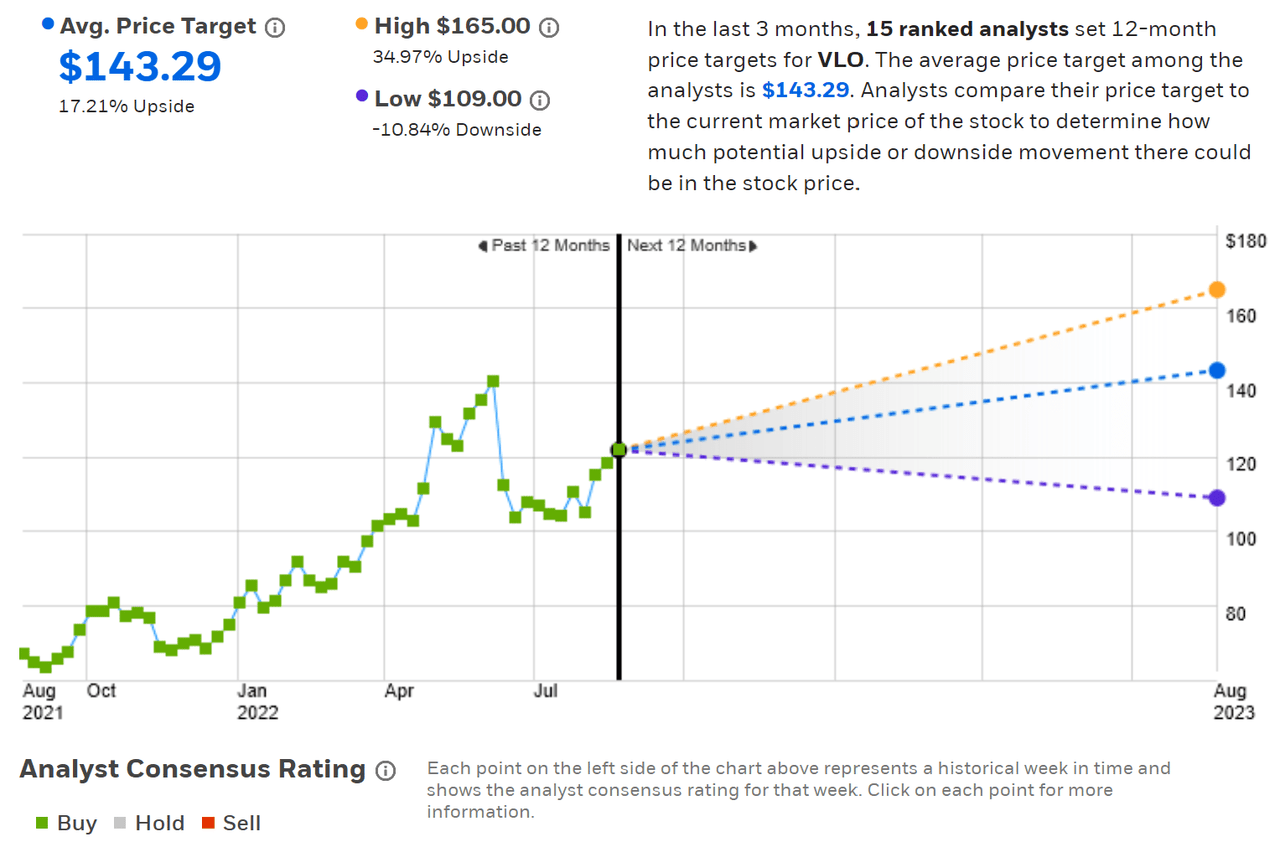
Wall Street analyst consensus rating and 12-month price target for VLO
Seeking Alpha’s version of the Wall Street consensus outlook is calculated using ratings and price targets issued over the past 3 months by 19 analysts. The consensus rating is a buy, and the consensus 12-month price target is 10% above the current share price.
Seeking Alpha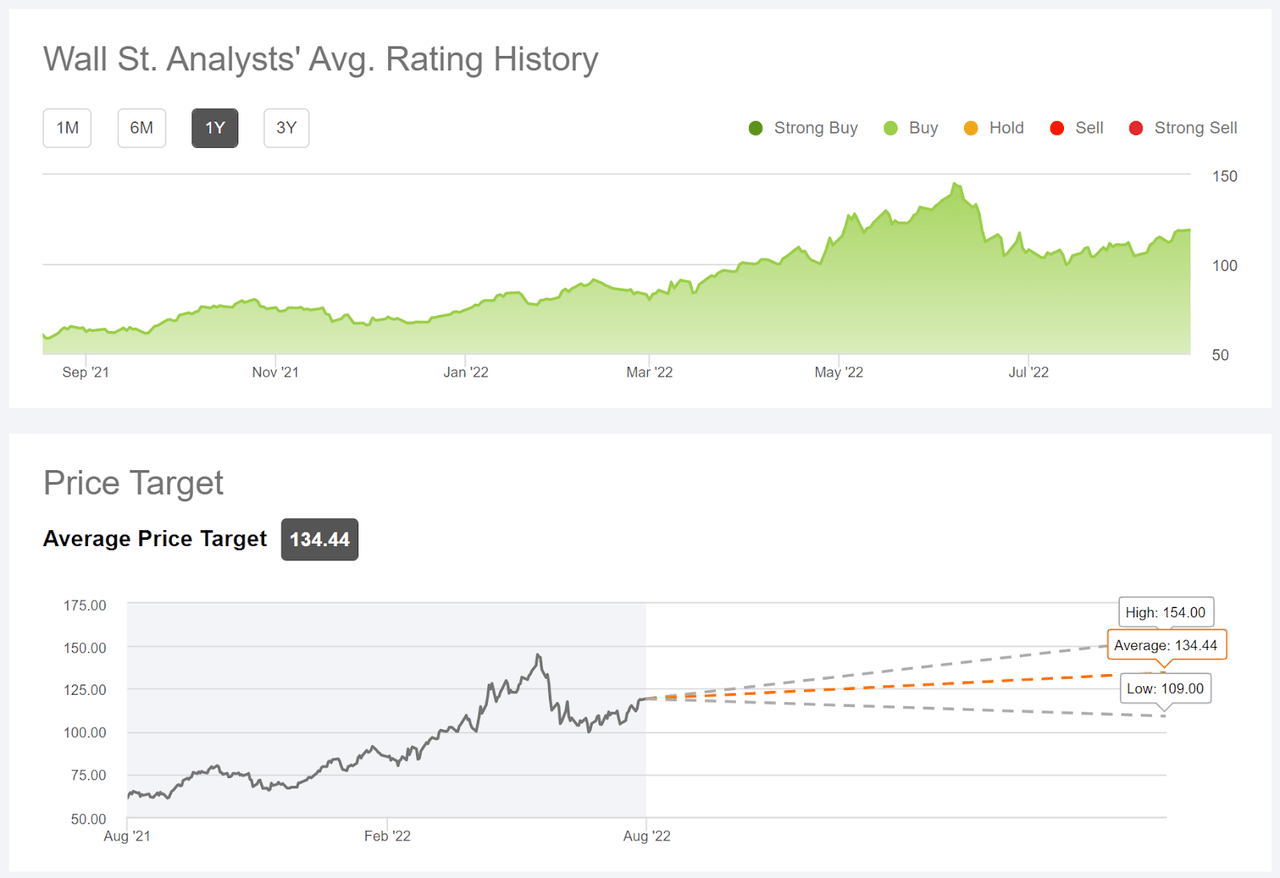
Wall Street analyst consensus rating and 12-month price target for VLO
While the Wall Street consensus rating is the same from ETrade and Seeking Alpha, the consensus 12-month price targets are materially different. ETrade’s consensus price target implies a 12-month total return (including the dividend) of 20.5% vs. 13.3% for the Seeking Alpha value. The main conclusion here is that the prevailing view among the analysts who follow VLO is that there is considerably less upside potential than there was a year ago.
Market-Implied Outlook for VLO
I have calculated the market-implied outlook for VLO for the 4.9-month period from now until January 20, 2023 and for the 16.9-month period from now until January 19, 2023, using the prices of call and put options that expire on these dates. I selected the January, 2023 expiration date to provide a view through the end of the year and because these options are quite actively traded. I also wanted to calculate an even longer-term market-implied outlook but the longer-dated options have much lower open interest and trading volume. The options expiring in March and June, the next 2 expiration dates, are especially light. The next-furthest expiration date is January 19, 2024 and these options had somewhat higher trading volumes and open interest, although still far less than the January 2023 options.
The standard presentation of the market-implied outlook is a probability distribution of price return, with probability on the vertical axis and return on the horizontal.
Geoff Considine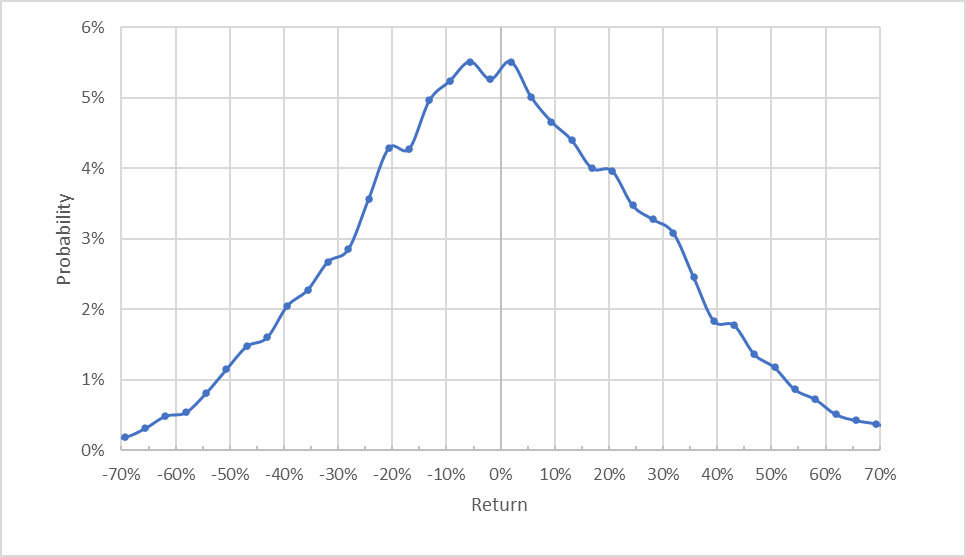
Market-implied price return probabilities for VLO for the 4.9-month period from now until January 20, 2023 (Source: Author’s calculations using options quotes from ETrade)
The market-implied outlook for the next 4.9 months is generally symmetric, with comparable probabilities of positive and negative returns of the same magnitude, although the peak in probabilities is very slightly tilted to favor negative returns. The expected volatility calculated from this distribution is 45.3% (annualized). This expected volatility is slightly higher than the value from a year ago, 39%.
To make it easier to compare the relative probabilities of positive and negative returns, I rotate the negative return side of the distribution about the vertical axis (see chart below).
Geoff Considine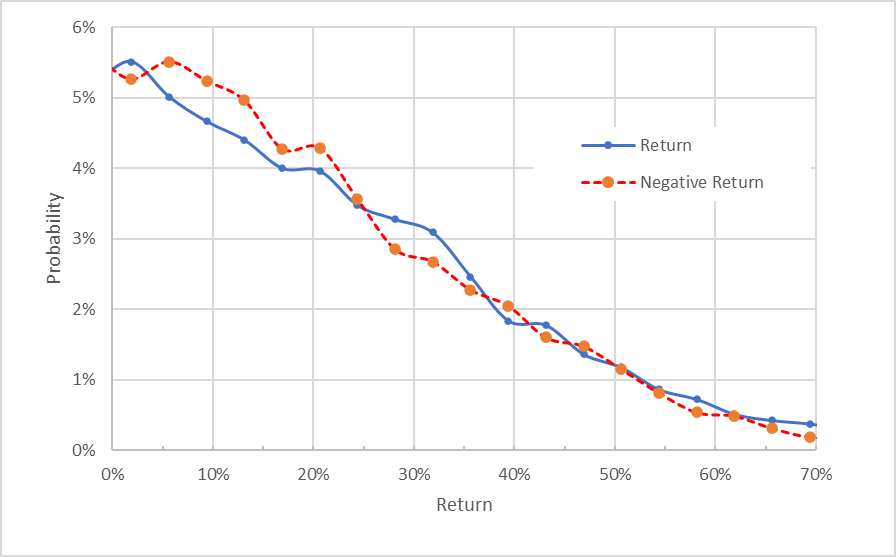
Market-implied price return probabilities for MU for the 4.9-month period from now until January 20, 2023. The negative return side of the distribution has been rotated about the vertical axis (Source: Author’s calculations using options quotes from ETrade)
This view shows just how closely the probabilities of positive and negative returns match up (the solid blue line and the dashed red line are very close to one another over most of the chart above). The probabilities of returns in the range +/-25% show a tilt favoring negative returns (the dashed red line is above the solid blue line over most of the left third of the chart above), but the probabilities of large-magnitude returns are very close.
Theory indicates that the market-implied outlook is expected to have a negative bias because investors, in aggregate, are risk averse and thus tend to pay more than fair value for downside protection. There is no way to measure the magnitude of this bias, or whether it is even present, however. Considering this potential bias, I interpret this market-implied outlook to be neutral with perhaps a slight bullish tilt.
I do not place much weight on the market-implied outlook to January 19, 2024, but I include it here for the reader’s consideration (see chart below). This outlook is solidly bearish, with substantially-elevated probabilities of negative returns as compared to the probabilities of positive returns of the same size (the dashed red line is well above the solid blue line over most of this chart). The expected volatility calculated from this distribution is 45.1% (annualized).
Geoff Considine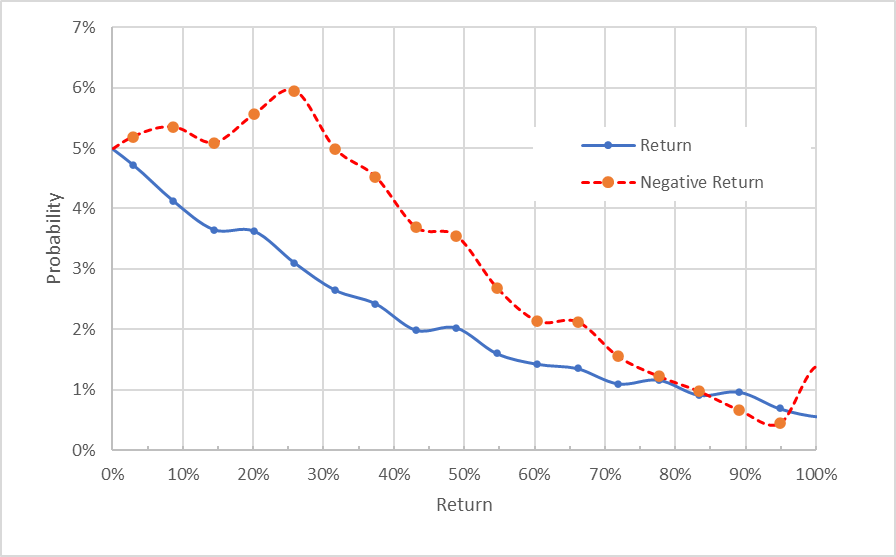
Market-implied price return probabilities for MU for the 16.9-month period from now until January 19, 2024. The negative return side of the distribution has been rotated about the vertical axis (Source: Author’s calculations using options quotes from ETrade)
The market-implied outlook into the start of 2023 is neutral, with a slight bullish tilt. This outlook is similar to the outlook for roughly the same period from my previous post, although the current outlook is slightly more bullish. The expected volatility, about 45%, is quite high for an individual stock but only slightly higher than the projected volatility from a year ago. For context, VLO’s actual volatility over the past year, calculated using PortfolioVisualizer, is about 39%. The market-implied outlook to January of 2024 is solidly bearish, but I am discounting this outlook because of the low option trading volume.
Summary
Valero has had an historically-good year, with soaring refining margins. The challenge for investors is estimating the fraction of these elevated earnings that may persist into the coming quarters. The Wall Street consensus outlook has above-average earnings expected over the next year, albeit declining substantially from Q2’s blowout levels. The Wall Street consensus rating continues to be bullish, with a consensus 12-month price target that implies an expected total return in the range of 13% to 20%. With an expected annualized volatility of 45%, the consensus expected return does not quite reach my threshold for a buy (expected return of at least ½ the expected annualized volatility). The market-implied outlook into the start of 2023 is neutral, with a slight bullish tilt. The outlook to the start of 2024 is bearish, but I put little weight on this result. While the outlook is substantially less bullish than it was a year ago, I am maintaining my bullish / buy rating on VLO for the time being, but I plan to revisit this analysis around the end of 2022.
Be the first to comment