

Rob_Ellis/E+ via Getty Images
Introduction
1 – 3Q22 results Snapshot
A little bit of history. Valaris Limited (NYSE:VAL) and certain direct and indirect subsidiaries filed on August 19, 2020, voluntary petitions for reorganization under Chapter 11 of the United States Bankruptcy Code.
On April 30, 2021, Valaris emerged from chapter 11 with a net cash position of $550 million, debt due in 2028. Shareholders were wiped out and got only worthless warrants.
On October 2022, Valaris Ltd. reported third-quarter 2022 results and provided a quarterly fleet status backlog of $2.7 billion, including ARO Drilling.
The Company released its third-quarter 2022 results on October 31, 2022.
VAL Presentation fleet 3Q22 (VAL Presentation)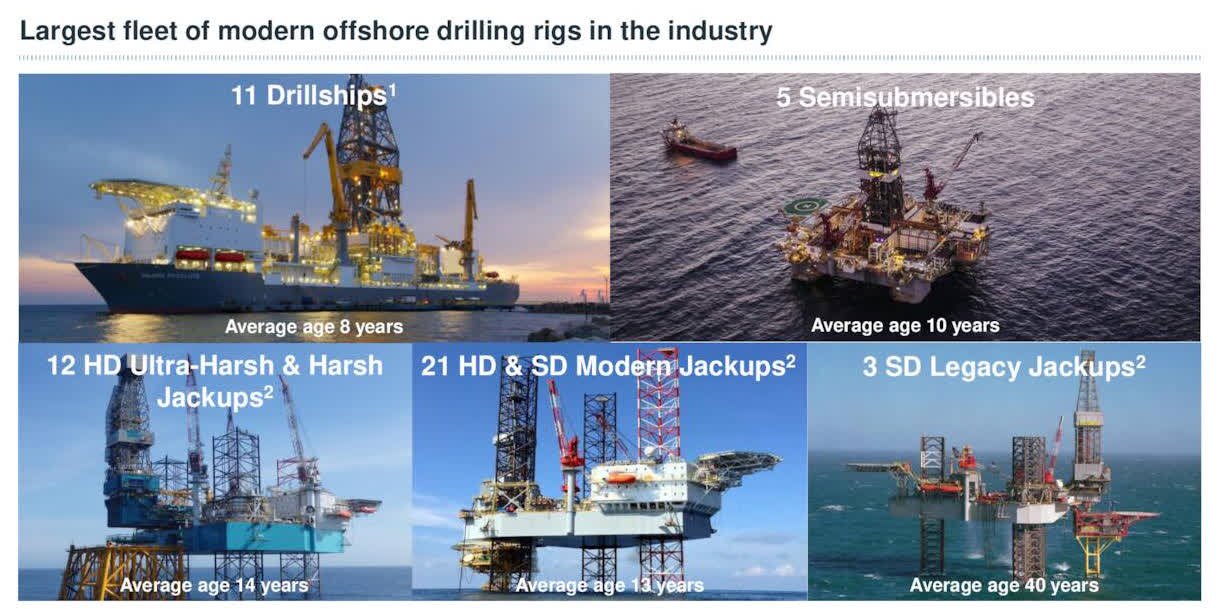
Note: This article is an update of my preceding article, published on February 22, 2022.
2 – Investment Thesis
VAL is slowly recovering, and the recent results are encouraging. However, I am not persuaded that this temporary relief created by an oil boom is sustainable for the long term, and I believe the best way to profit from VAL is to use it as a trading tool only.
The main issue I see that goes against a long-term investment is that the business model is severely flawed.
The offshore drilling business requires massive investment and costs, preventing the industry from generating any meaningful free cash flow. If we look at the average day rates for 2022, 2023, and 2024, it is clearly showing the issue, even if day rates have been increasing recently.
VAL Day rate increase (VAL Presentation)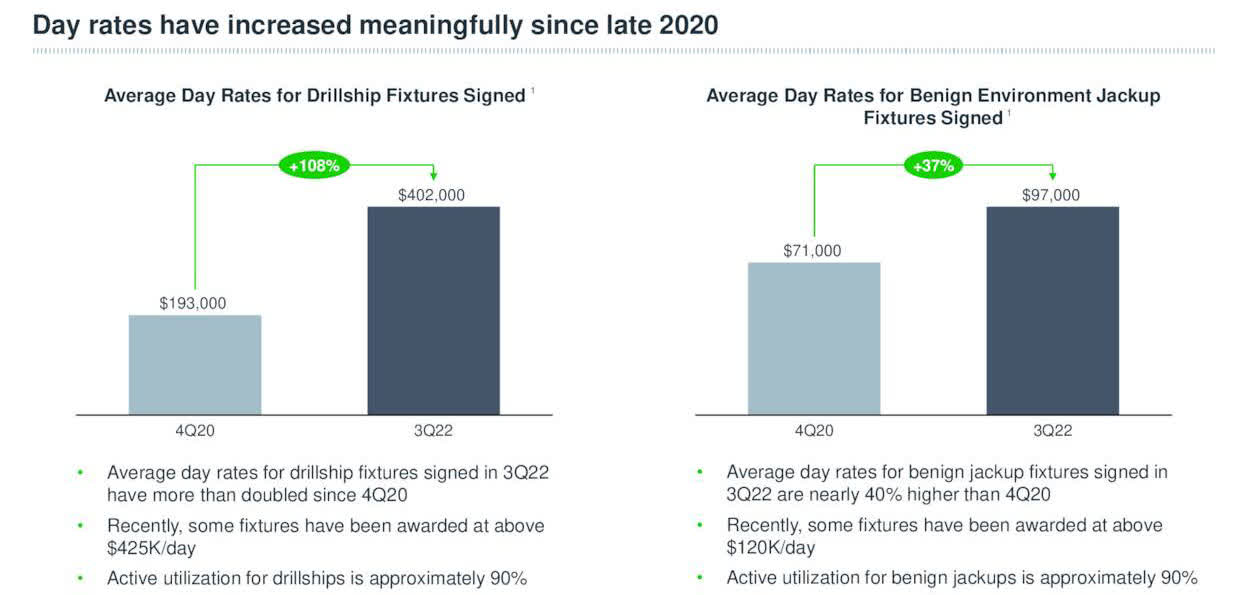
However, CEO Anton Dibowitz said in the conference call:
The increase in contracting and tendering activity has seen utilization for active drill ship sustained at around 90% for the past 12 months, which has led to meaningful improvements in day rates. Average day rates for drill ship fixtures signed in the third quarter 2022 were approximately $400,000 per day with some leading edge rates in certain regions above this level. As compared to less than 200,000 per day in the fourth quarter 2020, when active utilization was around 75%.
The average day rate for floaters is below $300K/d in 2024. Those numbers are from the most recent fleet status (October).
VAL average day rate 3Q22 (VAL fleet status)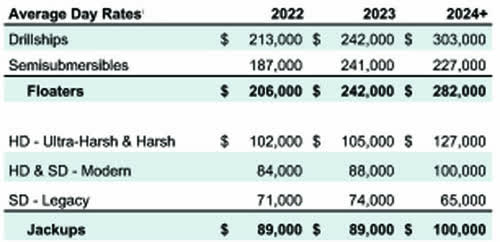
Furthermore, the Company is not likely to pay a dividend anytime soon, which contrasts with oil producers that pay an average of 2% to 4% and, in some cases, well over 5% if we look at the recent dividend (base dividend + variable cash dividend) announced by Diamondback Energy (FANG).
Thus, the short-term trading strategy is to trade LIFO your entire position and only keep a residual long-term investment hoping for a definitive turnaround.
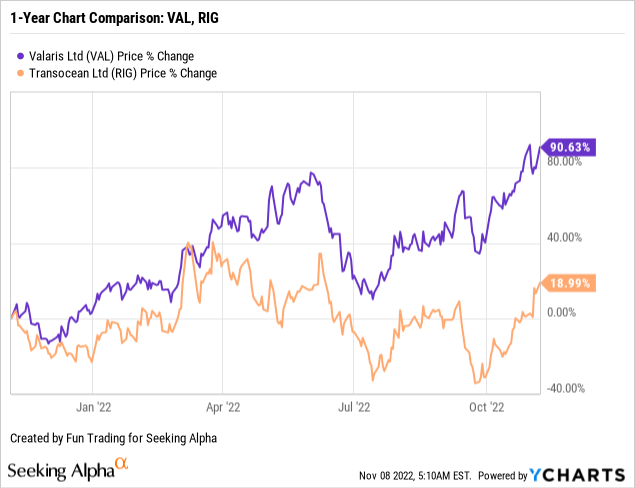
3 – Stock Performance
VAL has outperformed Transocean (RIG) in this industry on a one-year basis. VAL is now up 91%. However, this chart is a bit misleading if we consider that VAL filed for bankruptcy, and the stock fell into oblivion. At the same time, Transocean managed to survive a challenging environment and saved its shareholders from a nearly total loss.
Valaris Limited – 3Q22 and Balance Sheet History: The Raw Numbers
| Valaris | 3Q21 | 4Q21 | 1Q22 | 2Q22 | 3Q22 |
| Total Revenues in $ Million | 326.7 | 305.5 | 318.4 | 413.3 | 437.2 |
| Net Income in $ Million | -54.5 | 27.7 | -38.6 | 111.6 | 74.3 |
| EBITDA $ Million |
36.2 |
33.5 |
-4.9 |
163.7 |
120.4 |
| EPS diluted in $/share | -0.73 | 0.37 | -0.51 | 1.48 | 0.98 |
| Cash from Operating Activities in $ Million | 6.9 | -7.2 | 0.5 | -114.6 | 87.1 |
| Capital Expenditures in $ Million | 15.6 | 26.5 | 38.5 | 61.1 | 53.5 |
| Free Cash Flow in $ Million | -8.7 | -33.7 | -38.0 | -175.7 | 33.6 |
| Cash and Short-Term Investments $ million | 620.8 | 608.7 | 578.2 | 553.5 | 626.0 |
| LT Debt in $ million |
545.1 |
545.3 |
545.2 |
545.7 |
541.8 |
| Shares outstanding diluted in millions |
75.0 |
75.0 |
75.0 |
75.6 |
75.6 |
Note: Most of the data indicated above come from the press release
* Estimated by Fun Trading
Trends, Charts, and Commentary: Revenues, Free Cash Flow, and Upstream Production
1 – Quarterly Revenues of $437.2 million in 3Q22
VAL Quarterly revenues history (Fun Trading)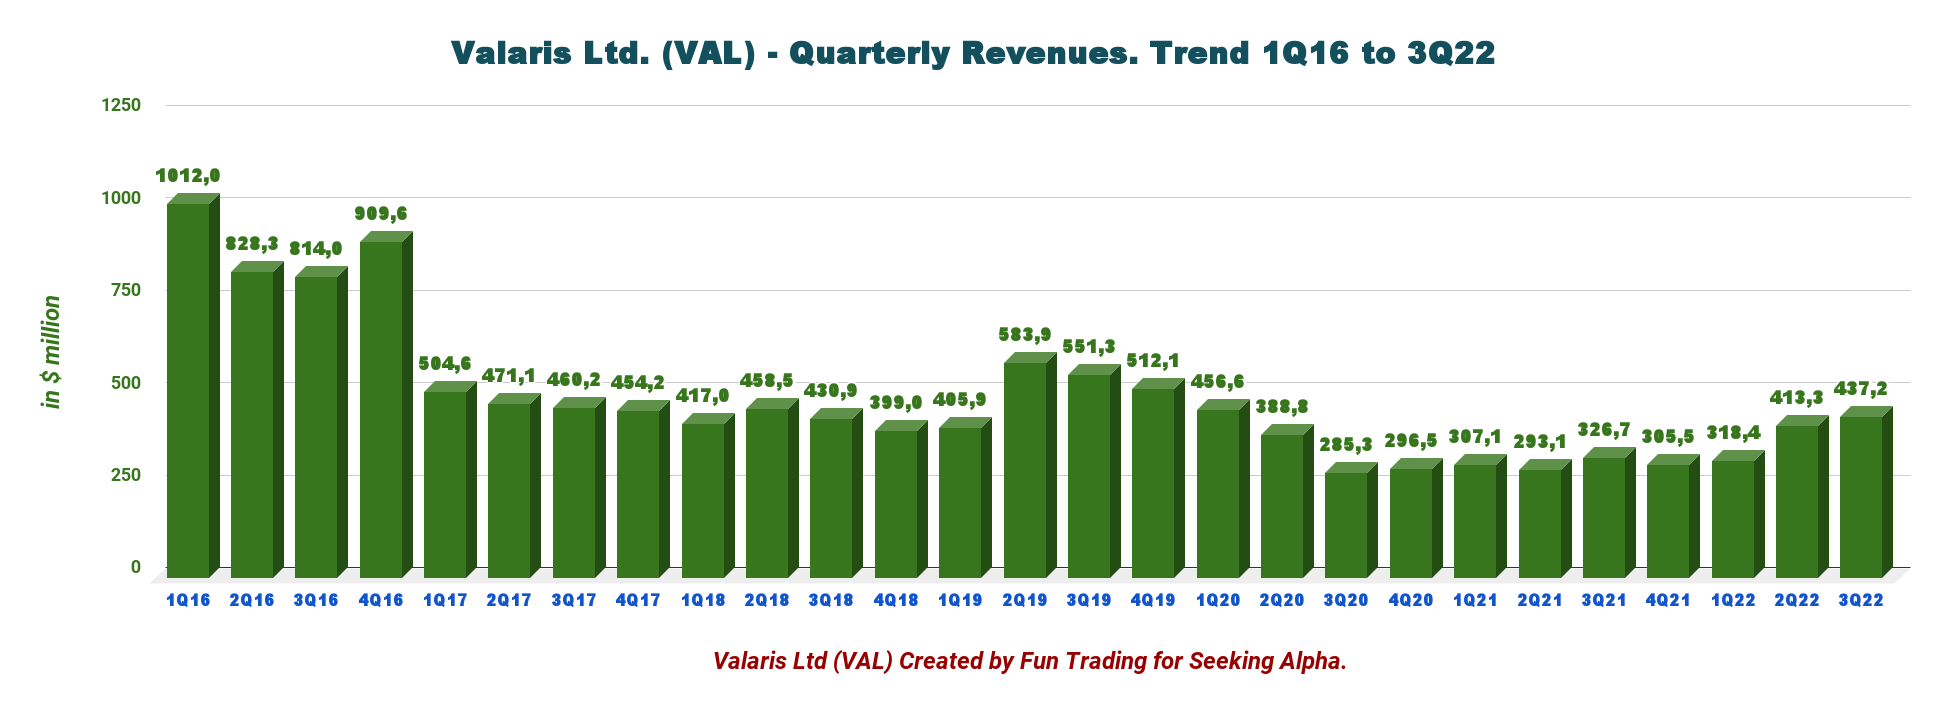
Total revenues increased to $437.2 million in 3Q22 from $326.7 million last year. Net income was $74.30 million or $0.98 per diluted share, up from a loss of $54.5 million or $0.73 per diluted share in 3Q21.
The increase in revenues was primarily due to higher utilization for floaters and higher average day rates for both the floater and jackup fleets. Partially offset by a $51 million termination fee related to the termination of a contract for VALARIS DS-11 recognized during the prior quarter.
Contract drilling expense was $337 million in 3Q22 compared to $362 million in the prior quarter.
The Company expects slightly lower revenue in 4Q22 and increased expenses overall. CFO Chris Weber said in the conference call:
Moving now to our fourth quarter 2022 outlook, we expect total revenues will be in the range of $420 million to $430 million as compared to $437 million in the third quarter. Revenues are expected to decrease primarily due to lower activity in the North Sea with our harsh environment jackup fleet.
Also, for the coming fourth quarter Chris Weber said in the conference call:
- We anticipate that contract drilling expenses will be in the range of $345 million to $355 million as compared to $337 million in the third quarter.
- Adjusted EBITDA is expected to be $50 million to $55 million compared to $76 million in the third quarter. And adjusted EBITDA is expected to be $65 million to $70 million compared to $94 million in the third quarter.
2 – Free Cash Flow was $33.6 million in 3Q22
VAL Quarterly Free cash flow history (Fun Trading)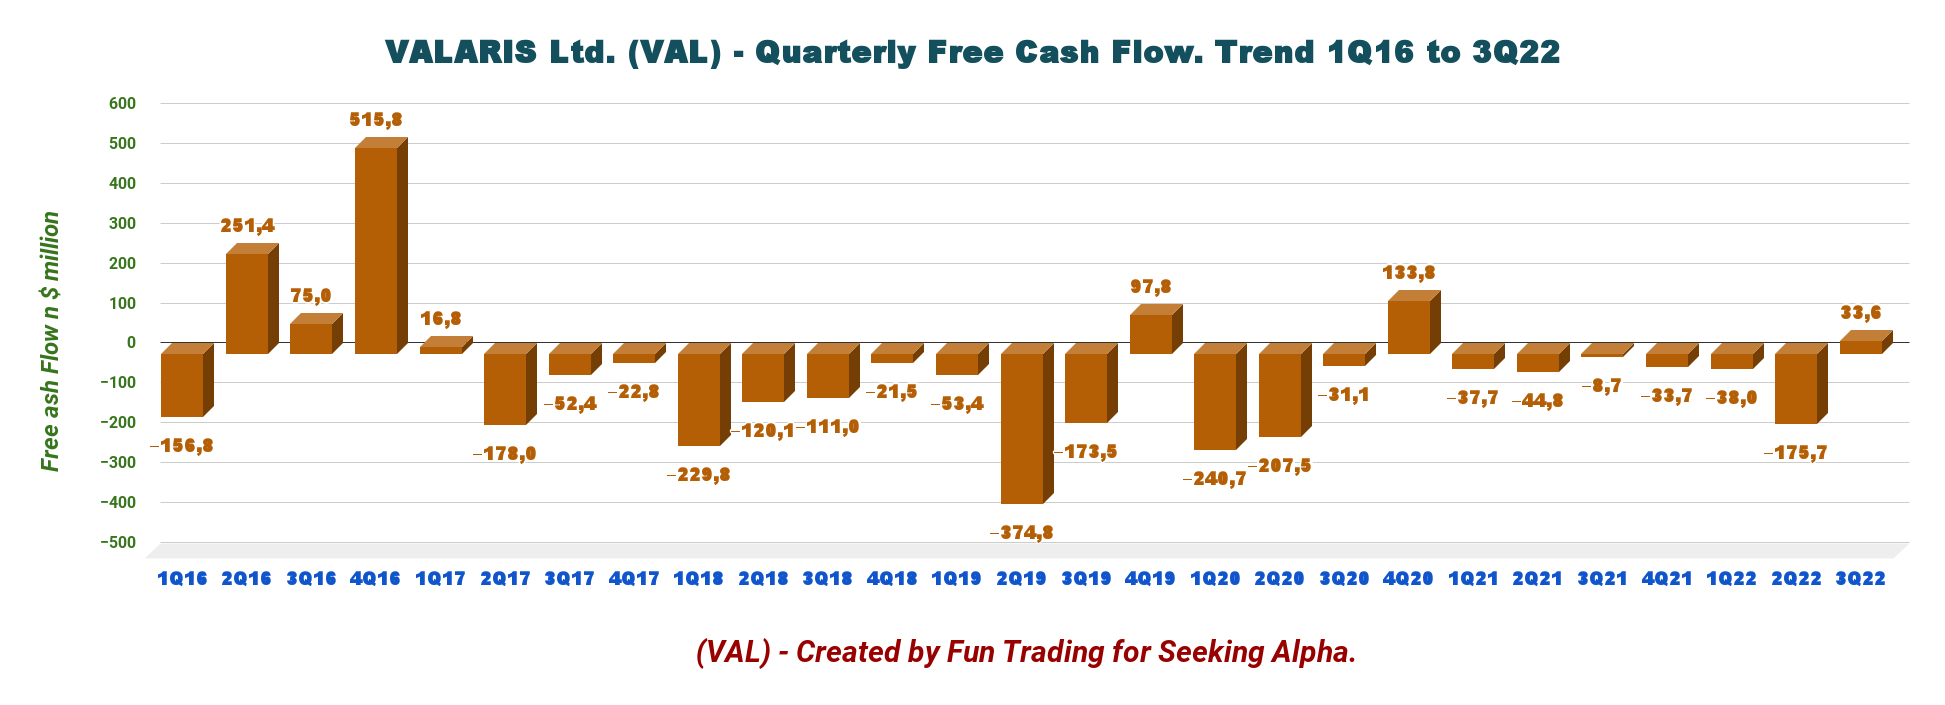
Cash flow from operations for 3Q22 was $87.1 million, and CapEx was $53.5 million.
Trailing 12-month Free cash flow is now a loss of $213.8 million, with a gain of $33.6 million in 3Q22. We can see some progress here but will it last long enough to make a difference?
On September 8, 2022, Valaris Ltd. announced that its Board of Directors had authorized a share repurchase program under which the Company may purchase up to $100 million of Valaris’ outstanding common stock.
I think it is the worst use of the cash that the Company could come up with, and I am still trying to understand how a struggling company can waste $100 million of its precious cash to buy back shares instead of cutting debt, increasing CapEx, or paying a small dividend.
3 – Fleet status and Backlog
VAL Fleet status details (VAL Fleet status 10/31/22)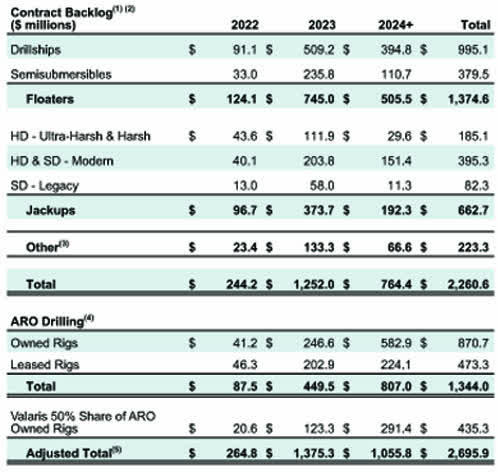
I have indicated the total backlog for the past few quarters, but we should look at the real backlog, which is the backlog, not including ARO.
The real backlog for the 3Q22 is now $2.26 billion (excluding ARO). It is still a noticeable progress from the low in 2020.
Note: VAL is contracting its ARO rigs on a bareboat charter agreement under its Saudi Arabian joint venture with Saudi Aramco. The “rent” is a fraction of the day rate, and the five-year SPS cost is not included. This situation is weakening the credibility of the backlog.
VAL Quarterly Fleet Status history (Fun Trading)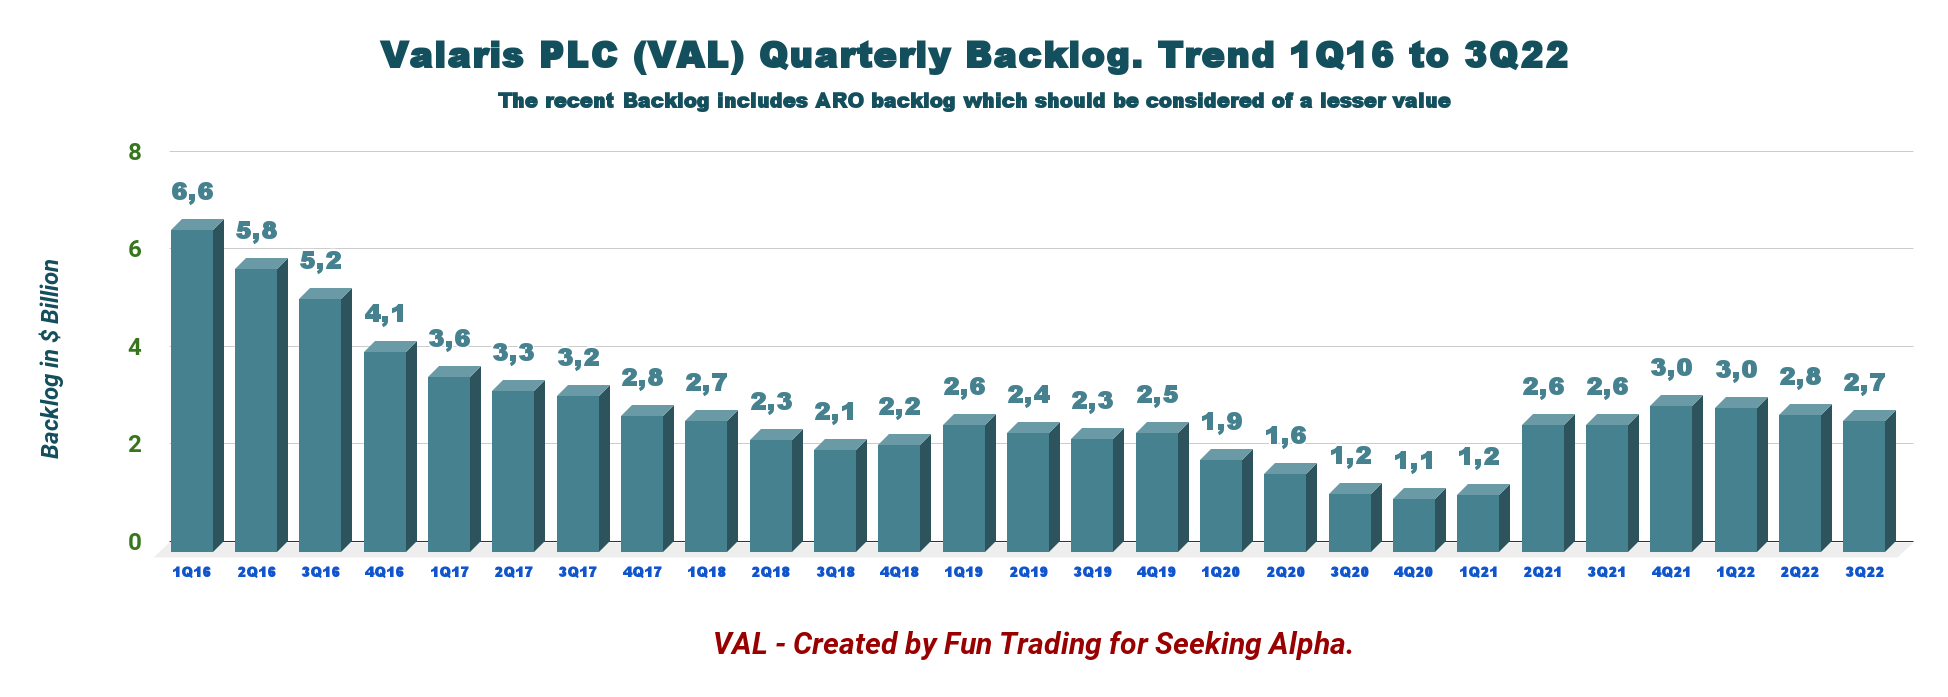
The Company announced several contracts during the 3Q22. Unfortunately, the Company failed to indicate the day rates attached to these contracts. The current backlog is $2.7 billion, including ARO. The current fleet status was not positive, with only $95 million in the added backlog. However,
This latest batch of contracts for Valaris rigs comes a month after the rig owner added $149 million to its contract backlog following new contracts and contract extension awards for one semi-submersible rig and three jack-up rigs.
To keep the backlog above $2 billion, the Company needs to generate over $400 million quarterly in added backlog; it is not what is happening.
4 – Debt and Cash on hand. A new clean start.
The Company is still net debt free and had a small progression in cash on hand this quarter.
VAL Quarterly Cash versus Debt history (Fun Trading)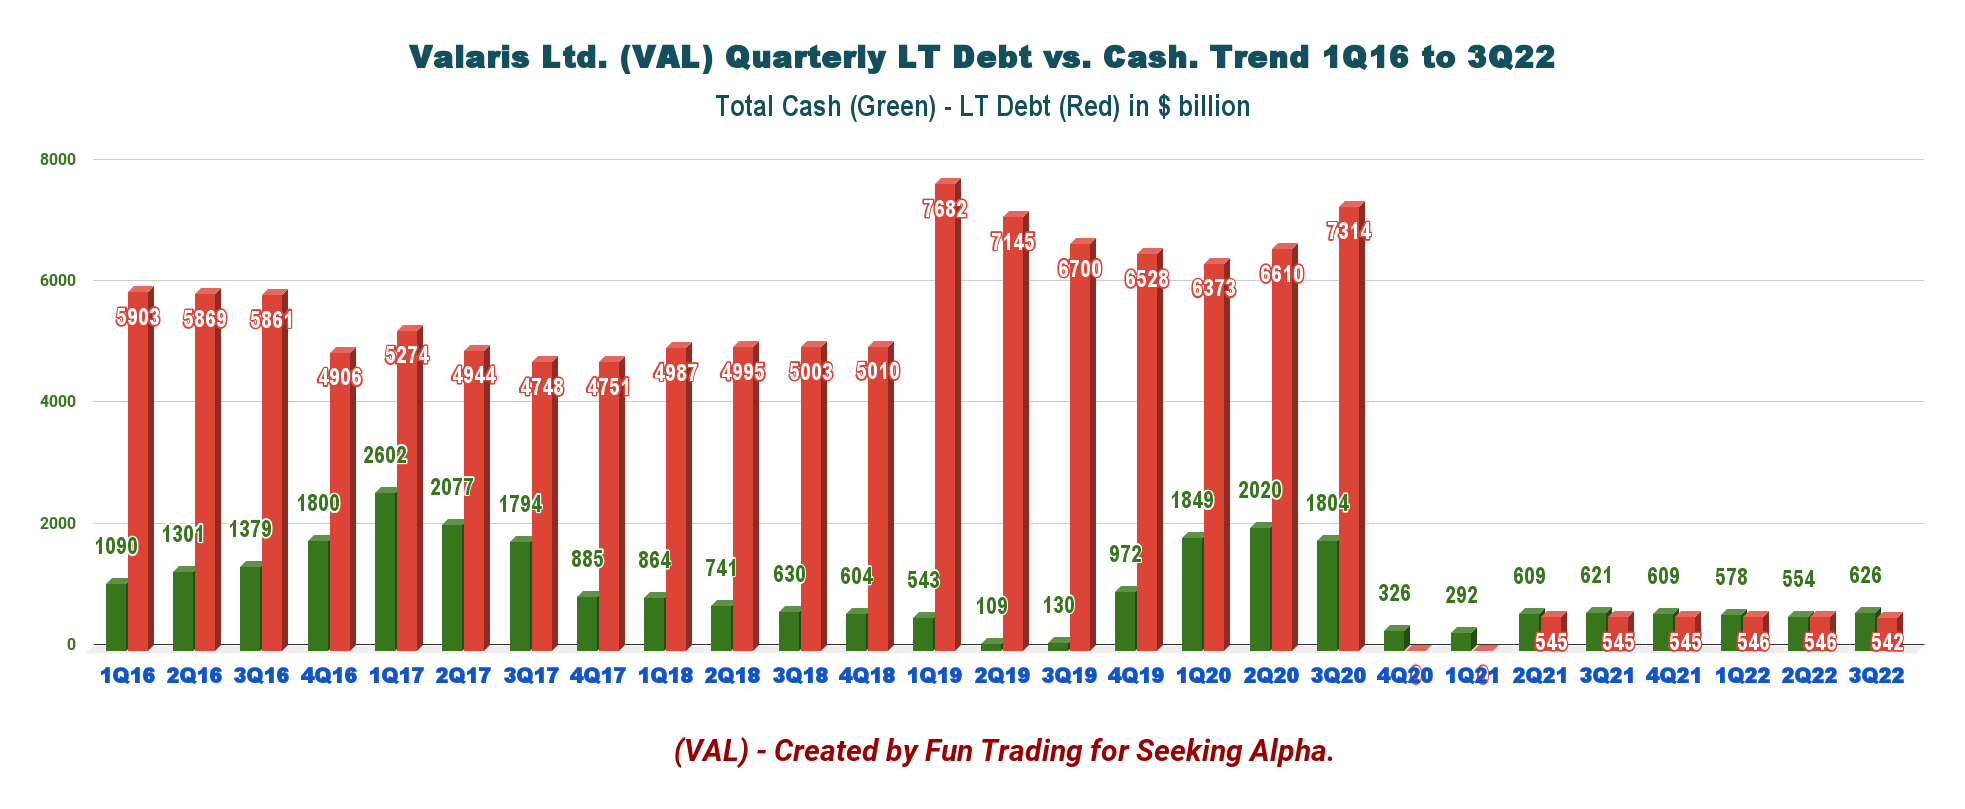
We can see the positive effect of the restructuring here. Total Cash is $626 million, and LT debt (including current) is $541.8 million. One positive element is that the Company has no newbuild CapEx commitments.
Still, VAL has options to take delivery of newbuild drillships VALARIS DS-13 and DS-14 by year-end 2023 for a shipyard price of approximately 119 million and 218 million, respectively.
VAL Balance sheet presentation (VAL Presentation)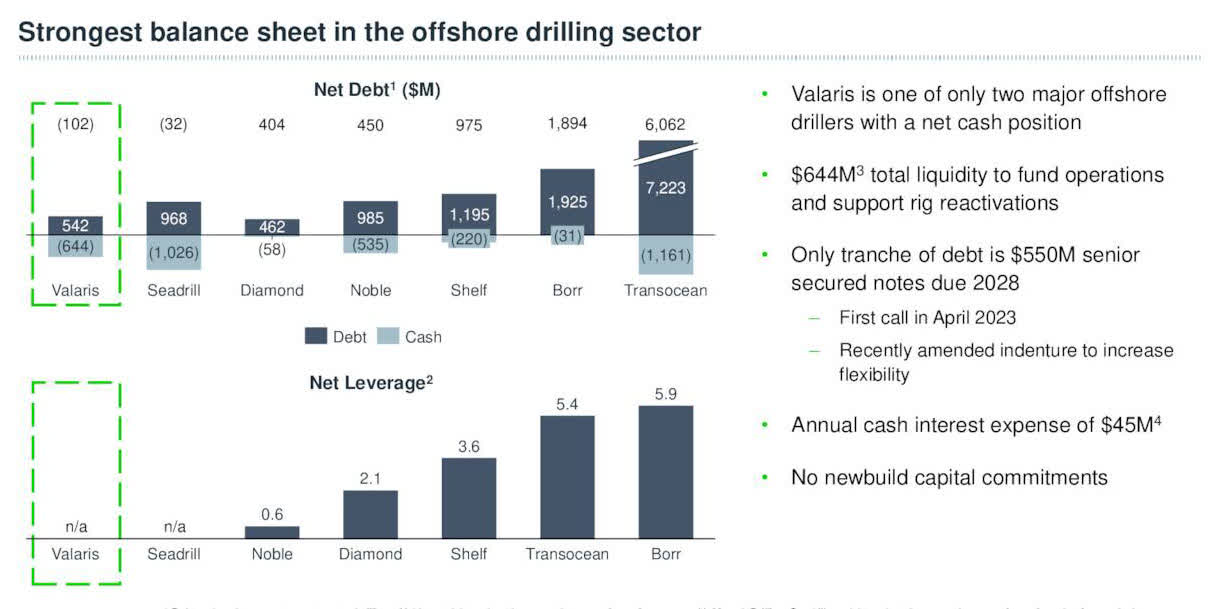
Technical Analysis and Commentary
VAL TA Chart short-term (Fun Trading StockCharts)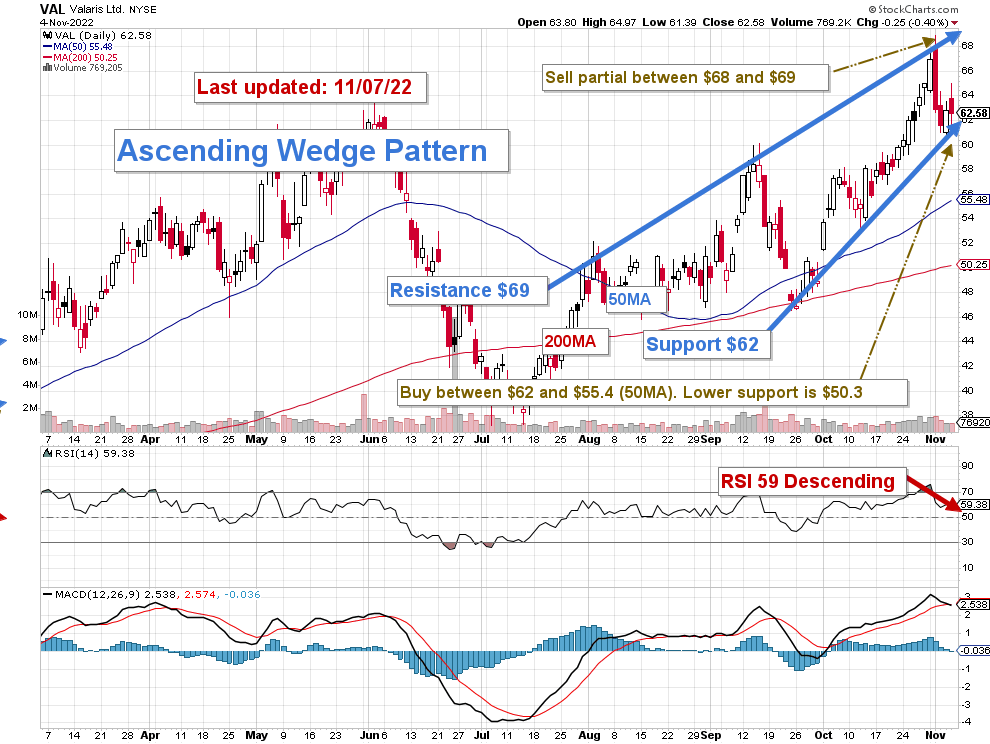
VAL forms an ascending wedge pattern with resistance at $69 and support at $62. The rising or ascending wedge pattern is a bearish chart pattern that signals an imminent breakout to the downside.
I recommend trading LIFO a large part of your position and keeping only a tiny mid-term position while hoping the world economy avoids a damaging recession in 2023, which is less evident after the recent Fed’s increase by 75-point in early November and the signal to another rise in December.
I recommend selling about 60% between $68 and $69 and waiting for a retracement at or below $62 to $55.4 to start accumulating cautiously again. If oil prices cannot continue their bullish rally, then I see possible lower support at $50.3 (200MA).
On the positive side, if oil prices get well over $100 per barrel, VAL could break out and reach the 80s, but it is improbable.
Note: The LIFO method is prohibited under International Financial Reporting Standards (IFRS), though it is permitted in the United States by Generally Accepted Accounting Principles (GAAP). Therefore, only US traders can apply this method. Those who cannot trade LIFO can use an alternative by setting two different accounts for the same stock, one for the long term and one for short-term trading.
Warning: The TA chart must be updated frequently to be relevant. It is what I am doing in my stock tracker. The chart above has a possible validity of about a week. Remember, the TA chart is a tool only to help you adopt the right strategy. It is not a way to foresee the future. No one and nothing can.
Author’s note: If you find value in this article and would like to encourage such continued efforts, please click the “Like” button below to vote of support. Thanks
Be the first to comment