


christiannafzger
One of the most unique businesses on the market today is a company called Vail Resorts (NYSE:MTN). For those not familiar with the company and for those who don’t initially understand the creativity of the company’s ticker symbol, the firm operates as an owner and operator of ski resorts and other related assets. This includes 41 owned and/or operated resorts across the US, Canada, and Australia. Recently, financial performance achieved by the company has been quite impressive. But naturally, a company like this is bound to experience significant amounts of seasonality. Despite this seasonality, the overall fundamentals of the company remain robust. But this picture can change on a dime, especially when you factor in the broader economic uncertainty that permeates our daily lives right now. All things considered, I would make the case that the company is not a value prospect at this time. But because of its robust fundamental performance in recent years and where shares are priced at the moment, I do believe that some upside potential certainly exists.
Robust performance as of late
The last time I wrote an article about Vail Resorts was back in early June of this year. In that article, I talked about the attractive financial performance the company had achieved leading up to that point. I also found the 2022 guidance provided by management to be promising. On top of this, a significant decline in the price of shares since I had previously written about the company in November of 2021 made me feel as though it offered some attractive upside, to the point where I was able to comfortably increase my rating on the company from a “hold” to a soft “buy.” Since then, the company has outperformed the broader market, but only marginally so. Certainly not enough to be statistically significant. While the S&P 500 is down 4.3%, shares of Vail Resorts have generated downside for investors of 3.5%.
Author – SEC EDGAR Data
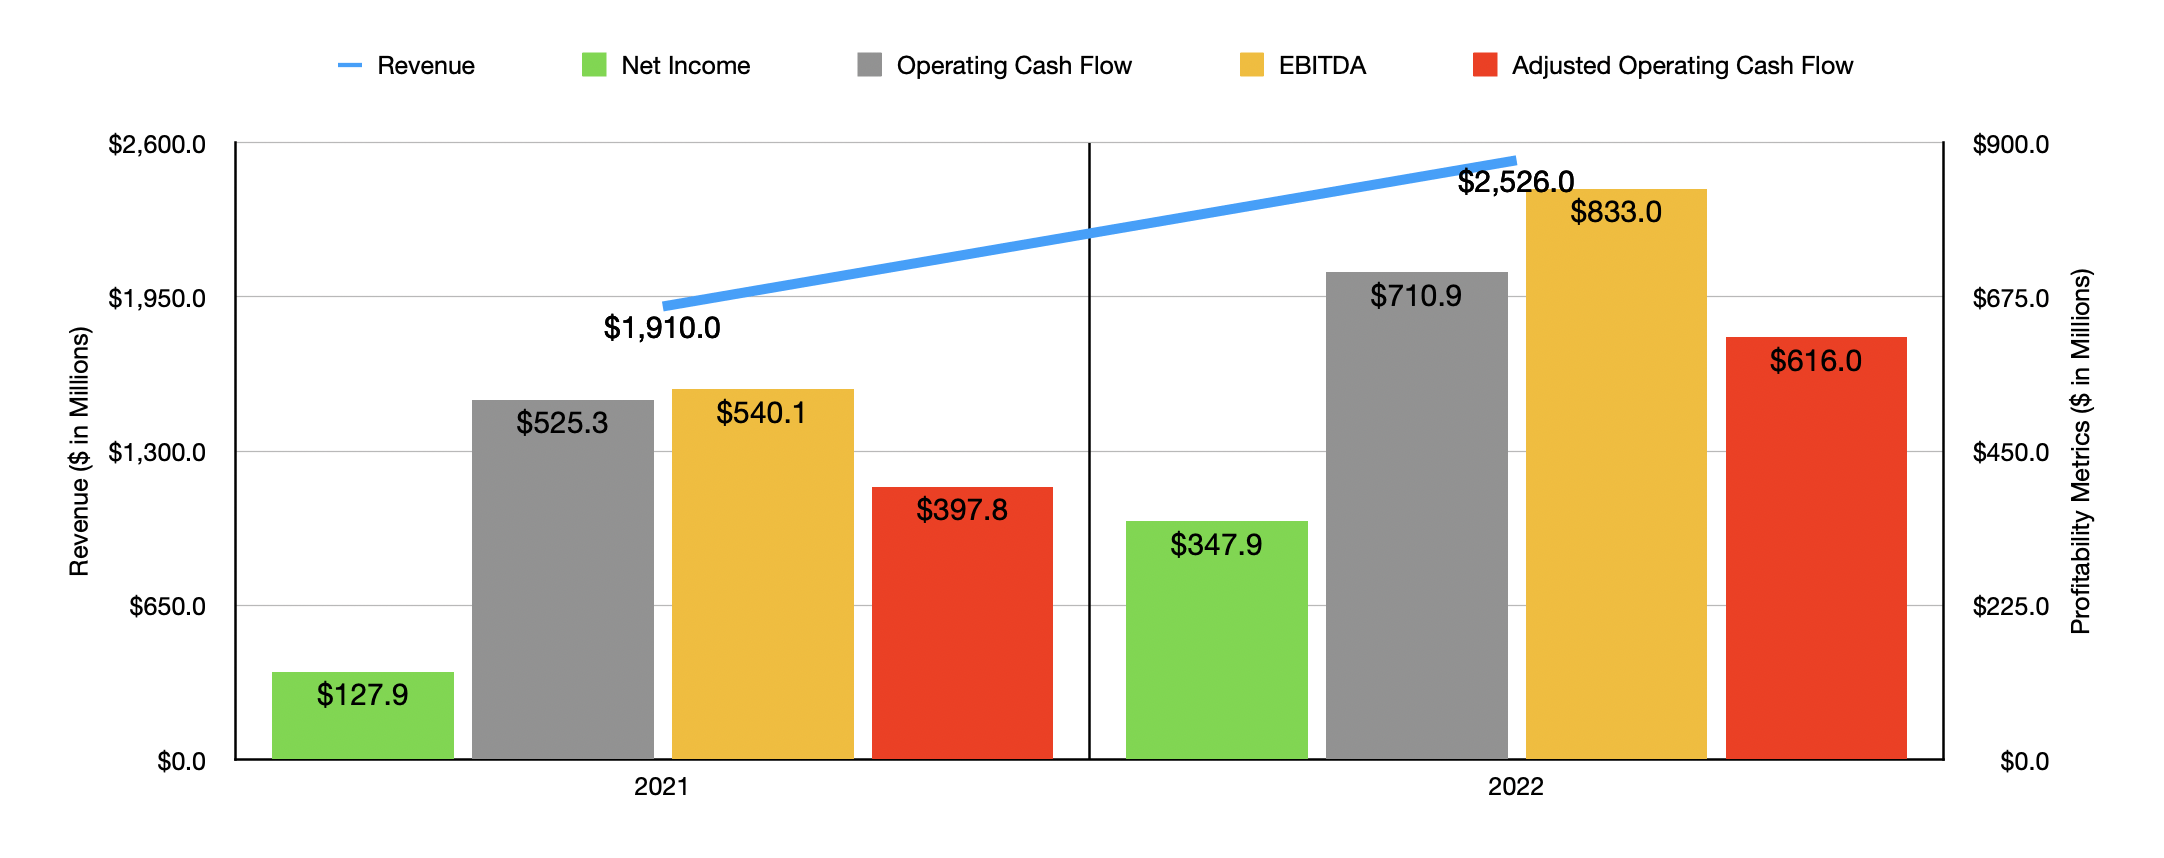
When I last wrote about the company, we only had data covering through the second quarter of the firm’s 2022 fiscal year. Fast forward to today, and we now have data covering through the end of 2022. For that year as a whole, sales came in at $2.53 billion. That’s 32.3% higher than the $1.91 billion generated only one year earlier. In absolute dollar terms, the largest contributor to this increase was the company’s Mountain segment. This is the largest of the company’s segments and it engages in the ownership and running of its world-class destination mountain resorts and regional ski areas. Activities here also include ancillary services like ski school, dining, and retail and rental operations.
From 2021 to 2022, revenue here jumped by 30%, climbing from $1.70 billion to $2.21 billion. All revenue categories fared well, with the company’s dining operations performing the best with revenue skyrocketing 77.6% from $92.2 million to $163.5 million. From a dollar perspective, the largest increase for this segment involved lift revenue, which jumped 21.7% because of an increase in past revenue and a rise in non-pass lift ticket purchases. In short, this all relates to additional guests visiting the company’s resorts. In addition, revenue under the Lodging segment of the company jumped by 52.1% year over year, climbing from $205.1 million to $312.1 million. This makes sense when you consider that increased visitation at the company’s resorts would also result in a greater likelihood of additional guests. Of course, the company also benefited from a rise in room-related revenue, with the ADR (average daily rate) climbing from $322.15 to $373.89. Higher pricing at the company’s hotels and condominiums was instrumental in pushing this up.
With revenue rising, profits easily followed suit. Net income jumped from $127.9 million in 2021 to $347.9 million last year. Of course, there are other profitability metrics that we should pay attention to. As an example, operating cash flow for the company shot up from $525.3 million to $710.9 million. If we adjust for changes in working capital, it would have risen from $397.8 million to $616 million. In addition to this, we also have EBITDA, a metric that grew from $540.1 million to $833 million in the course of a single year. Although these increases may seem absurd, it makes sense when you consider that any asset-intensive business with significant fixed costs should benefit from even small increases in revenue since the variable cost component associated with increased sales should be marginal by comparison.
Author – SEC EDGAR Data
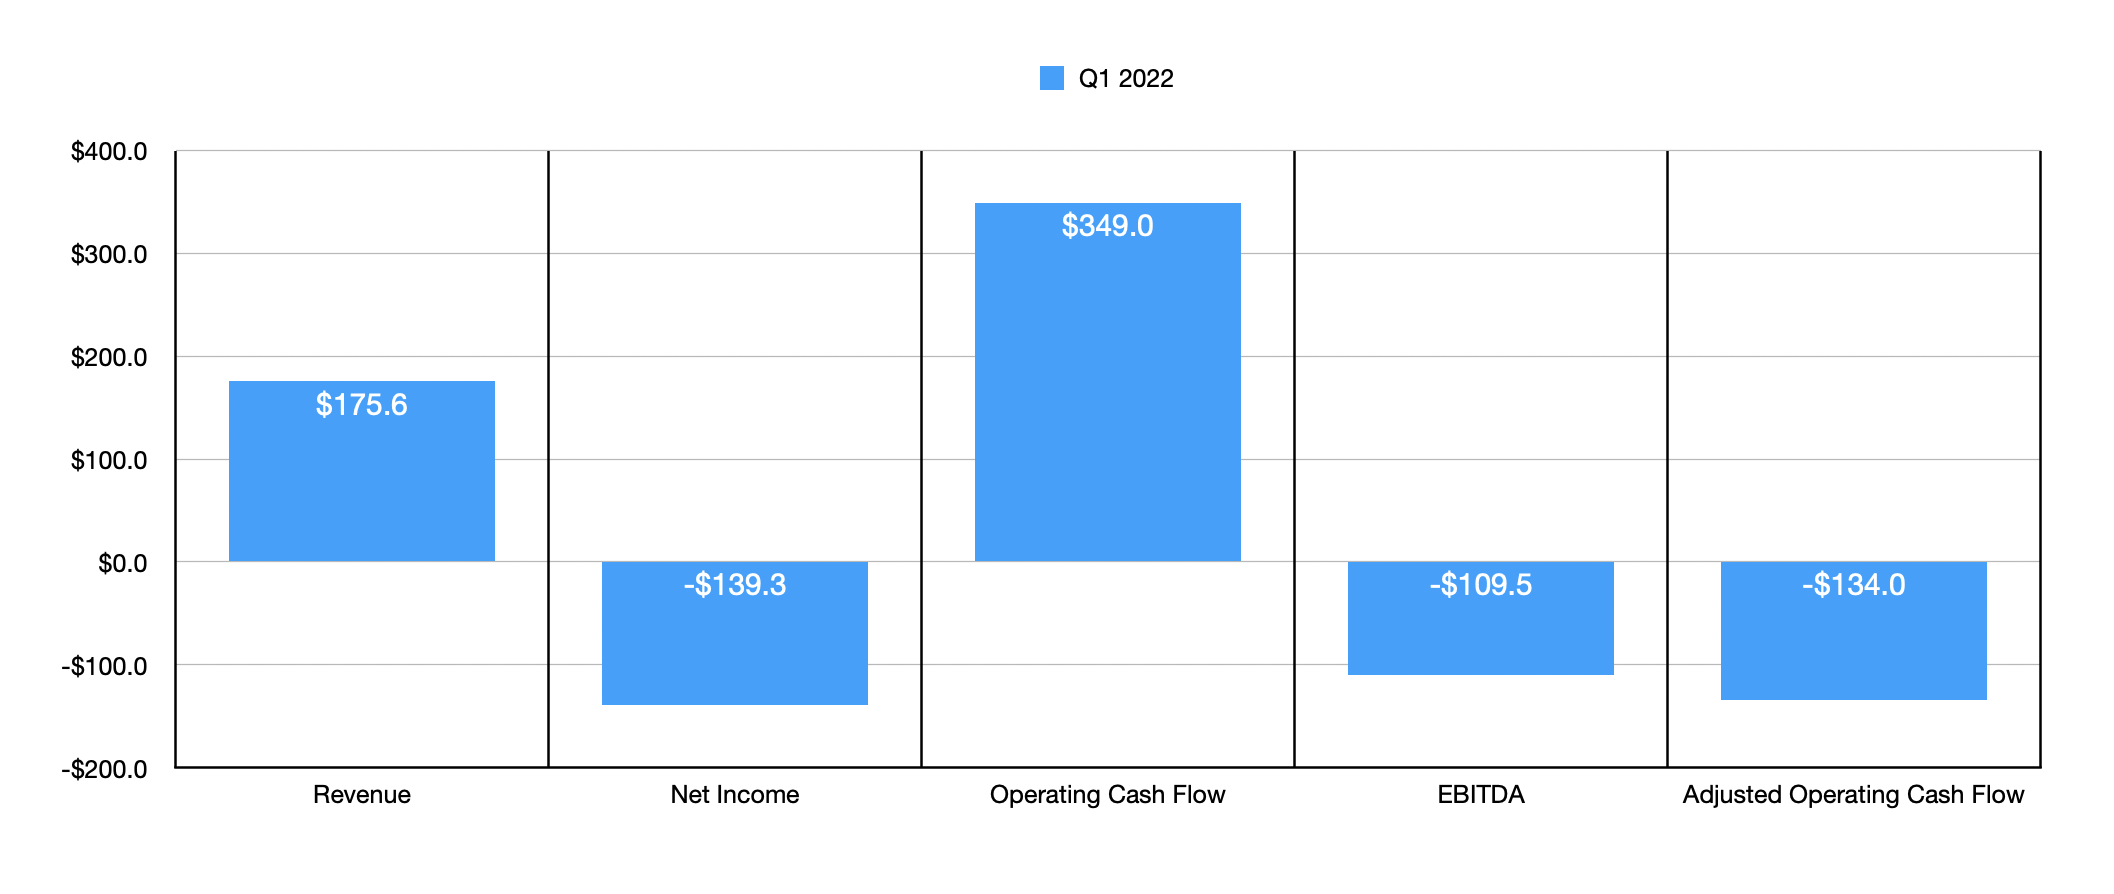
On Dec. 8, after the market closes, the management team at Vail Resorts will have the opportunity to demonstrate whether or not they can continue to improve their financial results or to show whether current economic conditions will dampen the company’s business prospects. This demonstration will come in the form of the company’s first quarter earnings release for its 2023 fiscal year. Leading up to that time, analysts have pretty high expectations from a revenue perspective. They currently believe that sales will come in at $255.5 million. Revenue is bound to be lower than what you might otherwise anticipate for the quarter because of the seasonality of this business. While this number looks small, it would represent a 45.5% increase over the $175.6 million the company reported the same time last year.
On the bottom line, things are slated to be rather difficult. Earnings per share are forecasted to be negative to the tune of $3.32. That would be only marginally better than the $3.44 loss per share experienced the same time last year. Last year, the company’s loss per share translated to a net loss of $139.3 million. Given the number of shares currently outstanding, the implied net loss if analysts are correct should be $135.1 million this time around. Investors should also pay attention to other profitability metrics. In the first quarter of last year, the company was cash flow positive to the tune of $349 million. But that was largely attributable to significant deferred revenue that came onto its books. If we adjust for changes in working capital, it would have been negative to the tune of $134 million. And over that same window of time, EBITDA turned negative in the amount of $109.5 million.
Vail Resorts
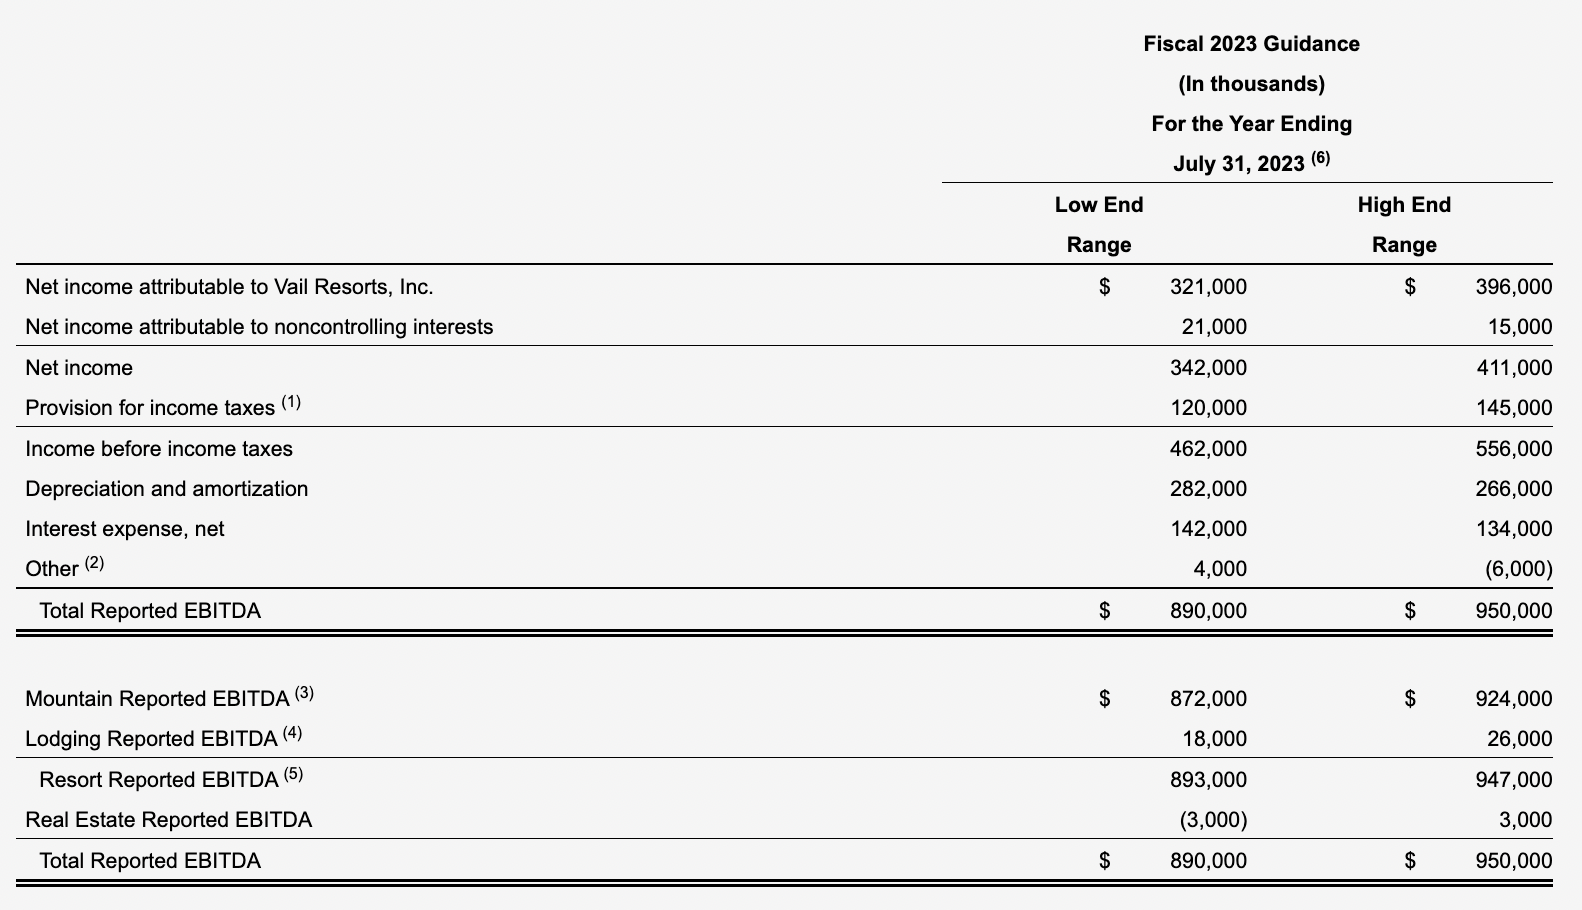
Although from a profitability perspective the first quarter this year may look disappointing, it’s important to also pay attention to what management is forecasting for 2023 as a whole. Their most recent guidance called for EBITDA of between $893 million and $947 million. They’re also forecasting net profits of between $321 million and $396 million. No guidance was given when it came to operating cash flow. But if we assume that it will increase at the same rate that EBITDA it’s forecasted to, we should anticipate a reading for the year of $680.3 million.

Author – SEC EDGAR Data
Based on these figures, the company would be trading at a forward price-to-earnings multiple of 28.8. The forward price to adjusted operating cash flow multiple would be 15.2, while the EV to EBITDA multiple would come in at 13.2. As you can see in the chart above, these are each a bit better than what the company is priced at using data from 2022. In terms of comparing the enterprise to other businesses, this becomes quite tricky. There aren’t any truly good companies to compare the firm to. The best approach, I figured, was to pick companies that have some similar characteristics to Vail Resorts. As you can see in the table below, I picked two theme park operators, two major hotel chains, and a fitness center. Using the data from 2022, I calculated that these companies are trading at price-to-earnings multiples of between 8.5 and 92.2. In this case, two of the five were cheaper than our prospect. Using the price to operating cash flow approach, the range was from 5.9 to 29.3. And using the EV to EBITDA approach, the range would be from 6.4 to 26.9. In both of these cases, two of the five were cheaper than our prospect.
| Company | Price / Earnings | Price / Operating Cash Flow | EV / EBITDA |
| Vail Resorts | 29.7 | 16.8 | 14.6 |
| Planet Fitness (PLNT) | 92.2 | 28.5 | 26.9 |
| Six Flags Entertainment (SIX) | 20.2 | 8.8 | 10.7 |
| Marriott International (MAR) | 24.7 | 22.6 | 17.7 |
| Hilton Worldwide Holdings (HLT) | 36.1 | 29.3 | 21.4 |
| Cedar Fair (FUN) | 8.5 | 5.9 | 6.4 |
Takeaway
Based on all the data we have at our disposal, it looks to me as though Vail Resorts is going to continue to grow year over year. While the first quarter is bound to be rough because of seasonal issues, it’s great to see the expectation that revenue should increase. Investors should obviously pay attention to what data is announced by management in their quarterly earnings release, especially what guidance should be for the rest of this year. But absent any big and unforeseen changes, I do think the company is priced at levels that still make it a soft “buy” at this time.
Be the first to comment