

Kativ
The world’s reserve currency is the U.S. dollar, the benchmark for pricing most commodities. A strong dollar tends to push commodity prices lower as they rise in other currency terms, and a weak dollar often supports gains in raw material prices. Moreover, U.S. multinational corporate profits tend to fall when the dollar rises as they find it more challenging to compete with foreign companies.
The U.S. dollar index measures the U.S. currency against other world reserve currencies. The euro comprises 57.6% of the dollar index, which also has exposure to the British pound, Japanese yen, Canadian dollar, Swedish krona, and Swiss franc.
The Invesco DB U.S. Dollar Index Bearish Fund (NYSEARCA:UDN) moves higher as the dollar index falls, and its bullish counterpart (UUP) rallies when the index moves higher.
The highest level in two-decades
In March 2022, the short-term Fed Funds Rate sat at zero to 25 basis points. The Fed’s aggressive hawkish monetary policy approach that took the rate to 3.75 to 4.00% over the past months and quantitative tightening that pushed rates higher further out along the yield curve caused the dollar index to rally to the highest level since 2002.
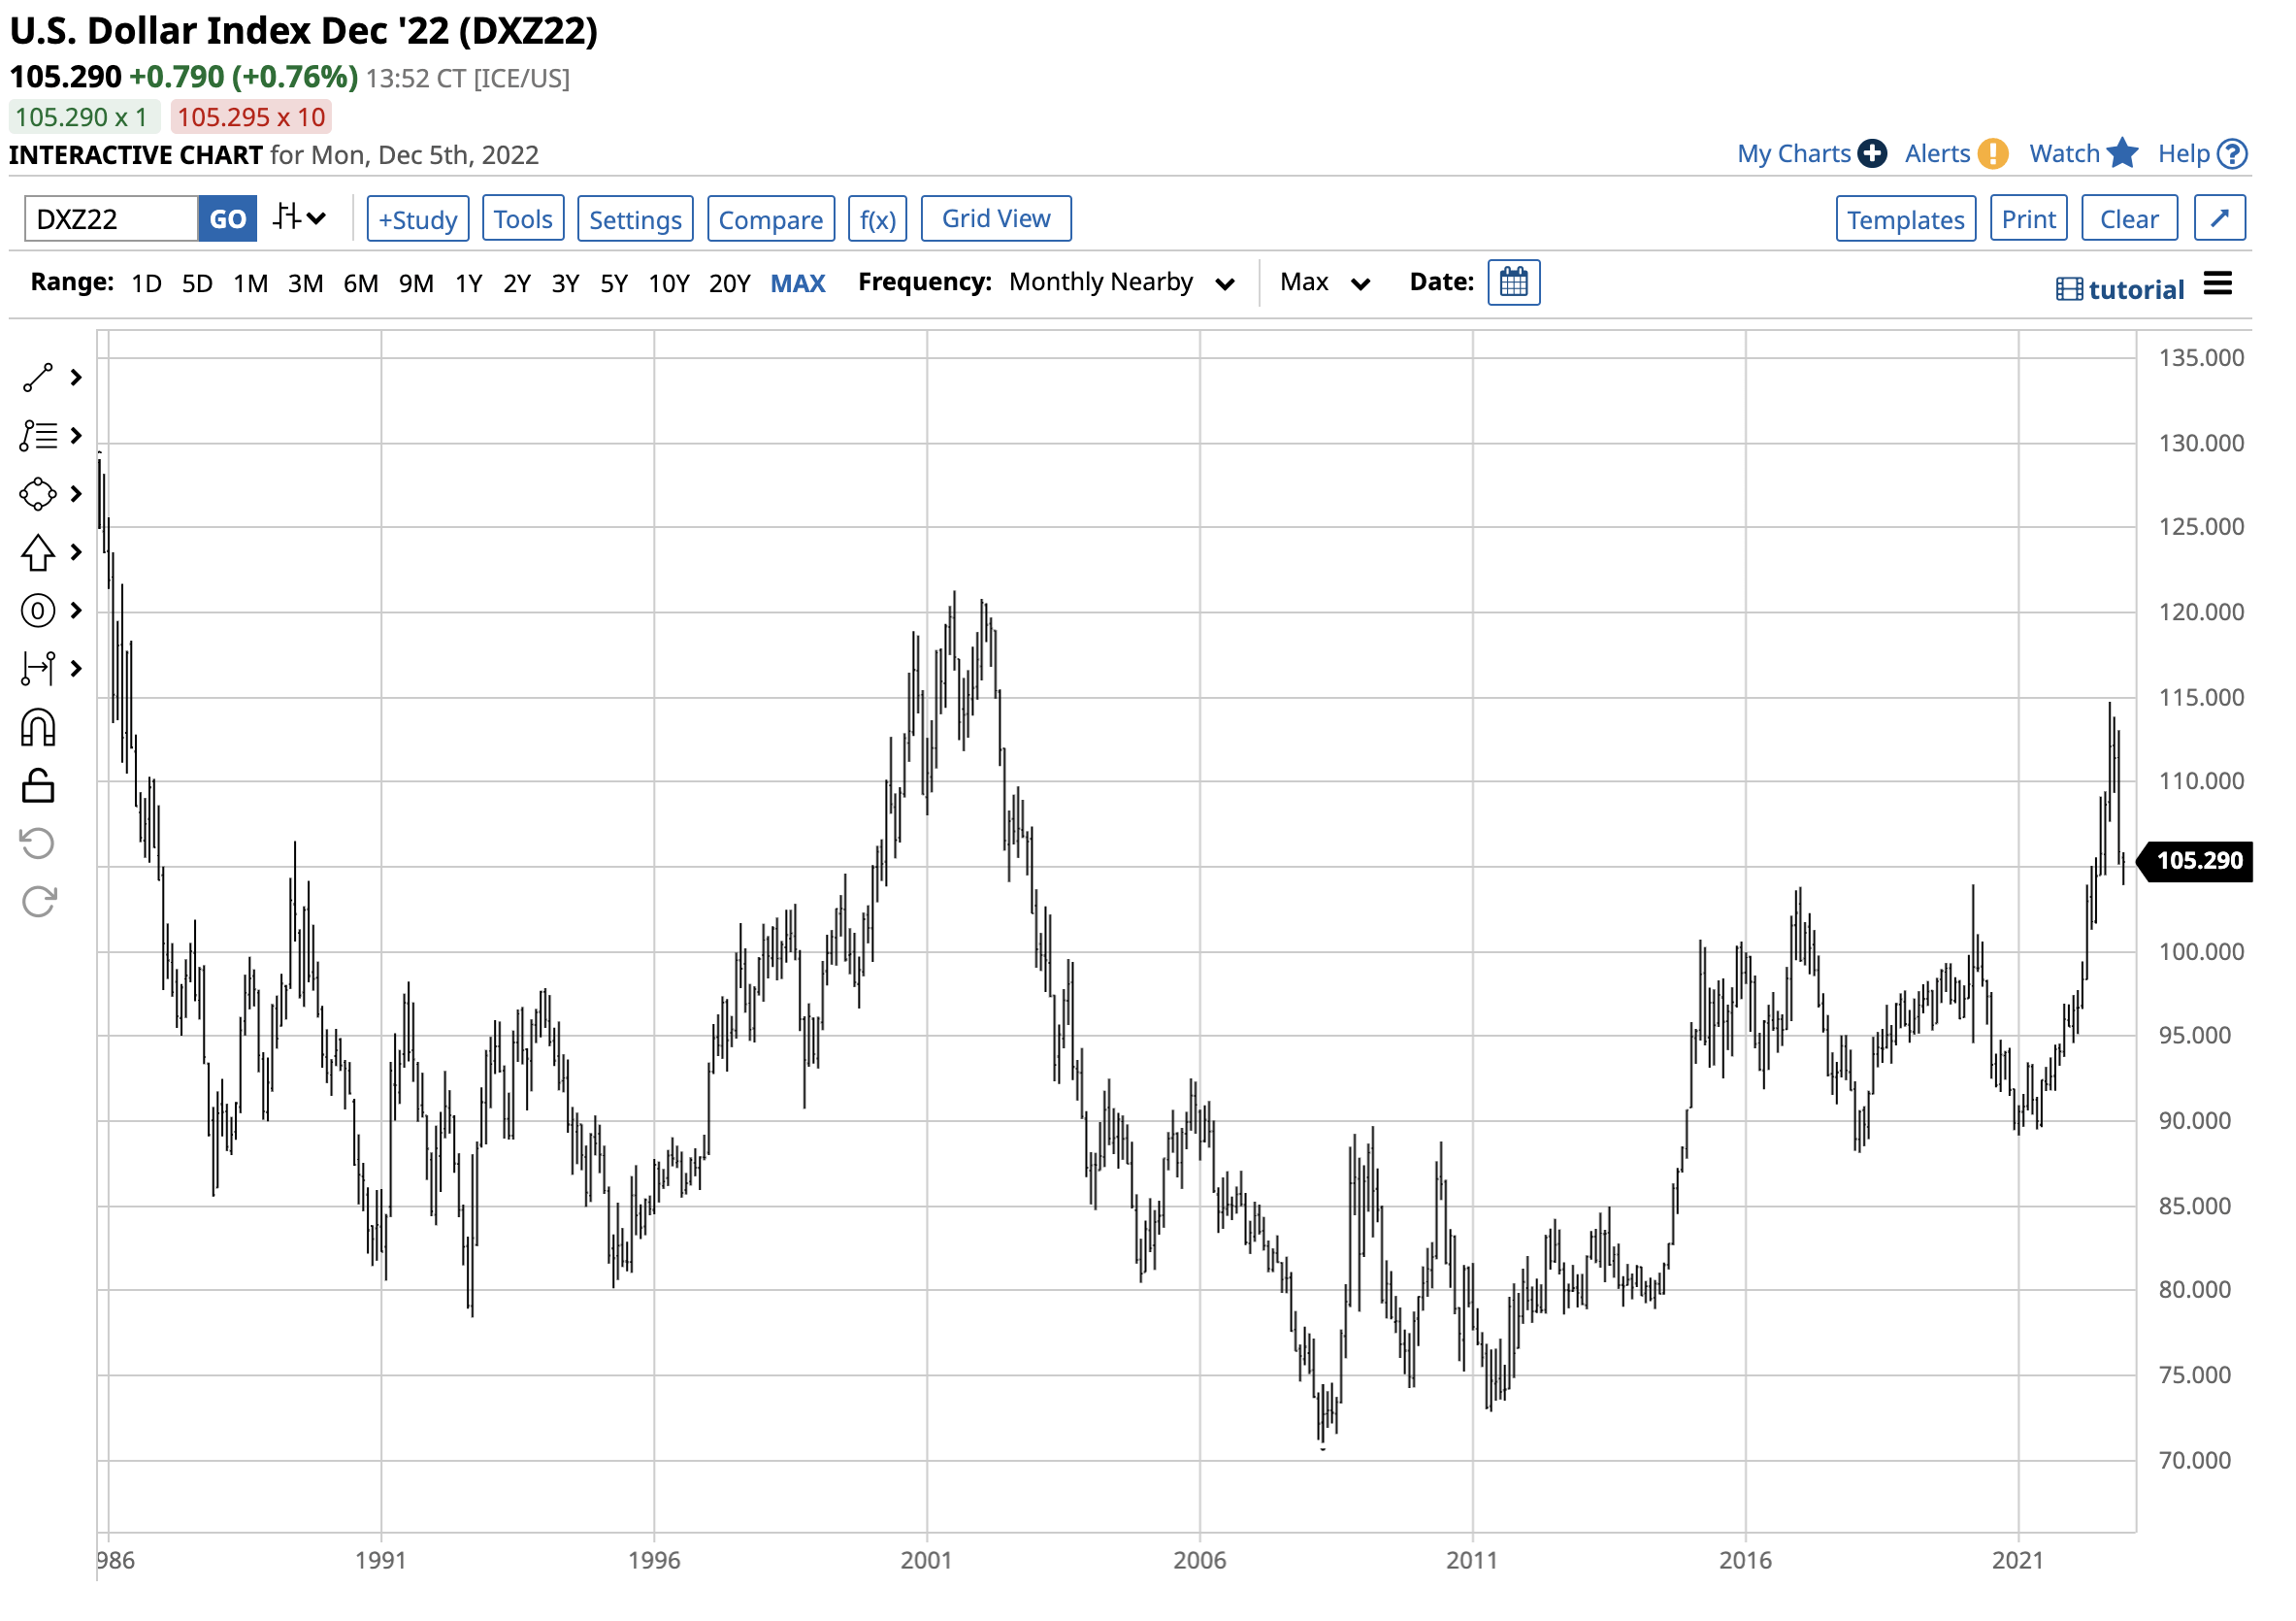
Long-Term U.S. Dollar Index Futures Chart (Barchart)
The long-term chart illustrates the dollar index’s rise to 114.745 in September 2022, a two-decade peak. The dollar index ran out of upside steam at the September high and was trading at 105.270 on Dec. 5.
The technical resistance became the support
The dollar index peaked at 103.960 in March 2020 before falling to an 89.165 low in January 2021.

The Medium-Term U.S, Dollar Index Chart (Barchart)
The 20-year chart shows the dollar index broke above the critical technical resistance level at the March 2020 103.960 high in May 2022. The index followed through on the upside, reaching 114.745 before turning lower. The resistance became technical support, and on Friday, Dec. 2, the index tested that downside level.
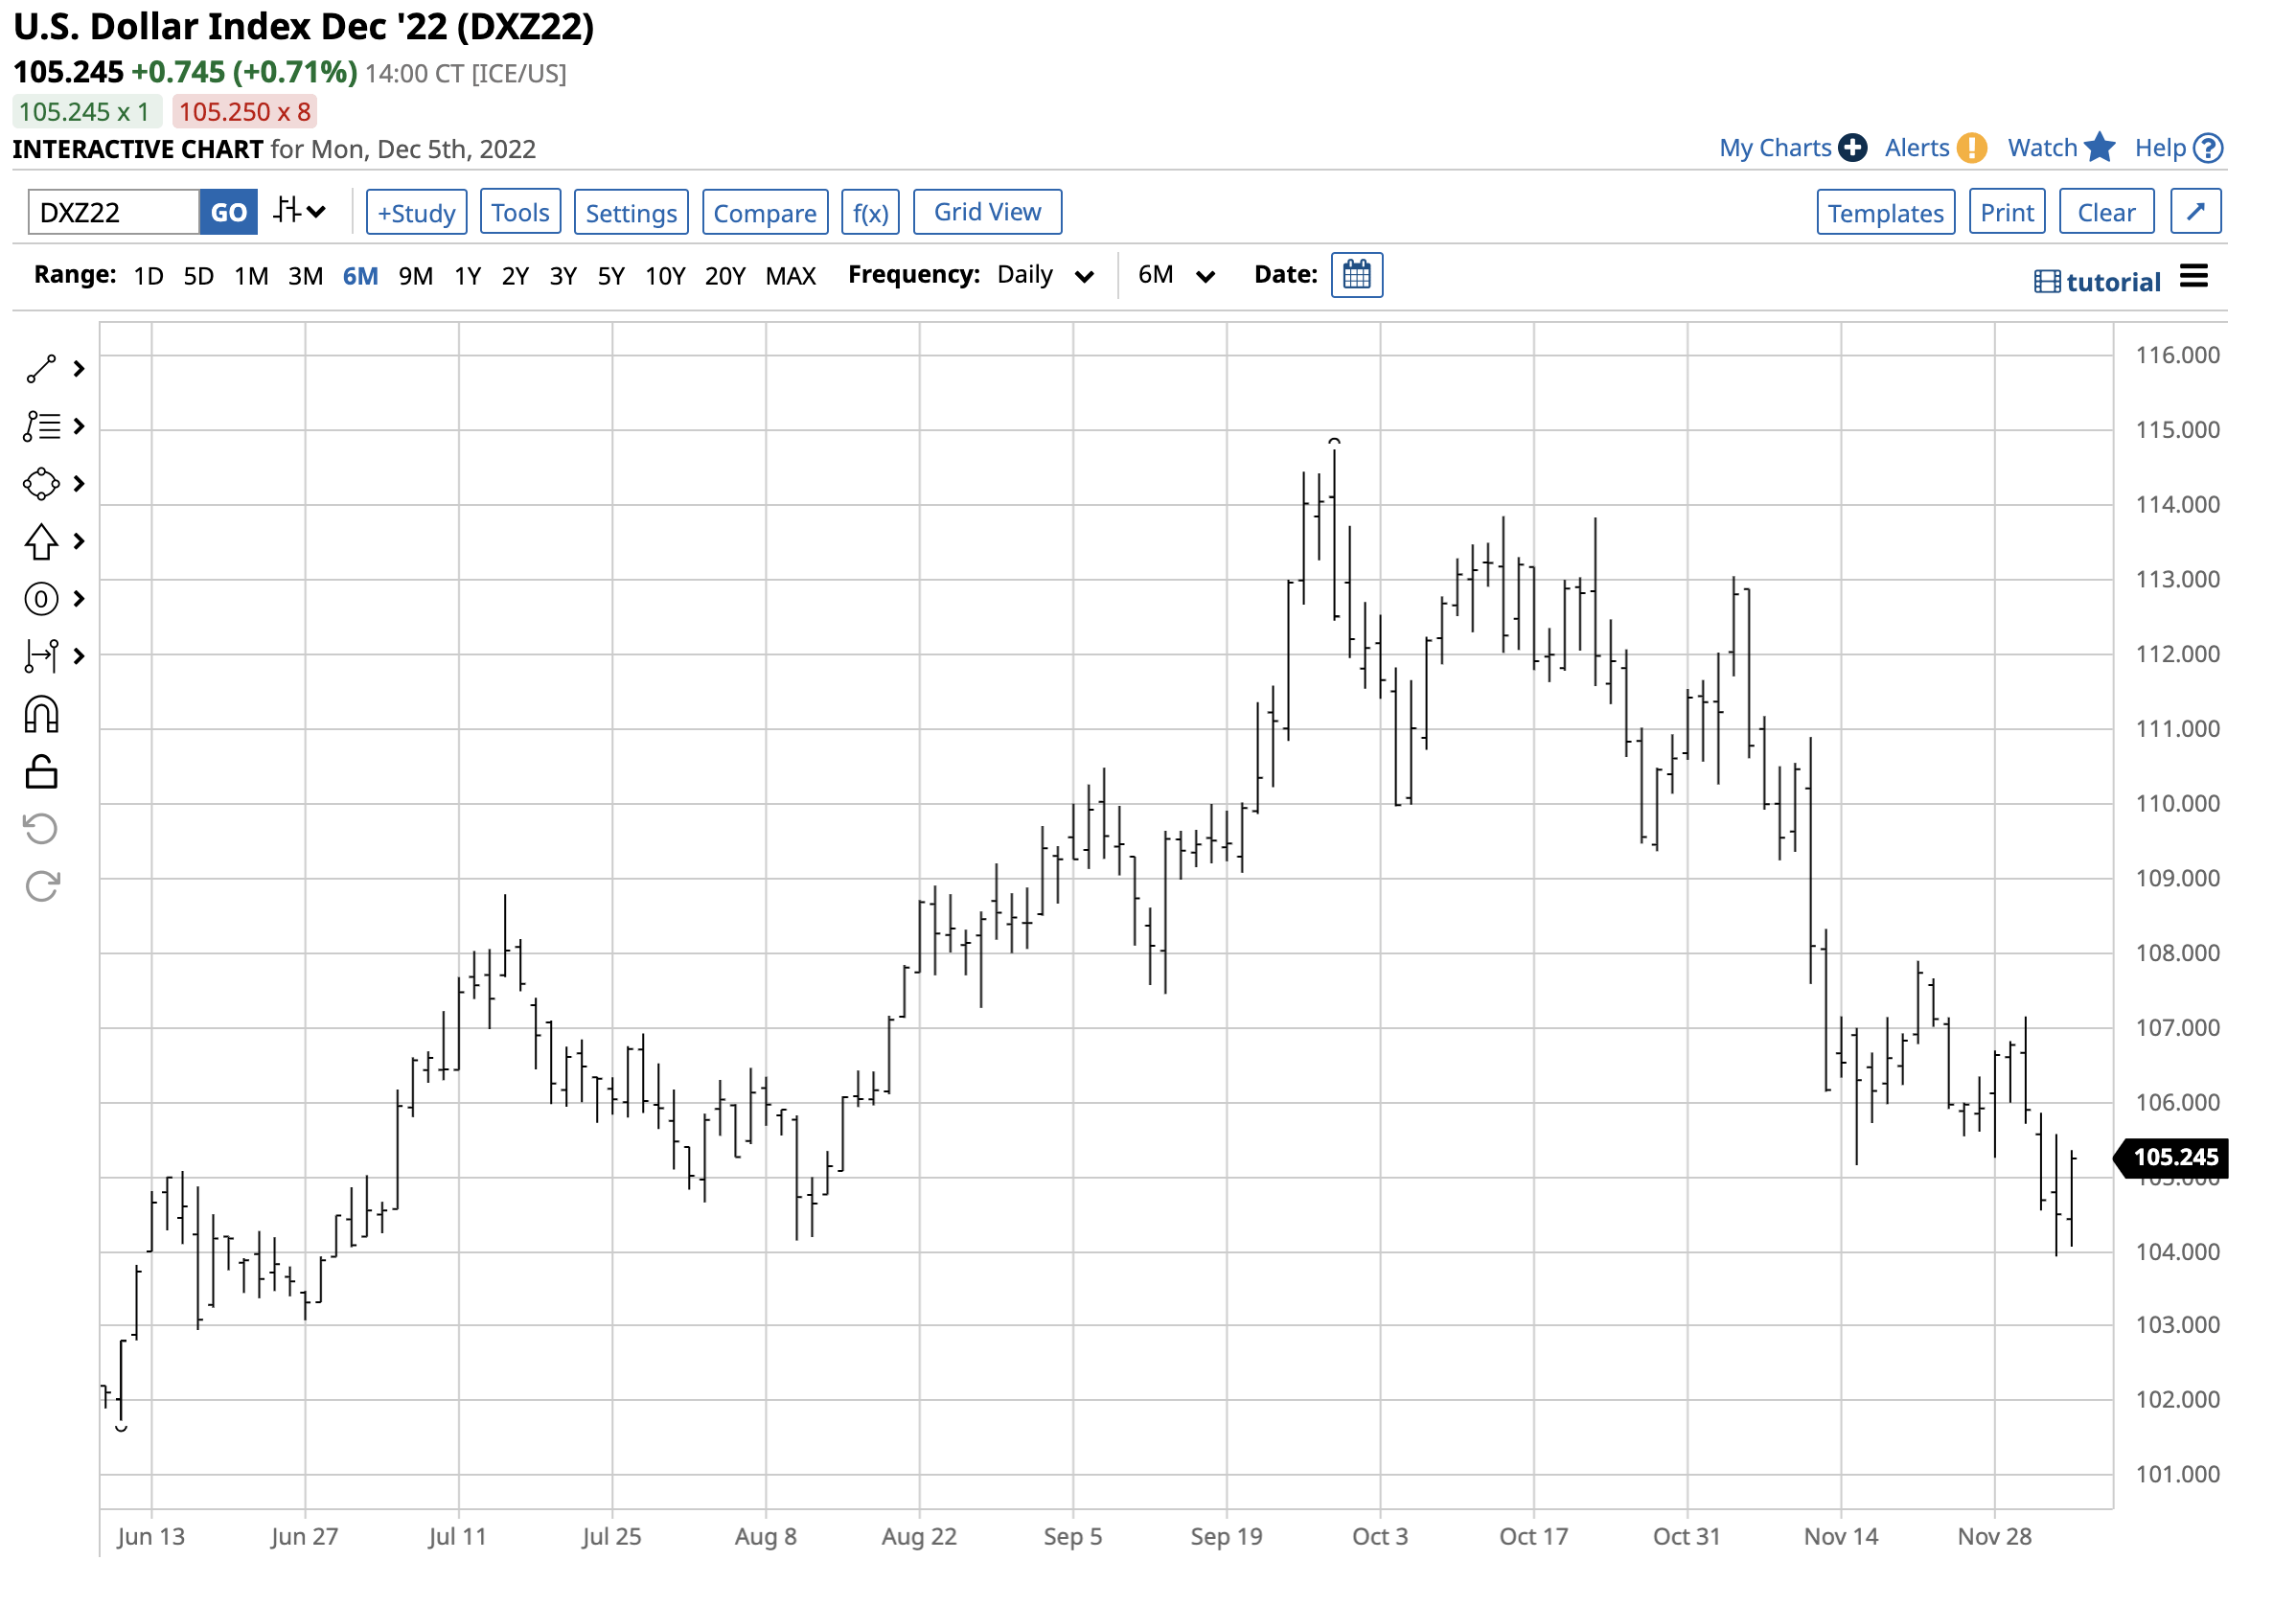
Short-Term U.S. Dollar Index Chart (Barchart)
The short-term chart highlights that the index probed below the 104 level late last week, reaching 103.935, briefly eclipsing the 103.96 support level. On Monday, Dec. 5, the index was above the 105 level, but the short-term path of least resistance since the September 2022 high remains lower. Meanwhile, the long-term trend since 2008 remains higher as the dollar index has made higher lows and higher highs. Ending that bullish pattern would require the index to fall below the January 2021 89.165 low. The bottom line is the dollar index is at a crossroads with bullish and bearish factors pulling the U.S. currency in opposite directions during 2022’s final month.
Factors supporting the U.S. dollar index
The dollar index is a snapshot of the dollar’s value against the other freely convertible reserve currencies. In the foreign exchange markets, interest rate differentials are a primary factor driving one currency’s value against others.
The U.S. Federal Reserve has committed to fighting inflation with the most hawkish monetary policy in decades. After four consecutive 75-basis point rate hikes that pushed the short-term Fed Funds Rate to 3.75 to 4.00%, the market expects another 50-basis point rate increase at the December FOMC meeting. Short-term rates at a midpoint of 4.375% and heading for the 5% level or higher in 2023 are bullish for the U.S. currency.
Meanwhile, as the dollar is the leading reserve currency, geopolitical turmoil tends to lead central banks and investors to hold dollars because of the U.S.’s political and economic stability. The ongoing war in Ukraine, the impact on Western Europe with the conflict on its doorstep, and China’s alliance with Russia support the dollar.
The case for a lower U.S. dollar
The dollar index failed at the 114.745 level, and the most recent low of 103.935 was a 9.4% decline that probed below the critical medium-term technical support level. A nearly 10% decline in the index from the late September high to the early December low was a significant move, as currency values tend to rise or decline slowly. Governments intervene in the foreign exchange arena to ensure stability for cross-border payments. A stable reserve currency market is crucial for stability in the global financial system. Therefore, the 9.4% decline was a significant event.
Meanwhile, the latest Fed minutes and comments from Chairman Jerome Powell said that the central bank understands the lag between the recent monetary policy, which could lead to a period of less than the previous 75-basis point rate hikes. The market now assumes the Fed will increase the short-term rate by 50 points at the December meeting, which put downside pressure on the dollar index and pushed it to a test of the 103.96 technical support level on Dec. 2.
Aside from a less hawkish monetary policy approach, the bifurcation on the geopolitical landscape could cause the dollar’s prominence to fade. China’s “no-limits” alliance with Russia could cause the two countries to move away from holding and using U.S. dollars. While Russia already has done so, China is the world’s second-leading economy. Chinese rejection of the U.S. currency would be a significant blow to the dollar’s position as the world’s reserve currency.
UDN and UUP follow the dollar index lower and higher
The Invesco DB U.S. Dollar Index Bearish Fund (UDN) rallies as the dollar index falls, and the bullish product (UUP) moves higher when the index appreciates. The products offer liquidity for market participants looking to position on the short or long side of the dollar index:
- At $18.31 on Dec. 5, the UDN bearish dollar ETF product had $75.547 million in assets under management. UDN trades an average of 339,912 shares daily and charges a 0.77% management fee.
- At $28.46 on Dec. 5, the bullish dollar index UUP ETF product had $2.218 billion in assets under management. UUP trades an average of over 4.374 million shares daily and charges a 0.78% management fee.
The December dollar index futures contract dropped from 114.745 in late September to 103.935 on Dec. 2, a 9.4% decline.
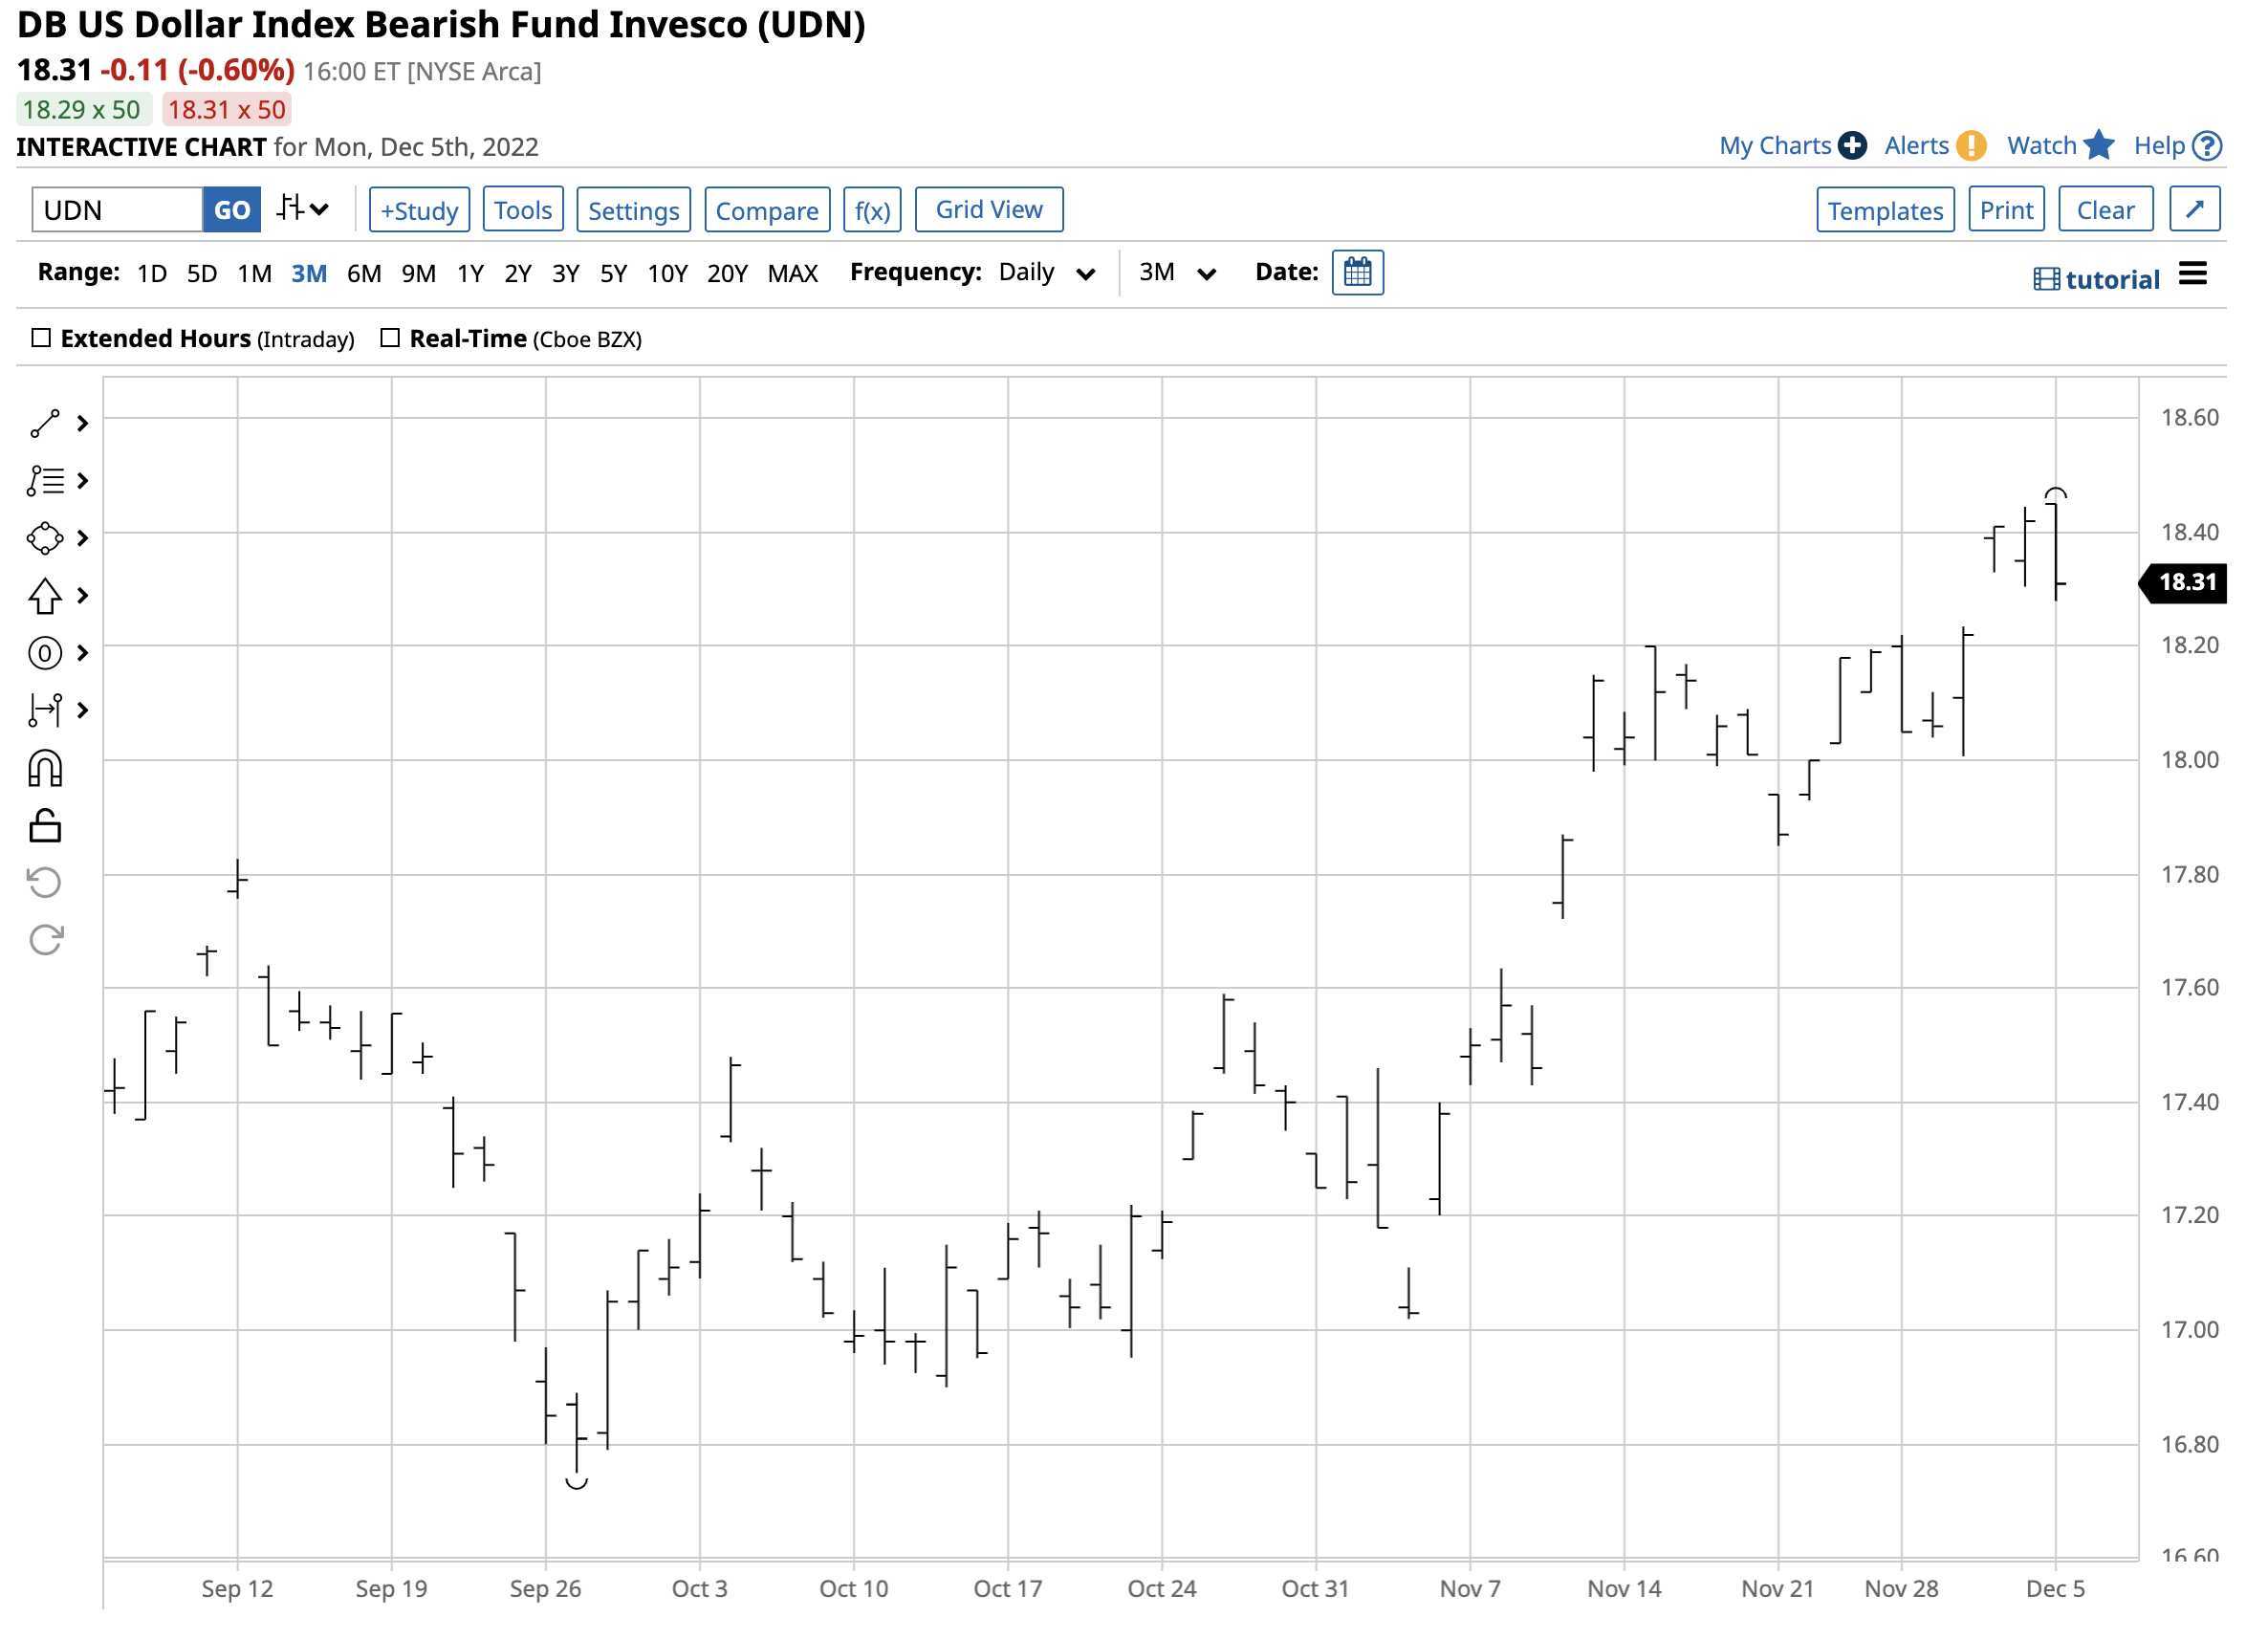
Chart of the UDN Bearish Dollar Index ETF Product (Barchart)
The chart shows that over the same period, the bearish UDN ETF rose from $16.75 to $18.45 per share or 10.1%. UDN did an excellent job tracking the dollar index on the downside, and the UUP product tends to do the same on the upside.
The short-term path of least resistance of the dollar index has been lower since late September 2022. Meanwhile, the long-term trend remains higher as the dollar index has made higher lows and higher highs over the past fourteen years. The dollar index faces bullish and bearish factors that could cause lots of volatility over the coming months.
Be the first to comment