The rock group Blood, Sweat & Tears had a song about this: “What goes up must go down…”. Here we are looking for the opposite movement, though. The concept of “Short Term Reversal”, where, on average stocks, relatively speaking, with poor weekly performance, can reverse and outperform the following week has been studied by scholars for decades. The Vesper U.S. Large Cap Short-Term Reversal Strategy ETF (NYSEARCA:UTRN) is based on research done by the founders of the investment firm that launched this ETF. Since UTRN uses S&P 500 stocks, evaluating its worth to investors comes down to one question: “Does it outperform the SPY ETF?”. Back-testing says yes; actual performance not so much. Of course, there could be other benefits.
Vesper U.S. Large Cap Short-Term Reversal Strategy ETF review
cdn-webmaker1.nyc3.digitaloceanspaces.com
The investment management firm. Vesper Capital Management, describes themselves as:
VCM is a unique academic / private sector collaborative, draws upon over sixty years of quantitative research from investment management experience to develop custom indices and investment products designed to provide low cost downside risk protection and maintain upside return potential for the index investing.
Source: chowratio.com
Seeking Alpha describes this ETF as:
The Vesper U.S. Large Cap Short-Term Reversal Strategy ETF is an exchange traded fund launched and managed by Exchange Traded Concepts. It seeks to track the performance of the Vesper U.S. Large Cap Short-Term Reversal Index. UTRN started in September of 2018.
UTRN has accumulated $76.5m in assets and comes with 75bps in fees. As readers will see later, the yield is very unpredictable. Vesper lists why investors would benefit from owning their ETF, starting with their description:
Vesper U.S. Large Cap Short-Term Reversal Strategy ETF is a rules-based investment strategy that seeks to provide investment results that, before fees and expenses, correspond generally to the total return of the U.S. Large Cap Short-Term Reversal Index (UTRNX). The Index seeks to capitalize on the tendency for stocks that have experienced sharp recent sell-offs to experience near-term rebounds. Reasons to own include:
• Equity Exposure – UTRN may be used as a portion of your portfolio’s large cap equity allocation.
• May be appropriate for investors seeking a high conviction, high active-share strategy.
• May be appropriate for investors seeking to capitalize on market volatility.
• May be appropriate for investors seeking unique, proprietary investment strategies
• May be appropriate for investors seeking a distinctive return stream
• Factor Exposure – UTRN may be appropriate for investors seeking exposure to the short-term reversal factor.
• Alternatives – With a unique, high-turnover, high potential alpha trading strategy, UTRN may be appropriate for an alternatives allocation.
Getting a grasp on this unique, in-house index is critical to understanding what this ETF is all about. The Index process works like this:
• Rank stocks in the S&P 500 based on the Chow Ratio.
• The 25 stocks with the most attractive (lowest) Chow Ratio are selected for inclusion in the index.
• The Index is evaluated and re-balanced on a weekly basis.
• A stock in the index is removed at rebalance when its Chow Ratio becomes unattractive. It is replaced with a stock that has a more attractive Chow Ratio.
• The Index is equal-weighted and is provided and calculated by SPDJI.
The Chow ratio is based on research by Professor Victor Chow, Ph.D., CFA, who is also one of the founders of Vesper Capital Management. This is the trading phenomenon the Chow ratio attempts to quantify and then capture.
The short-term return reversal in stocks is an old asset pricing anomaly. It is well known that stock return performance over a short period, said daily or weekly returns, do not necessarily reflect the fundamental return components such as risk premium, future cash flow, and expected discount rate (the health conditions of the firm). In fact, the short-term stock prices often reflect investor behavioral biases such as overreaction to information, loss-aversion, and other cognitive errors as well as emotional bias. For example, fire sales are more likely than fire purchase. Also, in many cases, the recent losing stocks may experience temporarily financial distress, and constrained investors are forced to sell which causes a significant price concession. The later price recovery thus reflects compensation for liquidity provision. This liquidity provision is an indispensable source of the short-term reversal profits.
Source: chowratio.com
Being a proprietary ratio, descriptions of the Chow ratio are very limited, but I did find this:
Decades of research have shown that strategies capitalizing on the short-term reversal effect (while controlling trading costs) can add value and reduce volatility relative to the major market indices.
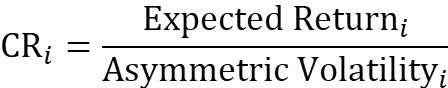
The Chow Ratio (CR) is a performance index that serves for security selection and portfolio optimization. The statistical formation of the CR is similar to that of the Sharpe Ratio but with a different risk-measure.
vesperglobal.com/strategy
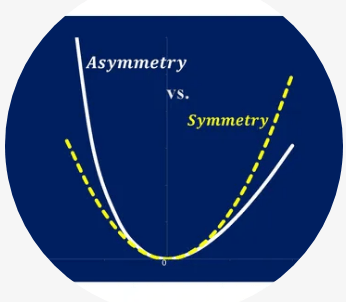
The conventional measure of price movement volatility, standard deviation, assumes investors treat their winning stocks the same way they treat their losing stocks (i.e. volatility is symmetric).
However, in many instances, the fear of loss causes investors to sell their downward-trending stocks much sooner than their upward-trending stocks. This overreaction results in significantly more downside price movement than upside price movement causing actual volatility to be asymmetric. Therefore, the CR incorporates an asymmetric measure to more effectively select securities.
Vesper Capital Management did provide the Chow ratio’s purpose:
It is based on asymmetric volatility. Investors treat their losers differently than their winners. Similar to the Sharpe ratio, it is performance divided by volatility. The actual calculations of performance and volatility are proprietary. If you would like to set up a Zoom Call with Dr. Chow for a deeper explanation, please let me know. Thanks again for your interest.
This metric identifies stocks with sharp one-week prices declines that exhibit “rules based” stability and volatility measures to determine those that have the greatest potential for rebound. In order to limit the effects of illiquidity and associated higher relative trading costs, the Chow Ratio is only applied to stocks in the S&P 500.
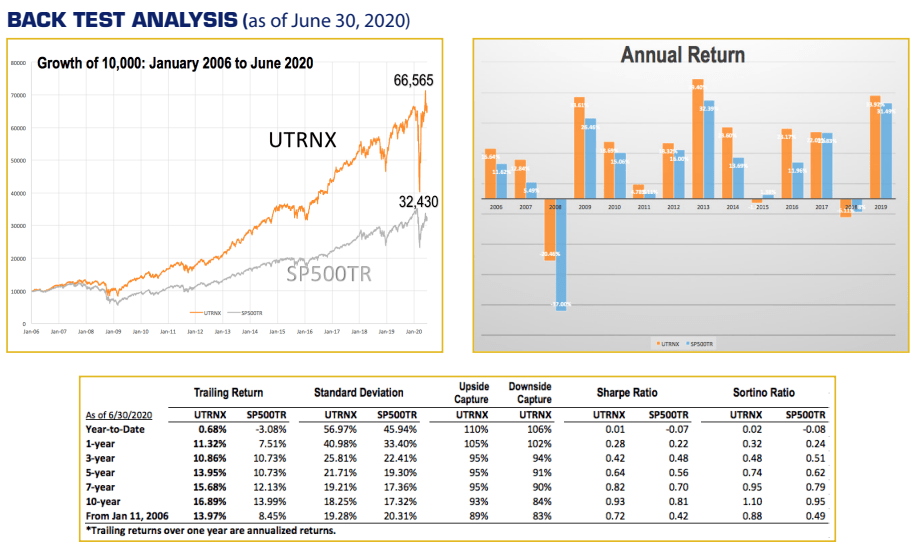
They also provide back-tested data from 2006, over a decade more than just looking at the ETF. This data ends in June, 2020.
cdn-webmaker1.nyc3.digitaloceanspaces.com
In each time period, the UTRNX outperformed the S&P 500 TR results, with a higher Sharpe ratio most times. As we will see later, the ETF doesn’t appear to be that consistent. I did find a chart that only showed ending values as of 6/30/22: UTRNX-85,366, with SP500TR-40,812.
UTRN holdings review
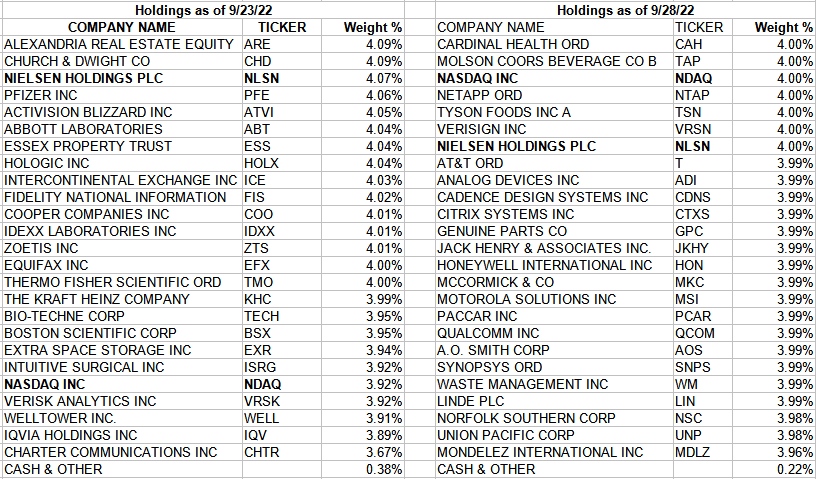
Since the portfolio could experience a 100% turnover each week (23 did this time), providing analysis based on the typical equity factors (PE/PBV, sectors) does not seem necessary.
UTRN runs the Chow Ratio after the close every Tuesday and rebalances the portfolio before the close on Wednesday. To show how that effects the holdings, I included the last two weeks of holdings. Only two stocks are in both lists (NLSN, NDAQ).
utrnetf.com; compiled by Author
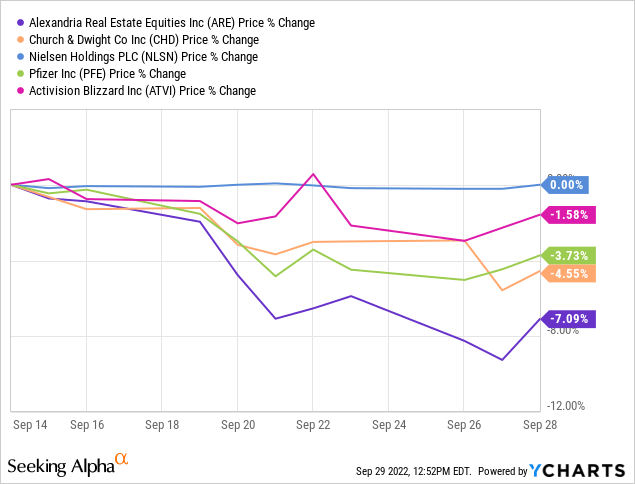
The portfolio of 25 stocks starts out equal-weighted. The next chart shows the top 5 tickers from last week and how they moved the week prior and then the most recent week.
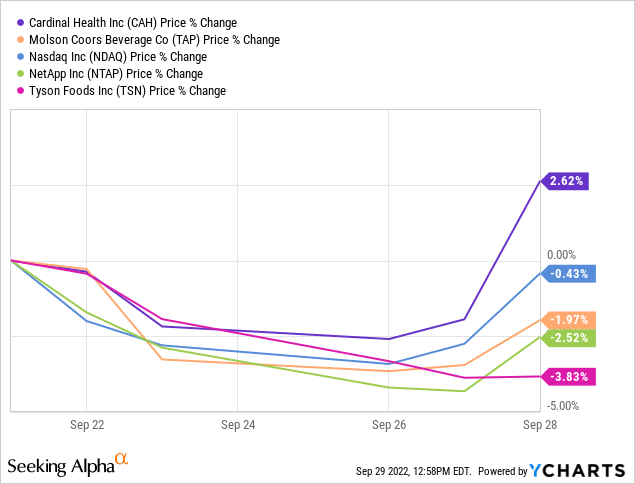
Notice the stock with the biggest drop, Alexandria Real Estate Equities (ARE), continued down and was dropped from UTRN’s holdings. Except for Nielsen Holdings (NLSN), the other three were also removed. The next chart uses the first five listed tickers for this week, showing the previous week’s price movements.
Here, we see that all five were down the prior week. Notice four of the five stocks jumped on the day they were bought for UTRN. Checking, the volume purchased ranged up to 10% of the trading volume that day. That was also a day when the S&P 500 Index jumped almost 2%, which could explain some of the bullish movements in price.
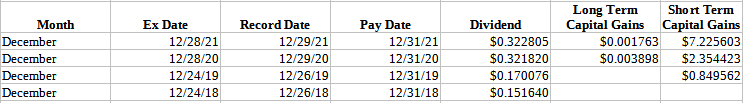
UTRN distribution review
utrnetf.com; compiled by Author
With weekly rebalancing, most of the payouts were generated by that trading. Such results are only distributed in December.
Portfolio strategy
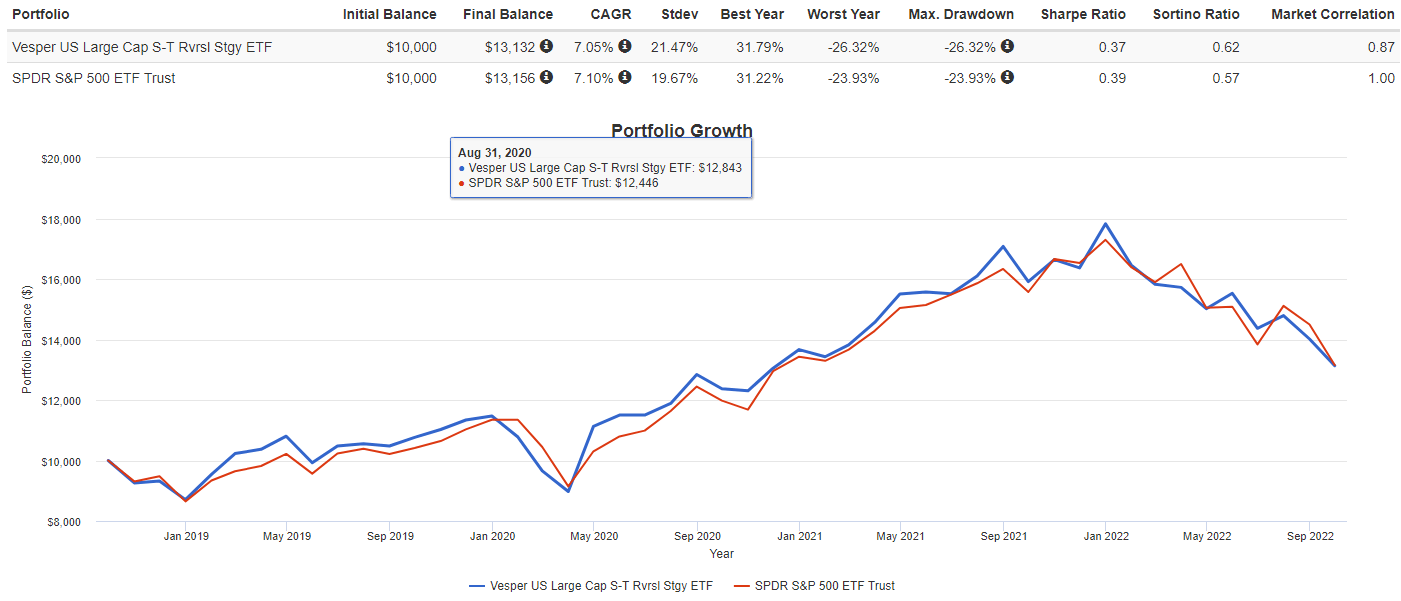
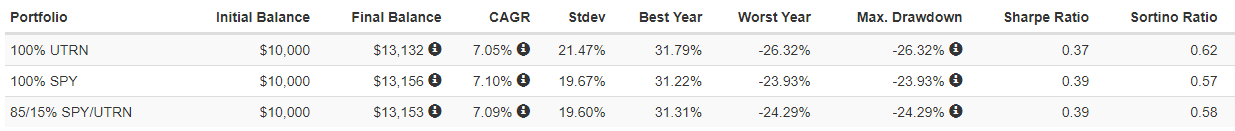
Since UTRN only uses S&P 500 stocks, comparing it to the SPDR S&P 500 ETF (SPY) makes sense to me as investors might add UTRN to their US Large-Cap equity allocation to either gain return, income or better risk data.
PortfolioVisualizer.com
Unlike the pre-ETF data, since UTRN started, SPY slightly betters UTRN on return and risk measures; UTRN wins on income generated for investors. If investors did not reinvest, UTRN’s CAGR is actually ahead by 60bps as of this writing. A .87 correlation factor to the market is a plus for UTRN too.
Combining the ETFs, another possible strategy, results in a 1bps loss of CAGR and small drop in StdDev, with little changes in Sharpe/Sortino ratios.
PortfolioVisualizer.com
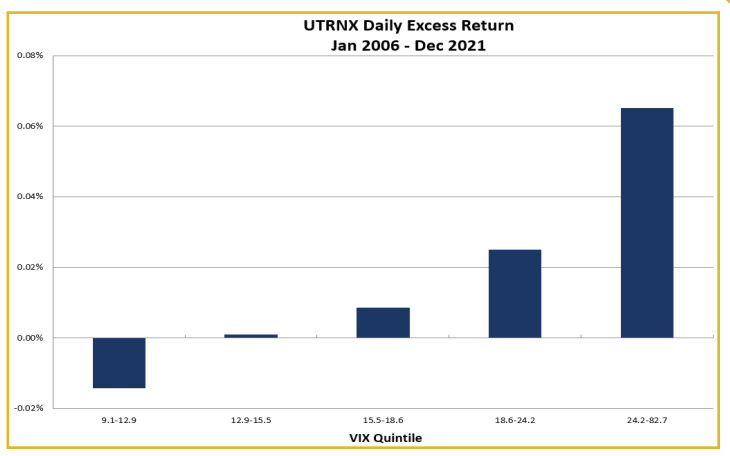
Volatility matters
The UTRNX Index process has shown it works best when volatility is high.
cdn-webmaker1.nyc3.digitaloceanspaces.com/
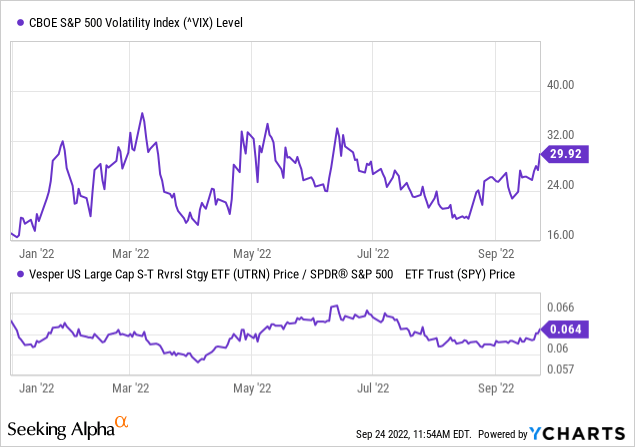
The current VIX values places in the rightmost bar on the above chart, which is the best quintile for the UTRN ETF. The following chart shows how VIX and the ratio of UTRN/SPY have moved in 2022.
Ycharts
The charts seem to confirm what the index data predicted.
Final thoughts
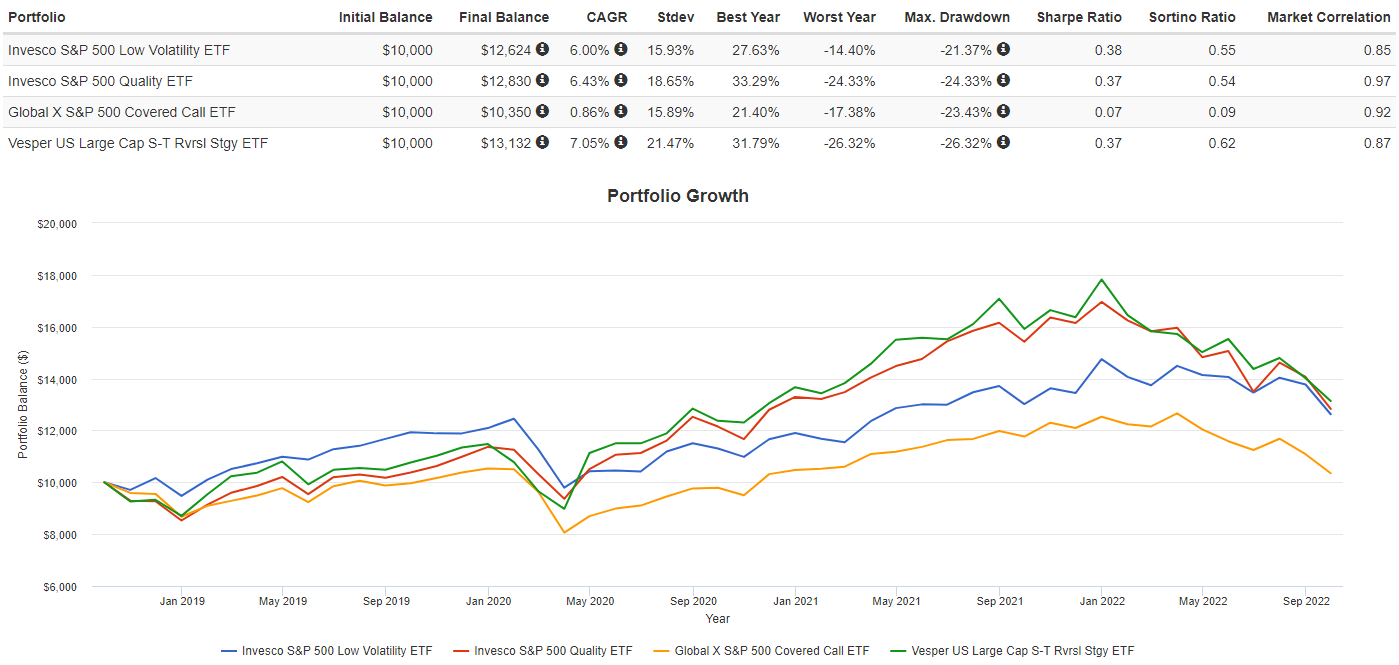
There are lots of ETFs that are derivatives off of owning a pure S&P 500 ETF like SPY, so I picked three popular ones to see how well UTRN matches up. Those ETFs are:
Here we see UTRN matches up well against two, and XYLD lags behind the others. For those looking for a risk adverse ETF, UTRN trailed the others.
When building out a portfolio, taking into account all the assets already owned is important otherwise one can find the own lots of assets that are highly correlated and incurring more risk than they thought or want. Also by combining an ETF like UTRN into their mix, they might find the drawdowns have been dampened, which could be an important criteria if constant withdrawals, like RMDs, are required.
Please note that foreign exchange and other leveraged trading involves significant risk of loss. It is not suitable for all investors and you should make sure you understand the risks involved, seeking independent advice if necessary.


Be the first to comment