


deepblue4you
The Utilities Select Sector SPDR ETF (NYSEARCA:XLU) was an excellent place to hide in 2022, as utilities and energy were the only sectors that delivered positive returns. However, as we head into 2023, investors should consider several headwinds facing the XLU.
First, the utility sector is trading at multi-decade high valuations of ~20x Fwd P/E. Second, the utility sector has gone from trading at a lower Fwd P/E relative to the S&P 500 to a higher Fwd P/E, as the market’s multiple has contracted. Finally, the fund’s largest weight trades at a substantial premium valuation with below average growth.
While the XLU may still outperform the market in a risk-off scenario, absolute returns may be harder to achieve in 2023.
Fund Overview
The Utilities Select Sector SPDR ETF (XLU) is a utilities sector-focused ETF offered by State Street Global Advisors (“SSGA”). It tracks the Utilities Select Sector Index (“Index”), an index that aims to represent the utilities sector of the S&P 500 Index. The index provides exposure to electric utilities, water utilities, multi-utilities, independent power producers, and gas utilities. The XLU ETF has been around since 1998 and has $16.5 billion in assets while charging a 0.1% gross expense ratio.
Portfolio Holdings
Figure 1 shows the XLU ETF’s fund characteristics. It holds 30 companies with average Price-to-Book ratio of 2.23 and Fwd P/E ratio 20.1x.
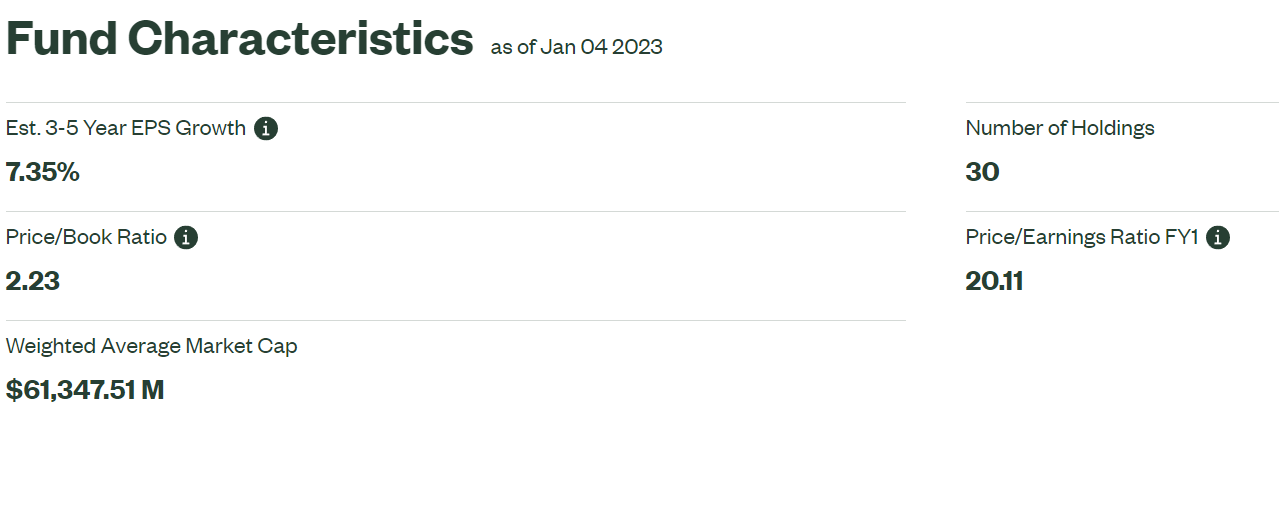
Figure 1 – XLU portfolio characteristics (ssga.com)
Figure 2 shows the fund’s sub-industry weights and top 10 holdings. The fund is fairly concentrated, with the top 10 holdings accounting for 60.5% of the fund’s assets and the largest position, NextEra Energy (NEE), accounting for 16.2% of the fund.
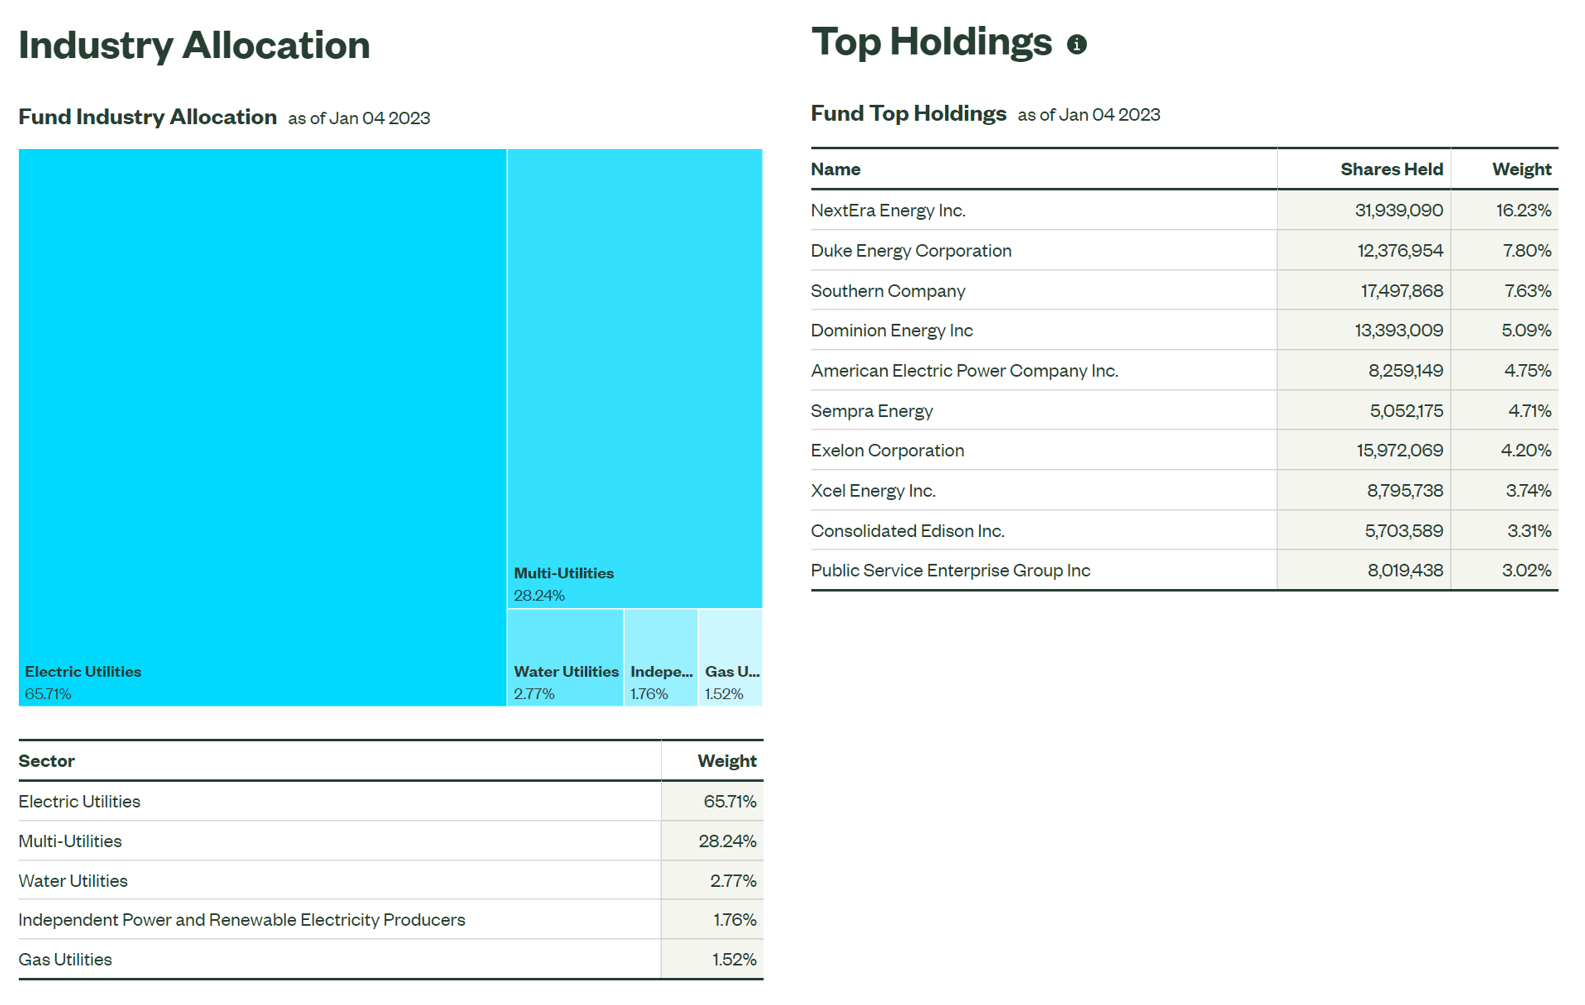
Figure 2 – XLU sub-industry allocation and top 10 holdings (ssga.com)
Returns
Figure 3 shows the XLU’s historical returns. The XLU has generated very respectable long-term returns with 3/5/10 Yr average annual returns of 6.3%, 9.5%, and 11.0% respectively to December 31, 2022.
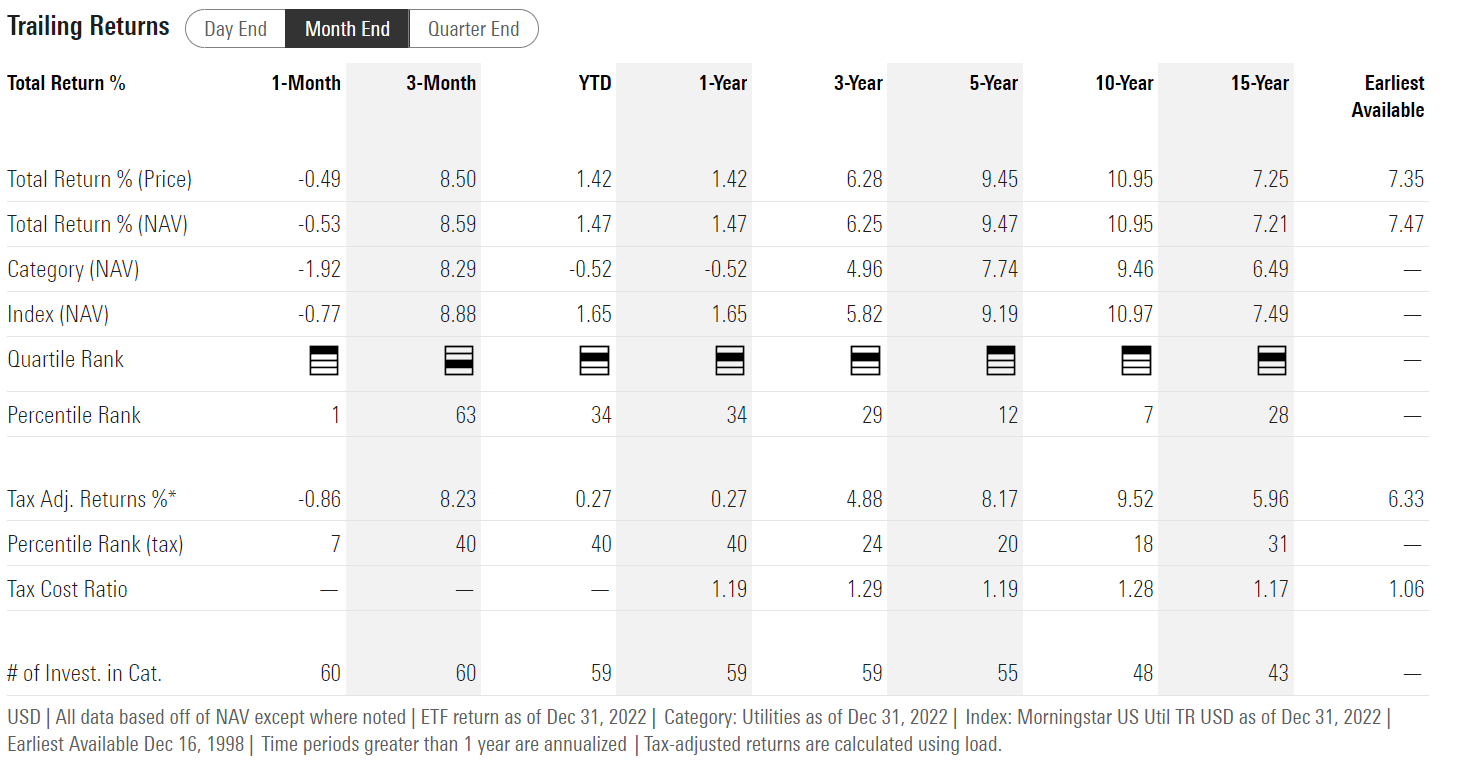
Figure 3 – XLU historical returns (morningstar.com)
Although XLU’s returns are below that of the S&P 500, as modelled by the SPDR S&P 500 ETF Trust’s (SPY) returns shown in Figure 4 below, investors should note that the XLU has commensurately lower volatility (3Yr St. Dev. of returns of 19.7% for XLU vs. 21.1 for SPY).

Figure 4 – SPY historical returns (morningstar.com)
Distribution & Yield
In addition to providing solid long-term returns, the XLU ETF also pays a hefty distribution. In the past twelve months, the fund has paid $2.06 / share in distribution, which equates to a trailing 2.9% yield. Seeking Alpha awards the XLU an ‘A+’ grade for its distribution (Figure 5).
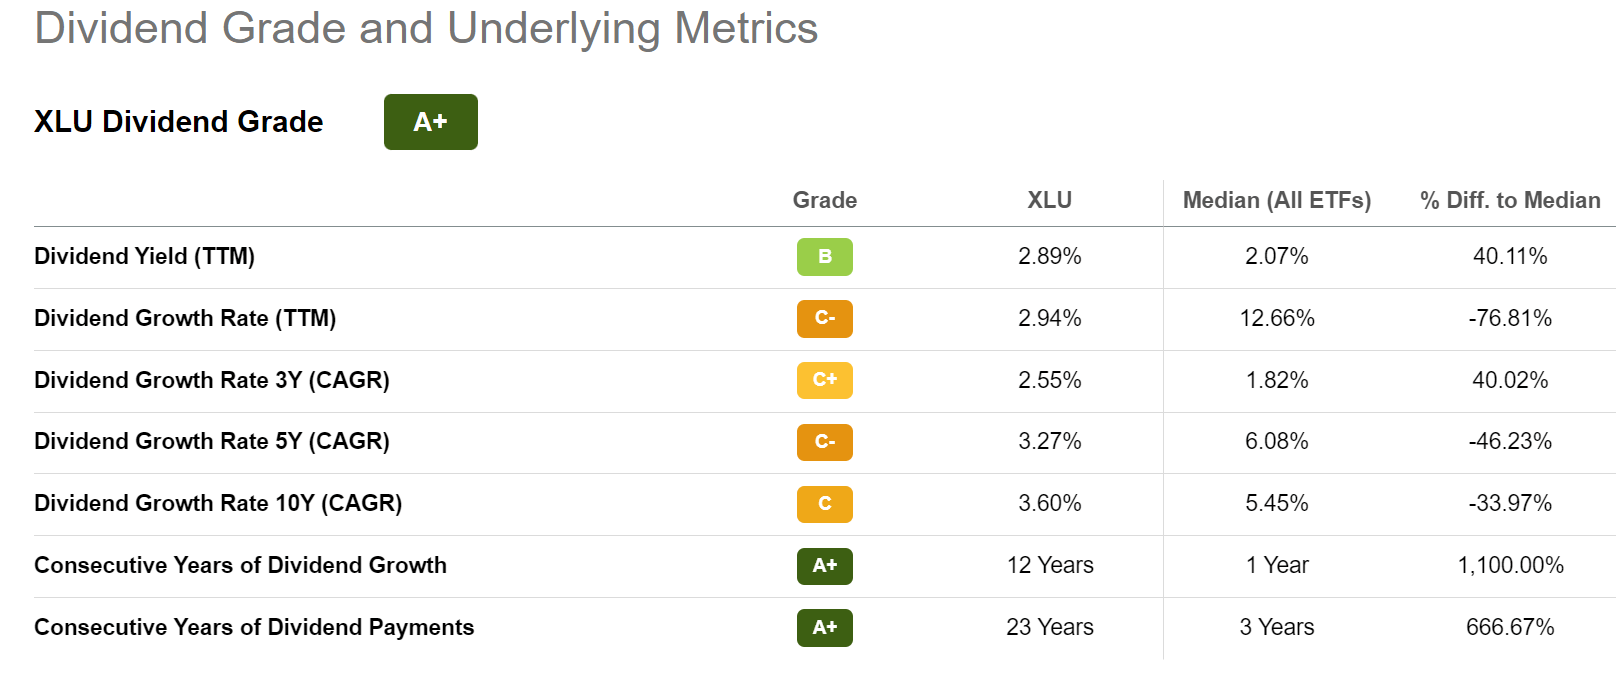
Figure 5 – XLU distribution grade (Seeking Alpha)
XLU’s distribution is paid quarterly and the most recently announced distribution of $0.57 was paid on 12/22/2022.
Utilities Was One Of The Best Performing Sectors In 2022…
While 2022 was a dismal year for equity investors in general, XLU investors were relatively well protected as the XLU was one of only 2 sector ETFs offered by SSGA that delivered a positive return in the past year (to January 4th, 2023).
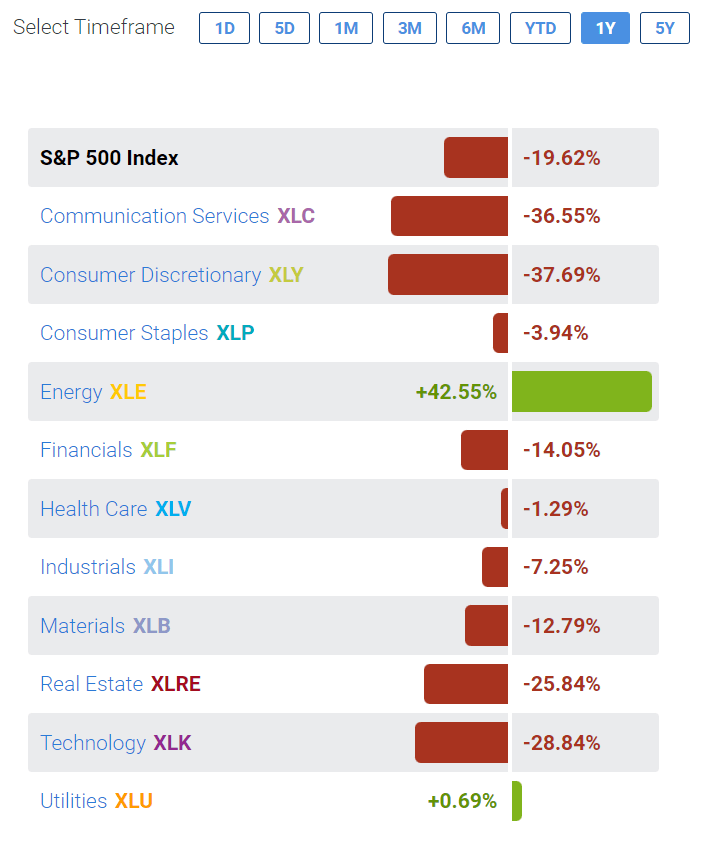
Figure 6 – XLU was 1 of 2 sector SPDR that generated positive returns in 2022 (sectorspdr.com)
…But Valuations Are At All-Time Highs
However, as we head into 2023, I see some potential headwinds that investors should be aware of. First, the utility sector overall is trading at multi-decade high valuations as investors have rushed to the safety of utility stocks in an equity bear market. While valuations can stay at elevated levels and earnings could grow to reduce the valuation over time, it does argue for caution regarding the sector (Figure 7).
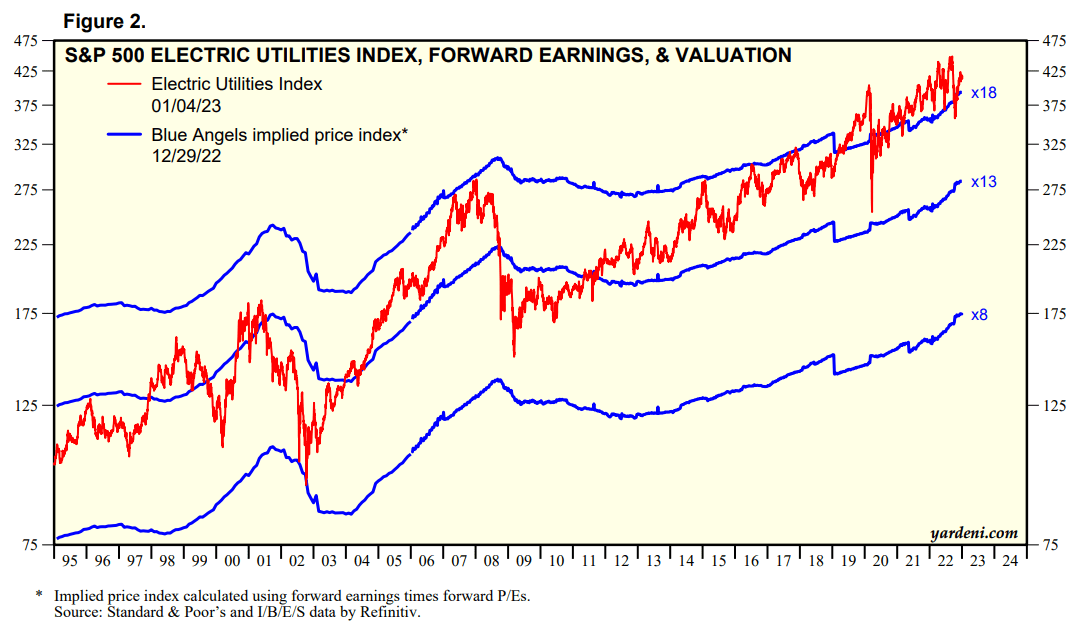
Figure 7 – Utility sector valuation at all time highs (yardeni.com)
Furthermore, while utility sector valuations have skyrocketed, the overall market’s valuation multiple has contracted significantly in the past year, from over 22x Fwd P/E to approximately 17x currently (Figure 8).
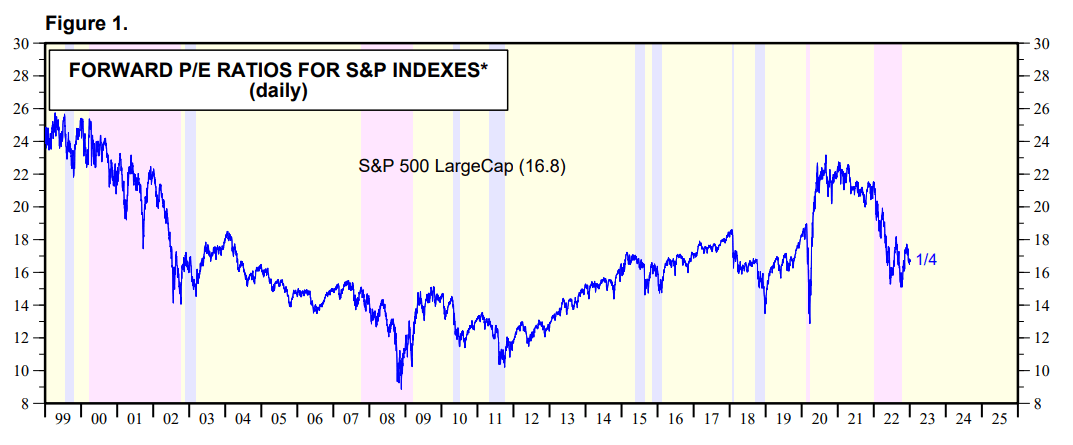
Figure 8 – S&P valuation has contracted from 22x to 17x (yardeni.com)
Market valuations have contracted because as interest rates increase, investor demand a higher rate of return on stocks (i.e. lower P/E) vis-a-vis the risk free treasury rate.
For XLU, the implication is that in 2021, when utilities were trading at ~20x P/E, they were trading ‘cheaper’ than the market at 22x. However, today, at ~20x P/E, utilities are trading ‘expensive’ relative to the market at 17x.
Finally, XLU’s largest holding, NextEra Energy, Inc., trades at an extremely elevated 36x Fwd P/E, almost double the sector’s median (Figure 9).
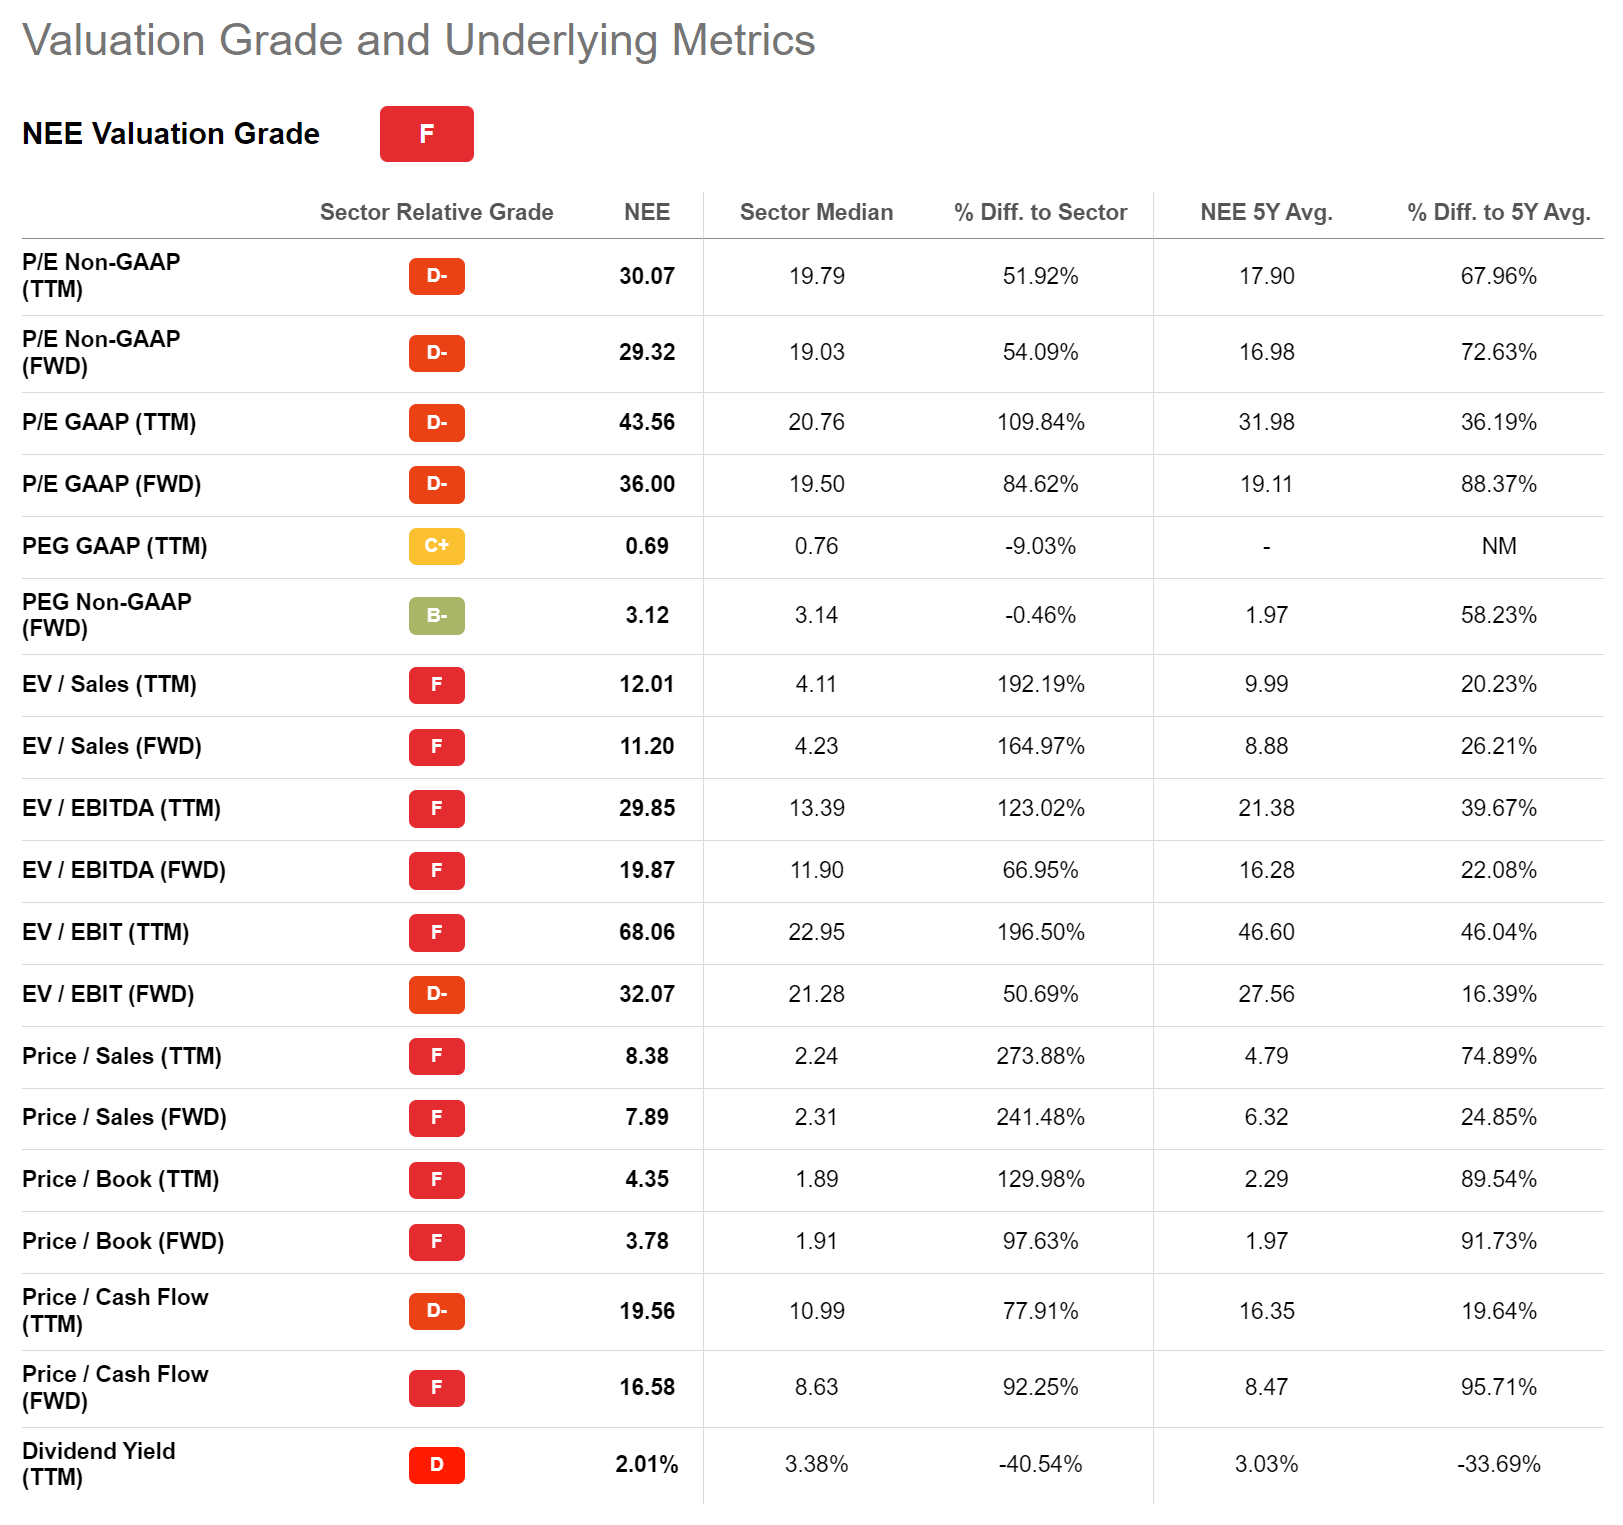
Figure 9 – NEE valuation has an F grade (Seeking Alpha)
While NEE’s valuation is elevated, it only has earnings growth estimate of 7.8% in 2023 (Figure 10), lower than the sector, where analysts expect 9% EPS growth for 2023 (Figure 11).
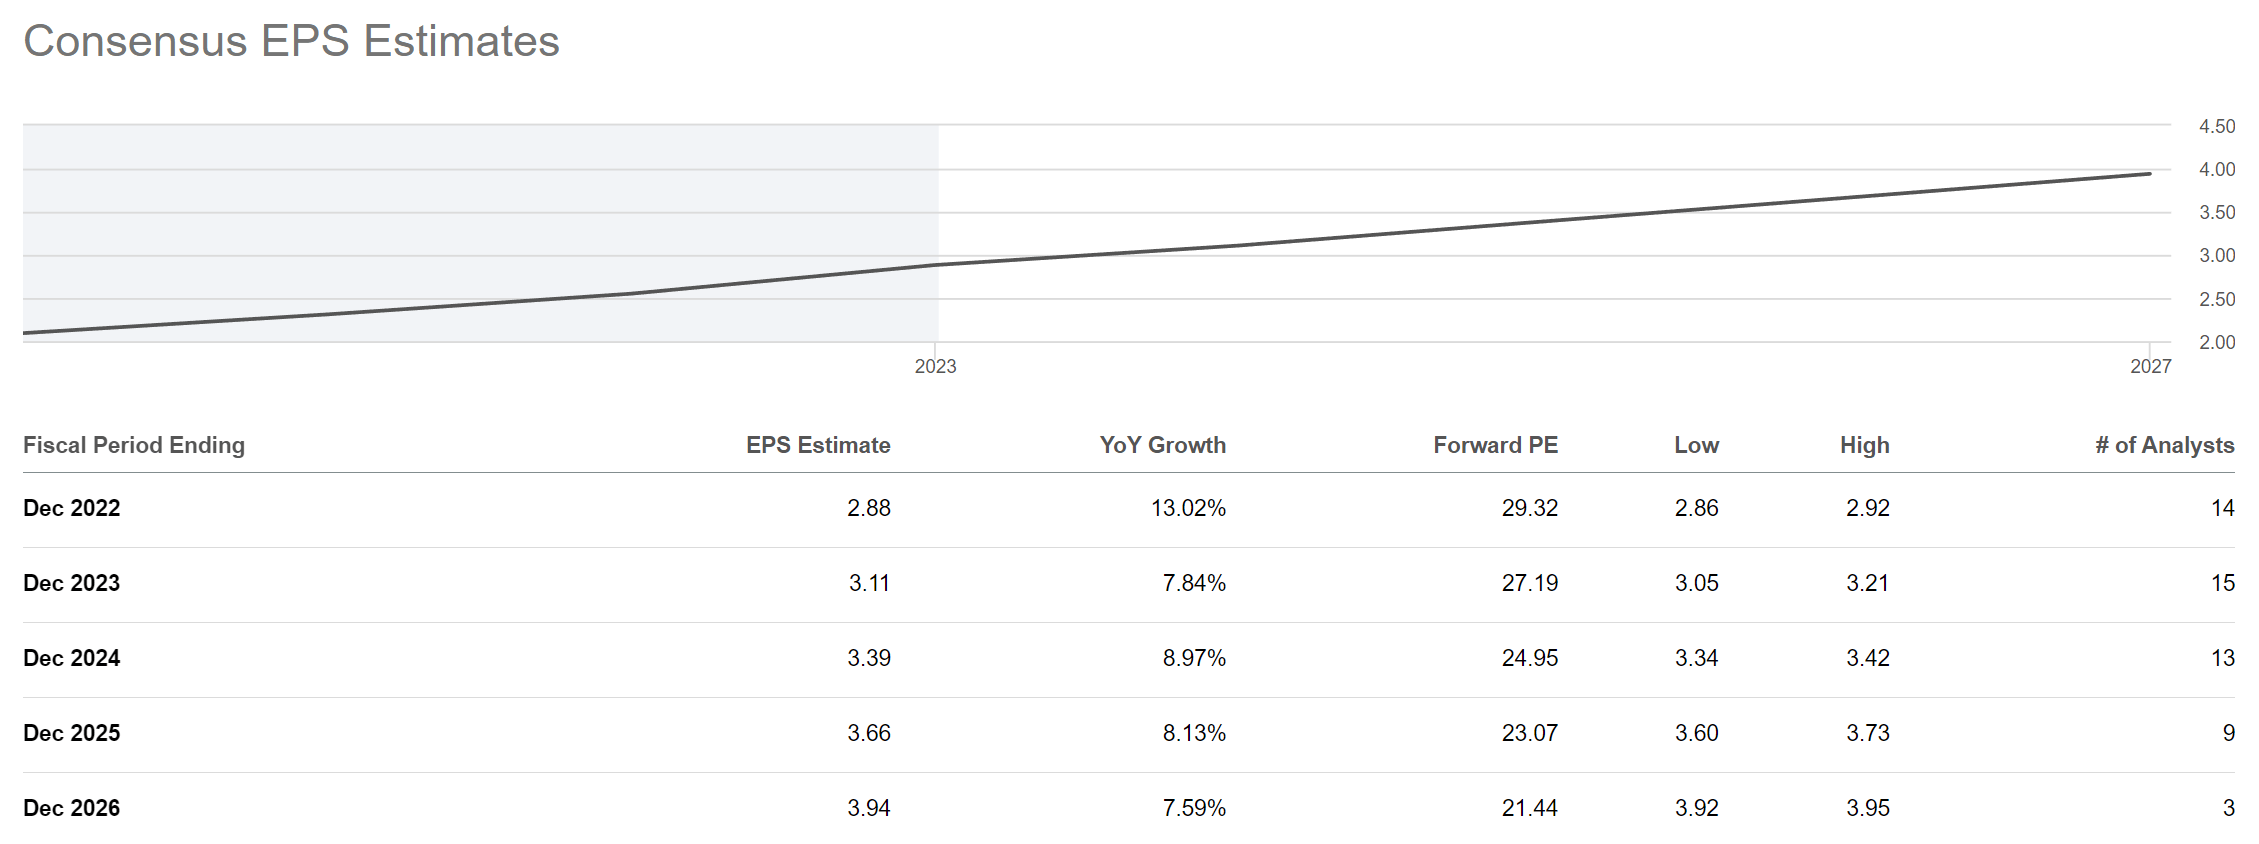
Figure 10 – NEE EPS growth estimates (Seeking Alpha)

Figure 11 – Utility sector EPS growth estimates (yardeni.com)
I believe NEE’s valuation is inflated due to its ‘ESG’ credentials, and may not be sustainable in the long run as renewable power generation becomes more commonplace.
Conclusion
While the XLU ETF was an excellent place to hide in 2022, as we head into 2023, there are several headwinds that investors should consider. First, the utility sector is trading at multi-decade high valuations of ~20x Fwd P/E. Second, relative to the market, utilities have gone from ‘cheap’ to ‘expensive’. Finally, XLU’s largest weight, NEE, trades at 1.8 times the sector’s median Fwd P/E multiple, yet has earnings growth less than the sector average.
While the XLU may still outperform the market in a risk-off scenario, absolute returns may be harder to achieve in 2023.
Be the first to comment