

Pgiam/iStock via Getty Images
Investment Summary
As we continue to move up in the quality spectrum here at HBI there’s still a need to refocus the lens on specific equity factors within our allocations. Balanced portfolios, especially those with a weighting to alternatives, have performed well in FY22 as both a stabilizer of returns and defender of alpha. Cash, with its embedded optionality, has plugged the hole for many portfolios, and now offers c.4% in the form of T-bills and other money market instruments. Within the equity portion of the risk budget, however, it’s been defensive, low-gamma names that have fulfilled the void in this regard in FY22. These stocks have acted as a defensive overlay of the equity bucket for investors, thereby clamping equity beta and stabilizing losses. Question is, what names do we have on offer within our coverage universe that fit this label?
One name we’ve investigated heavily with the above principles in mind is Utah Medical Products, Inc. (NASDAQ:UTMD). You can see in Exhibit 1 that, despite the S&P 500’s rally and reversal from FY20, UTMD stock continues to trade within narrow, flat range, with the exception of late FY21, where prices rallied and levelled within the space of a month. At the same time, UTMD’s equity beta remains within range and relatively low. Here we’ll discuss our findings to indicate whether UTMD fills the role as a defensive overlay to equity portfolios.
Exhibit 1. UTMD price evolution, equity beta, versus S&P 500 from FY19-date
Data: Updata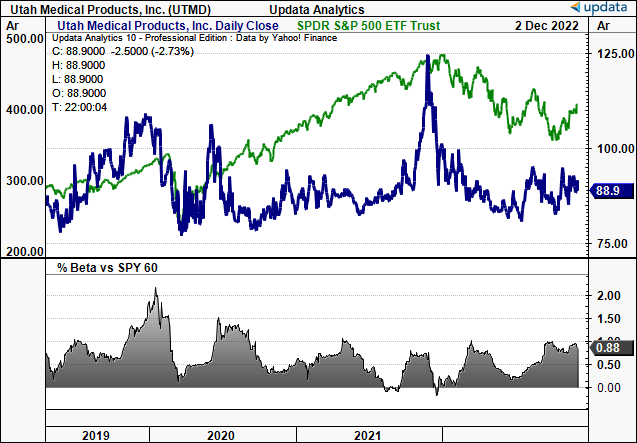
Q3 financial results: demonstrates why stock trades flat
Turning first to the numbers, we’d note it’s been a robust performance from UTMD in both Q3 FY22 and for the entire YTD. In that vein, we’ll examine both the Q3 results and the results for the 9 months (“9M”) to date in FY22.
UTMD has experienced a successful third quarter and nine-month period of 2022 in terms of worldwide consolidated sales. Total revenue of $12.95mm came in 300bps higher YoY, and it pulled this down GAAP EPS of $1.18.
UTMD also recognized a 19% headwind to total Q3 turnover, and a 24% headwind to 9M revenue. In constant currency terms, Q3 sales would have been up 6% YoY and 9M 2022 sales up 10% compared to 2021. Higher manufacturing costs – particularly in incoming freight on raw materials – have been largely a result of UTMD’s decision to purchase larger quantities of raw materials in order to gain available quantity discounts, and hedge against any potential future cost inflation.
The effects of the pandemic have lingered, however, at the same time the war in Ukraine has had no direct impact on UTMD or its subsidiaries. Despite a decrease in gross profit margins and an increase in litigation costs, the 38% operating income margin in 9M 2022 compared to 9M 2021 demonstrates that UTMD has been able to successfully respond to the challenges presented in our opinion.
Moving to the geographical and operational highlights, we noted the following:
- Total worldwide Q3 FY22 sales were 300bps higher than in Q3 2021 and 590bps higher in terms of constant currency terms. In both periods, total worldwide revenues increased for all 4 major product categories, despite a stronger USD. The only exception was gynecology sales, which fell by less than 100bps for the same 9M period in 2021.
- We noted that domestic sales were 11.2% higher, while outside US (“OUS”) sales were 10.0% lower for the period.
- UTMD also separated its Filshie device sales from other medical device sales due to their significance and acquisition history. It was acquired of CooperSurgical (CSI) in FY19. Direct Filshie device sales represented ~17% of total domestic sales, fell 440bps YoY.
- Direct other device sales contributed ~47% of total domestic sales, and climbed 920bps YoY higher in Q3 2022. Further, original equipment manufacturer (“OEM”) sales grew 24% YoY, and attributed 35% to domestic revenue.
- Meanwhile, we saw that OpEx margin was flat at 23.5% of sales vs. 23.7%Q3 2021. Hence, it was no surprise to see operating income in Q3 2022 being $5.14mm or a 39.7% margin. For the 9M to date in 2022 UTMD has seen a cumulative $14,72mm in operating income – also38.0% of sales.
- Finally, we also observed CapEx for the 9M lift to $771,000 for the period, up from $299,000 the year period.
You can see a broader look at UTMD’s operating summary from FY16-date in Exhibit 2. In particular, the 7.71% trailing FCF yield is attractive, whilst revenue, core EBITDA remain in their cyclical uptrend for the company. These are defensive characteristics in our estimation.
Exhibit 2. UTMD continues to ratchet up revenue, core EBITDA, and investors can still buy the stock at a 7.71% trailing FCF yield.
Data: HBI, Refinitiv Eikon, Koyfin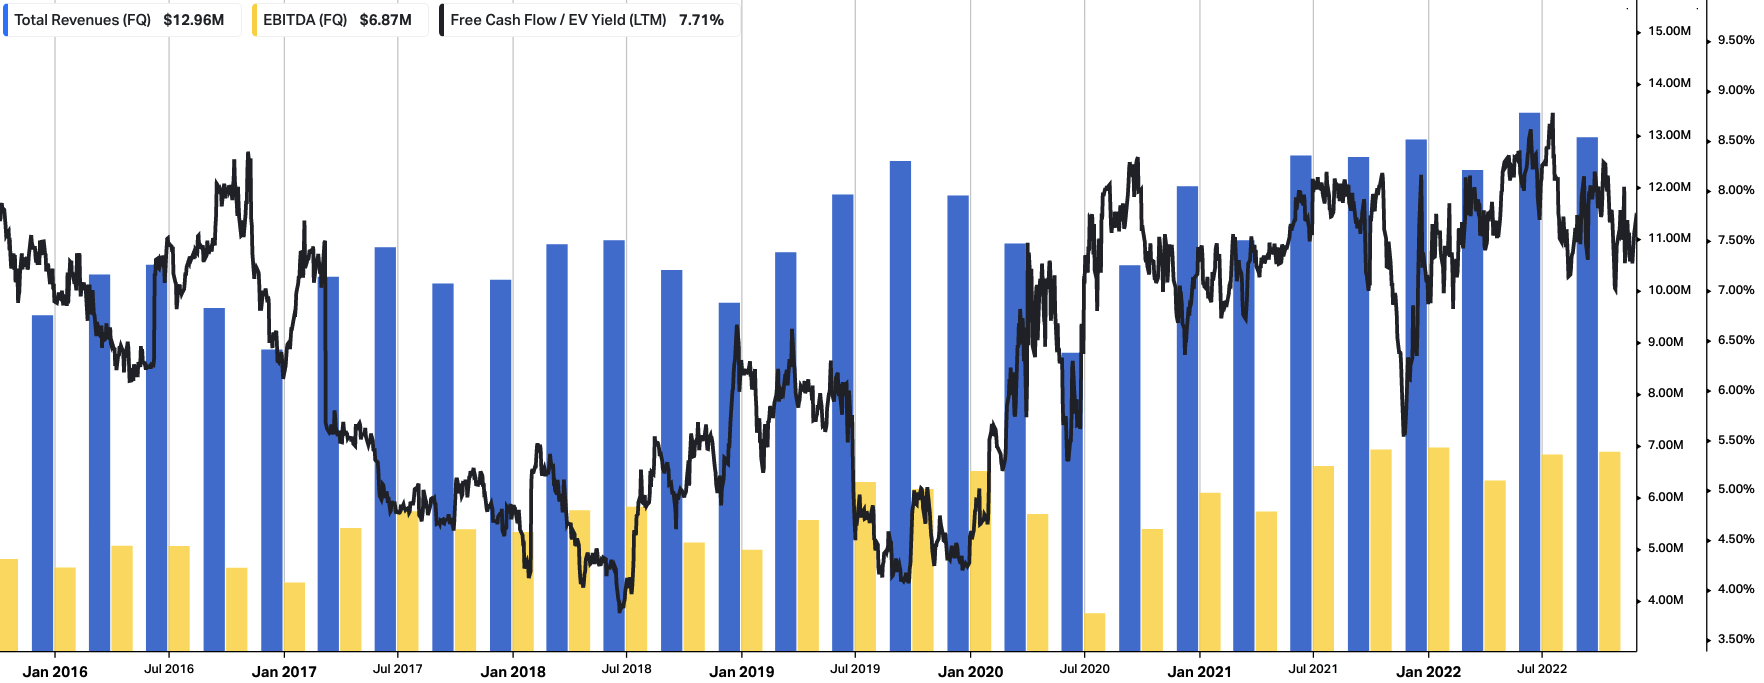
Along the same lines, you’ll note below that both return on capital employed and free cash flow have shown a positive relationship since FY20. As the level of FCF shifts down, the level of return on capital is gradually curling up, currently pushing 11.35% on a TTM basis.
With no debt on the balance sheet, the company’s WACC is 4.33%, therefore the company’s return on capital easily outpaces the cost of capital hurdle in this instance.
Exhibit 3. Positive coupling between return on capital and free cash flows, with the former curling up since FY21.
Data: HBI, Refinitiv Eikon, Koyfin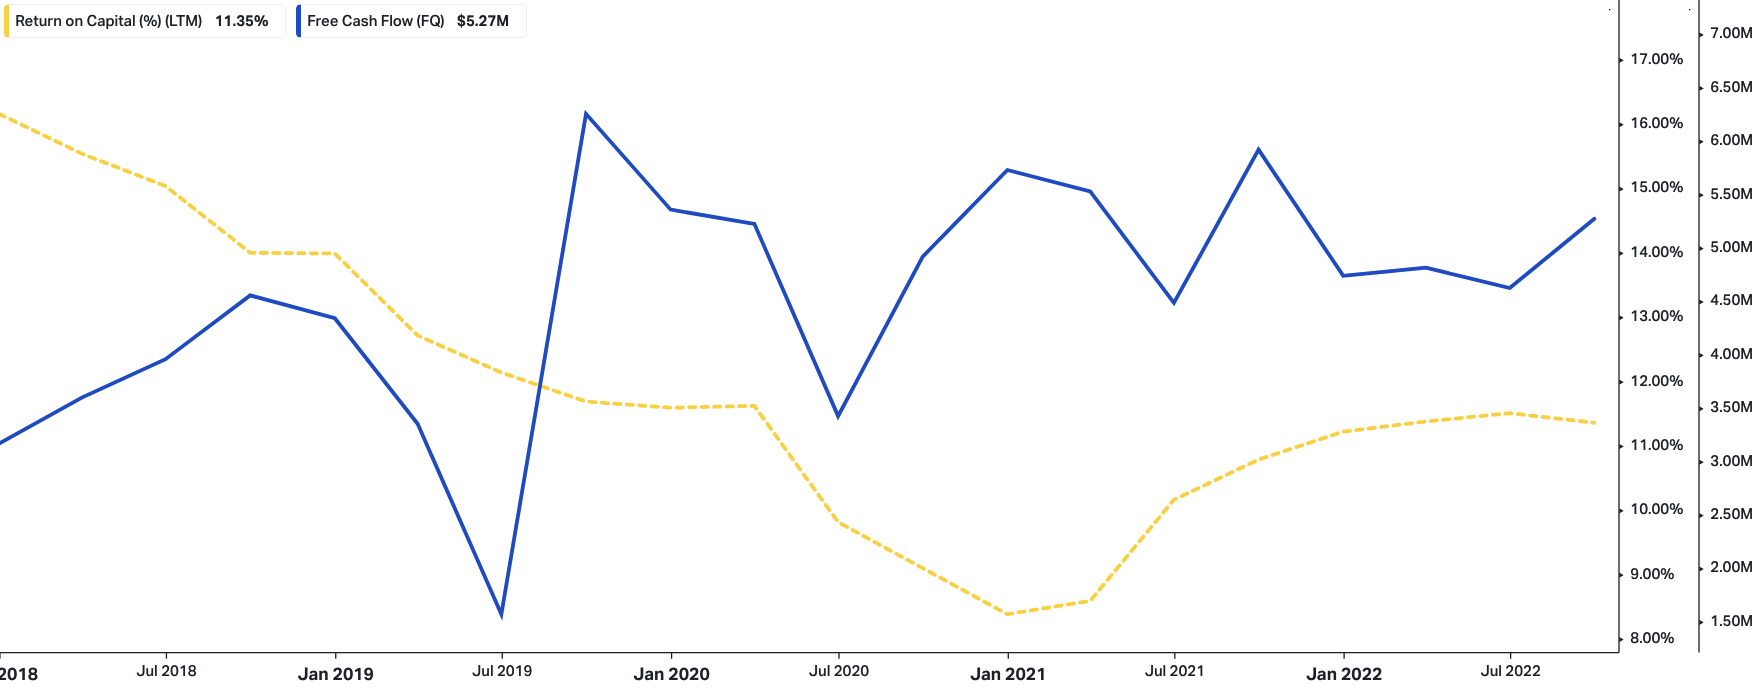
UTMD into equity portfolios as defensive overlay
So the question becomes, therefore, how does UTMD fit within an equity allocation as a defensive cover.
To decide, this, the following series of charts and tables will help us understand.
First, considering our FY22 EPS estimates of $4.59, we see the stock fairly valued at 21.21x forward earnings. Assigning the multiple to our estimates derives a price target of $97,~5% upside potential, which is the first tick of approval.
Exhibit 4. Fair forward P/E x $4.59 = $97.40
Note: Fair forward price-earnings multiple calculated as 1/fair cost of equity. This is known as the ‘steady state’ P/E. For more and literature see: [M. Mauboussin, D. Callahan, (2014): What Does a Price-Earnings Multiple Mean?; An Analytical Bridge between P/Es and Solid Economics, Credit Suisse Global Financial Strategies, January 29 2014] (Data: HB Insights Estimates)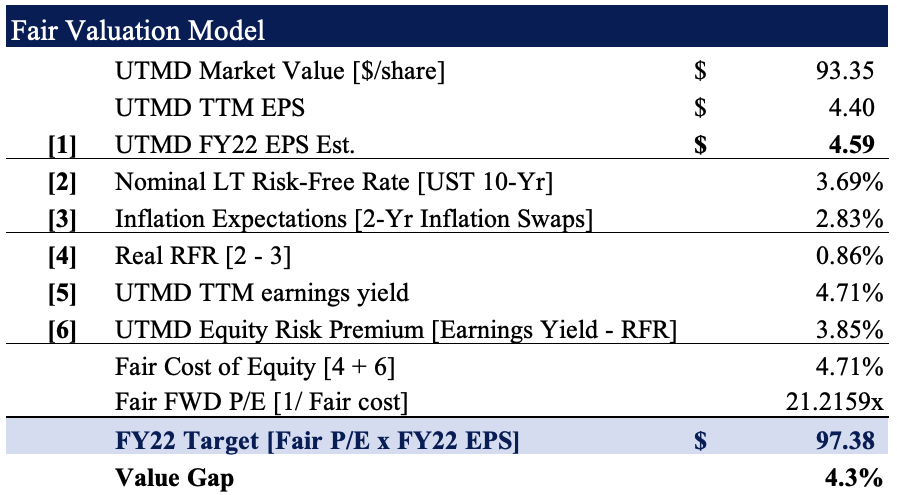
Second, we have technical targets showing a wide breadth of $68 all the way $123. With the breadth of these targets in mind, we opine there is good support from either end of the buying/selling spectrum, which suggests a lack of movement to the upside or downside when looking ahead. Again, this is a defensive characteristic that mitigates market risk in our opinion.
Exhibit 5. Breadth of price technical targets wide, with emphasis on the stock continuing its sideways price distribution
Data: Updata.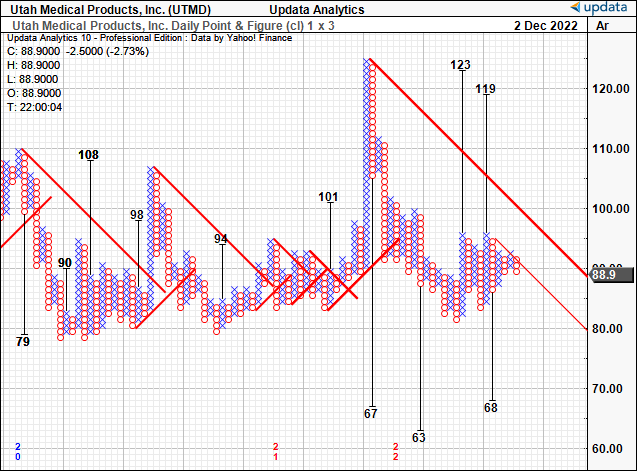
Last, we performed portfolio backtesting to gauge how UTMD fits in a cross asset portfolio with concentration in equities. If you presume the next 3-6 months will look similar to the previous 3-6, then this test has validity. As you can see in the chart series below, the balanced portfolio [portfolio 1] has outperformed in FY22, especially against the SPX.
Looking to UTMD’s inclusion at equal-weight [portfolio 2], the changes are negligible, albeit with a better 7.4% max drawdown and slightly lower negative 3% return. However, standard deviation and market correlation are within the bounds of Portfolio 1. Similar results are seen when weighting UTMD all the way down to 2% of the equity risk. Compared to the benchmark, these results are indicative of the stock’s defensive characteristics to one’s equity book.
Exhibit 6.
Data: HB Insights, Portfolio Visualizer Data: HB Insights, Portfolio Visualizer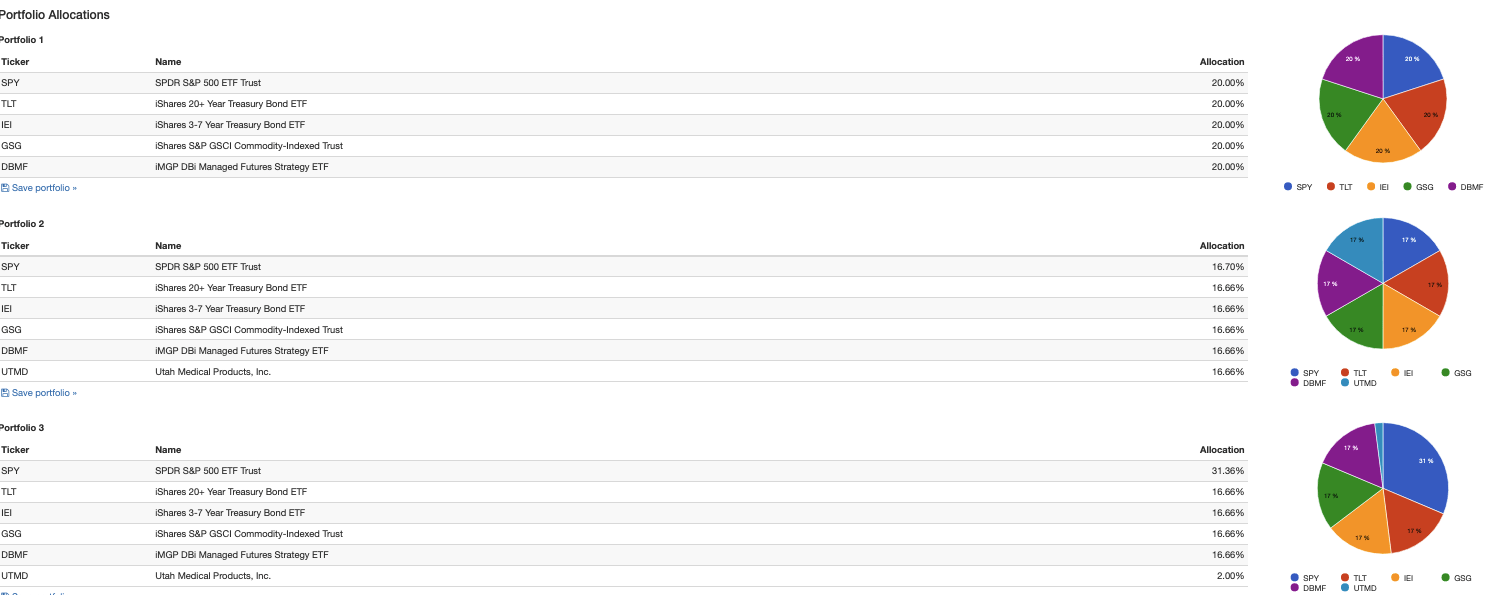

Exhibit 6a.
Data: HB Insights, Portfolio Visualizer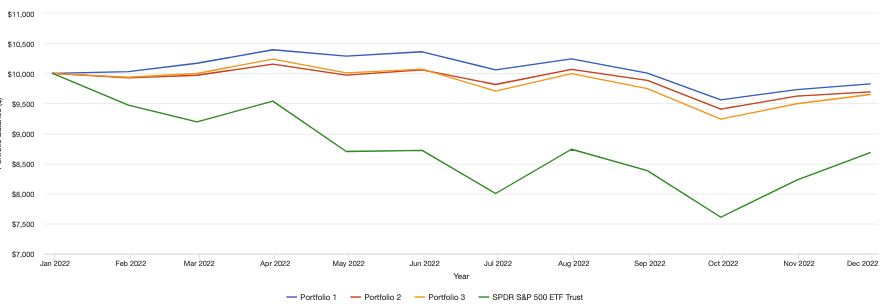
The important thing to take from this assessment is, UTMD justifies its inclusion into an equity-focused portfolio setup as a defensive overlay, in our opinion. It does this by keeping equity beta low, reducing max drawdown and standard deviation, whilst stabilizing losses to 3-3.5% without much additional equity risk when included into a hypothetical portfolio. Hence, we rate UTMD a buy with this intention in mind.
Be the first to comment