

curraheeshutter
It’s make or break time for crude oil. Do you think that is too dramatic? I will lay out the case here momentarily, but The United States Oil Fund (NYSEARCA:USO) is a popular vehicle to trade near-term moves in WTI crude oil.
The Energy Select Sector SPDR ETF (XLE) is currently beating USO by nearly the most since the start of the year. Who’s right? The equity traders or the commodity traders? I assert that keeping tabs on what’s happening with oil is the smart play right now.
XLE Beating USO In The Last Two Months
StockCharts.com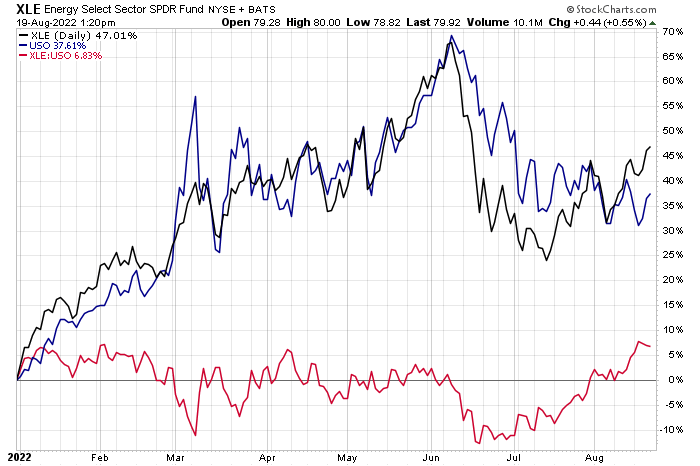
According to USCF Funds, USO is an exchange-traded security whose shares may be purchased and sold on the NYSE Arca. USO’s investment objective is for the daily changes, in percentage terms, of its shares’ net asset value (NAV) to reflect the daily changes, in percentage terms, of the spot price of light sweet crude oil delivered to Cushing, Oklahoma, as measured by the daily changes in the Benchmark Oil Futures Contract.
Black gold has been under its pivotal 200-day moving average for a few weeks now, and we are approaching the heart of hurricane season. It used to be that a series of tropical systems in the Gulf of Mexico could bring about serious cuts to domestic oil production. In recent years, however, ample supply meant temporary offshore production interruptions meant little upside to the front-month price of WTI. That could be different this year now that the supply/demand situation is much more bullish (as evidenced by a backwardated forward curve).
Unfortunately for the bulls, the tropics are incredibly quiet given the time of the year. Both NOAA and Colorado State University had predicted one of the most active tropical Atlantic hurricane seasons on record, but warmer than anticipated eastern Pacific waters and a series of major Saharan dust storms have left the tropic’s Main Development Region (MDR) as quiet as a mouse in the last month. In fact, this has been among the longest stretches without a named tropical storm in the last 30 years.
A Check On The Tropics: No Serious GoM Threats On The Horizon
Weathernerds.org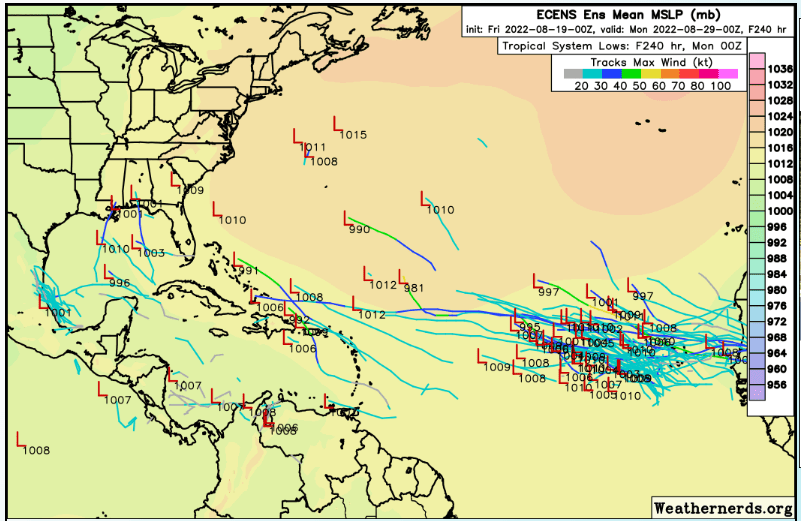
Away from the weather, backwardation in the oil’s term structure is a bullish factor to consider. Backwardation happens when near-dated contracts are more expensive than later-dated contracts. You might think, “But doesn’t that mean the market is bearish since it expects cheaper prices ahead?” I say ‘no’ because it is more of an indicator of a bullish supply/demand balance, putting upward pressure on the market. While WTI’s term structure has flattened a bit, I still see this as a bullish signature.
WTI’s Bullish Backwardation
Yardeni Research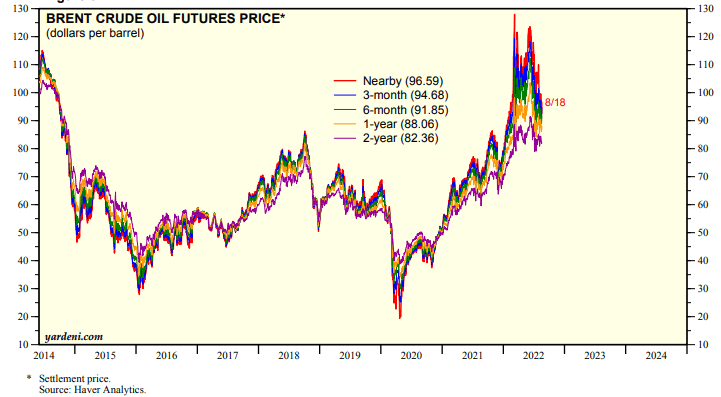
As a technician, I like to monitor what’s happening with both the charts and the seasonal trends. According to Equity Clock, WTI tends to top out for the year now through the middle of October. So the next two months are usually not a great time to put on an intermediate-term bullish position in oil. Seasonality, though, is just a secondary indicator to what is most important: price.
Oil Seasonality: Flat Through October
Equity Clock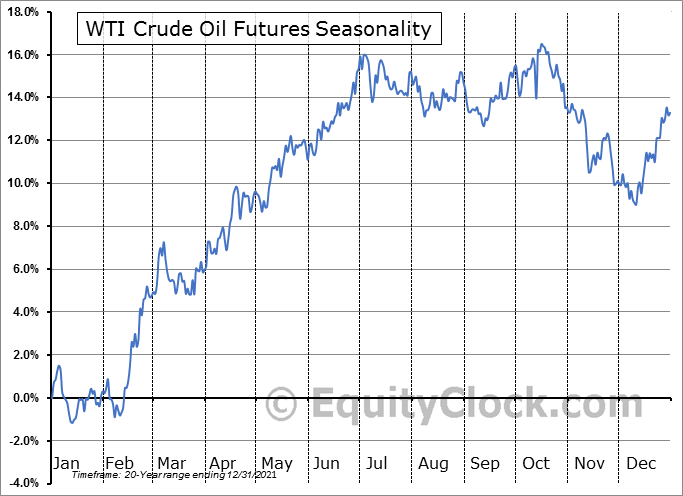
Here is how I view the market technically right now: we are indeed in no man’s land. WTI (which should be how you analyze the U.S. oil market, not USO directly) has been under its flat 200-day moving average since the calendar flipped to August. That is bearish.
But the bulls point to how nicely the front-month of oil held its November 2021 highs near $85 on a recent pullback. That’s a key spot WTI must defend. I would be bullish on oil above the mid-$90s and would suggest short trades if we see oil break below $85.
WTI Crude Oil 2-Year Technical Chart: Watch For A Breakout or Breakdown
StockCharts.com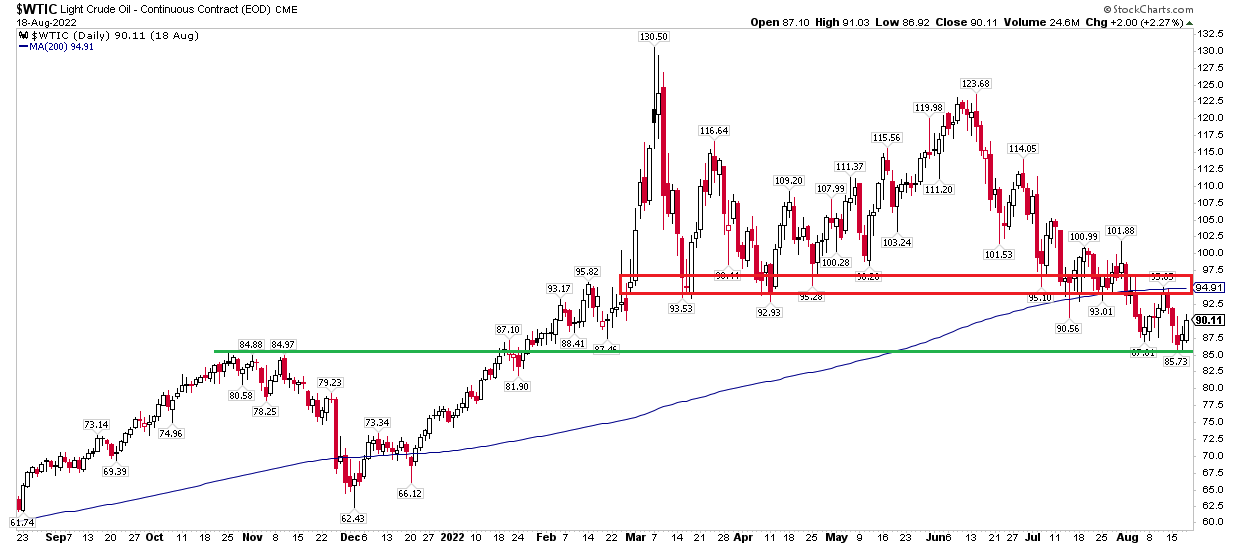
Bonus Topic: Gasoline Prices
Pivoting from oil and where USO might be headed, everyone wants to know where pump prices are going. RBOB gasoline futures, which can be traded through the UGA ETF, seem to have attracted buyers in the high $2s. That means the national retail pump price average might bottom out here around $3.90. There’s typically a 90-cent spread over RBOB at which the national gas price average arrives after a few weeks’ lag. Contributing factors to a higher spread over the years include higher regulatory and input costs, higher taxes, and more recently, seasonality, according to Bank of America Global Research.
RBOB-Retail Pump Price Spread History
BofA Global Research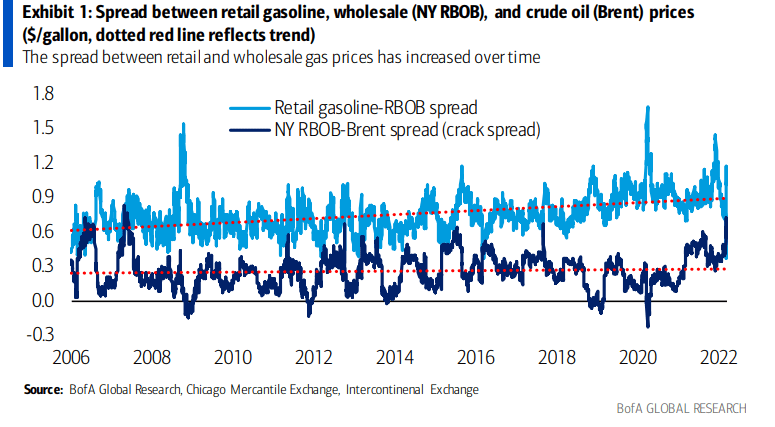
Be the first to comment