

Marc Dufresne/iStock via Getty Images
The Principal U.S. Mega-Cap ETF (NASDAQ:USMC) is an actively managed investment vehicle, with the portfolio calibrated using the proprietary model. Holdings are “expected to be rebalanced at least annually” as said in the prospectus.
This ETF stands out in the low volatility universe as a product that I would call ‘in-between.’ It offers a peculiar concentrated mix of mega-cap growth and value names with a tilt towards those that are less prone to frenetic price swings. This is a rare factor combination heavy in quality, yet with one major downside. Names the fund selects for its portfolio are inherently overpriced, which is a perennial issue for the mega-cap league and especially for the IT sector the ETF is enamored of, and I am uncertain whether the low volatility factor will somewhat reduce the rich valuation risk going forward. More likely, if the market sees another leg down, it will help only marginally, as multiples are of much greater importance.
Investment strategy
The issue with this ETF is that it changed its strategy in June, abandoning the Nasdaq US Mega Cap Select Leaders Index to select picks for the portfolio actively relying on a proprietary framework.
Yet I believe we still can use its past performance data with due caution since the rules lying at the crux of its current strategy do bear resemblances with the index.
For example, the prospectus says the fund favors “the top 50th percentile of the S&P 500 Index,” which it considers the mega-cap universe. To qualify for the index it used in the past, a company must “be in the top 50th percentile of the Nasdaq US 500 Large Cap Index by aggregate company market cap.”
Also, it is still volatility-focused as the top 10% of the holdings are weighted using the market cap, and the remaining are assigned weights “based on financial strength to reduce volatility.” The index from Nasdaq is also volatility-adjusted. And yes, USMC does hold a large share of low-beta equities. According to my analysis using data from Seeking Alpha, around 48% of its net assets are invested in stocks with 24-month betas of less than 1, from 0.22 in the case of Verizon (VZ) to Linde’s (LIN) 0.99.
Besides, the portfolio remains rather concentrated. In March 2022, according to the page saved by the Wayback Machine, the fund was long 47 equities, and now it holds just around the same amount, 42. The top ten investments account for close to 38% vs. almost 37% when the fund was passively managed. Apple (AAPL) retained the top spot, with a 7.4% weight vs. 6.6% in March.
So why the ETF is in-between? Since it bears resemblances with both pure low-volatility and growth-heavy plays. Let us illustrate this with the data covering the November 2017 – August 2022 period.
Created by the author using data from Portfolio Visualizer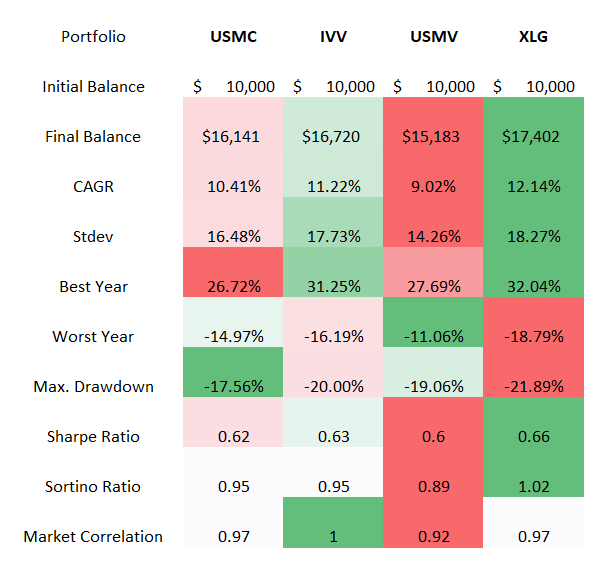
Investors who bought into the fund shortly after its inception saw returns weaker than what the iShares Core S&P 500 ETF (IVV) and similarly concentrated Invesco S&P 500 Top 50 ETF (XLG) delivered, yet not that soft compared to pure low volatility plays that were unable to capitalize on the pandemic rally. At the same time, its standard deviation is below IVV but ahead of iShares MSCI USA Min Vol Factor ETF (USMV). In terms of drawdowns, it is clearly superior to all the ETFs selected.
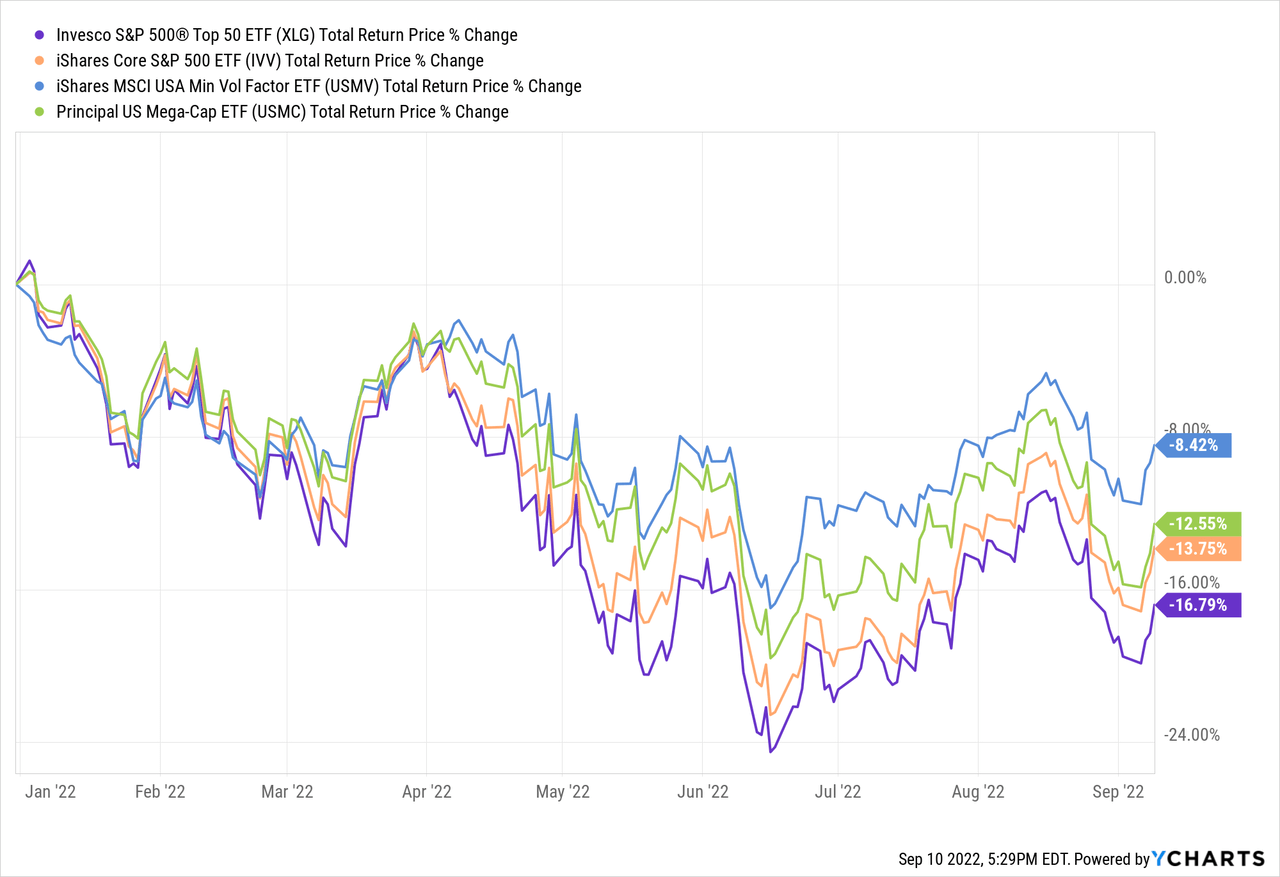
During calamitous 2022, USMC has delivered a similar result, not as good as USMV which has been more resilient against the growth premia issue yet not as poor as IVV and especially XLG. Again, in-between.
For better context, below is the total return it has delivered since July 1, with the new strategy. A picture to be expected. As bulls retook control in July, most growth-heavy funds, IVV included, took off, while those favoring less volatile equities lagged a bit.
Seeking Alpha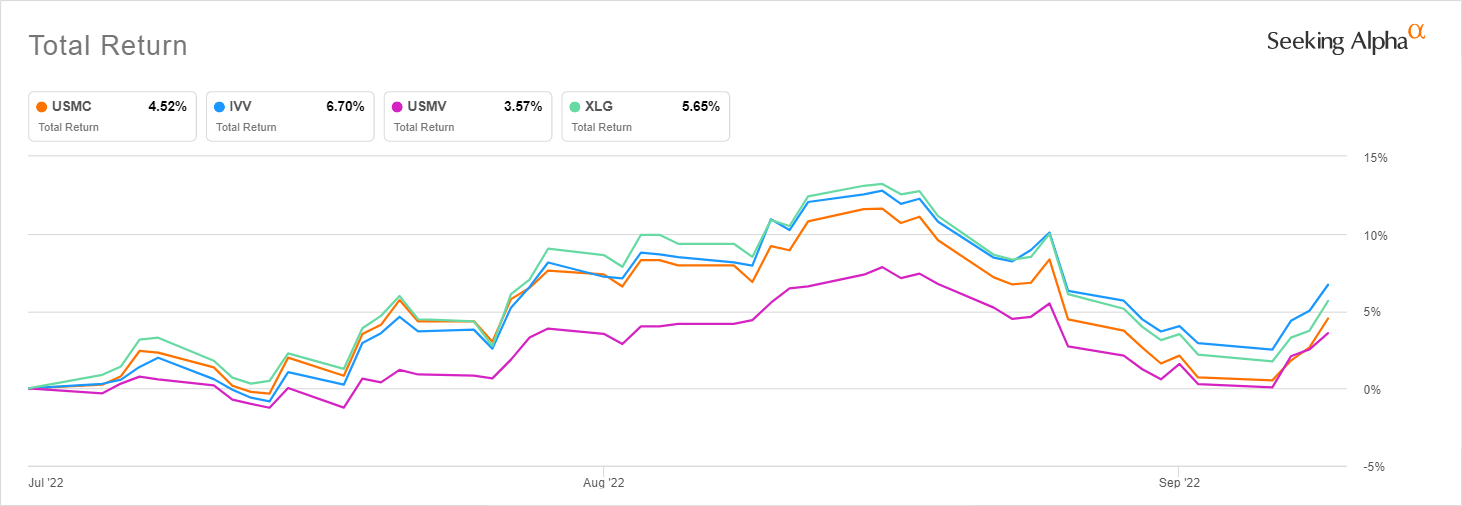
What is the major issue with USMC?
USMC is concentrated, IT-heavy, and overpriced. This is how its sector allocation compares to IVV, XLG, and USMV.
Created by the author using data from the funds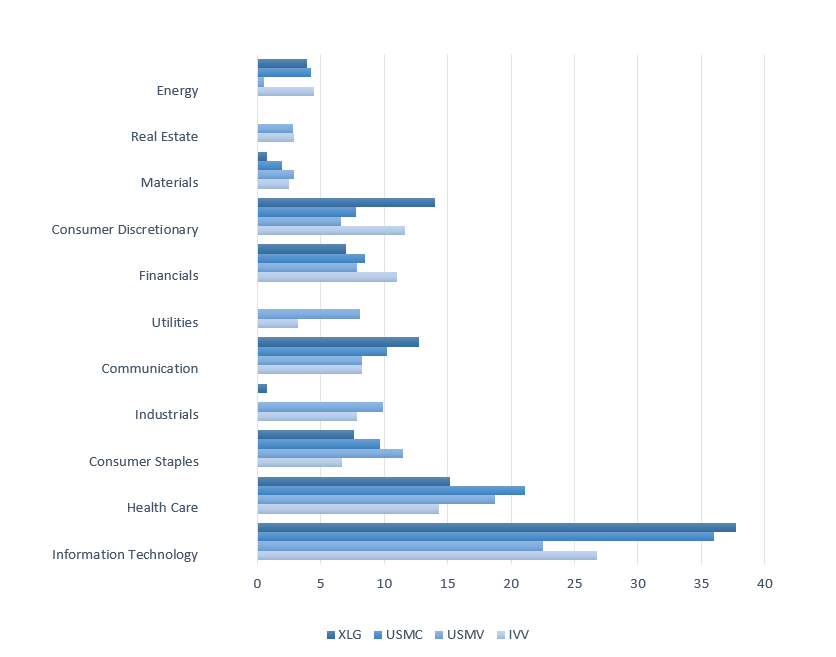
It is almost as heavy in tech as XLG, with no industrials (in XLG they account for a measly 79 bps), no utilities, and no real estate.
When I see a sector allocation like that, I expect the overvaluation issue to be uncovered upon deeper inspection. When I say overvaluation, I mean that 66% of its holdings have a D- Quant Valuation grade or worse, like Danaher (DHR) or Mastercard (MA) that both trade at such overinflated levels compared to their respective sectors so they earned an F grade, the worst possible. Those that are relatively undervalued (B- or better) account for just around 7%.
Meanwhile, USMC is grossly overweight in high-quality stocks. This is a mega-cap mix with market values ranging from $2.48 trillion to $126.3 billion, and solid profitability is something that is typical for companies that large. To corroborate, over 92% of the holdings have an A+ Profitability grade, while even B-rated stocks are simply absent. This partly explains why the mix is so expensive, yet does not imply it is a Buy.
Final thoughts
U.S. equity investors seeking safety amid the bouts of anxiety this year do have reasons to extend their footprint in the low volatility universe. Yet not all low volatility ETFs are created equal.
The IT-heavy concentrated growth/value portfolio paying due attention to lower volatility looks justly interesting, yet I am of the opinion USMC is a suboptimal play, as its tilt towards stocks that do deliver calmer price dynamics can barely outweigh the overvaluation issue, which is embedded in the equity upper echelon. The truth is, bruised stocks staged a fairly decent rebound in the summer supported by the abating inflation narrative, yet this by no means implies the horizon is entirely cloudless as capital scarcity and reeling supply chains have not evaporated overnight. And the post-Jackson Hole symposium sell-off brilliantly demonstrated how fickle bouts of bullishness could be.
That is to say, I maintain my positive view on the quality/value mixes, which I anticipate to be clear winners both in the current environment and over the long term, and USMC cannot qualify for a bullish rating since it has trace amounts of value, even though it is grossly overweight in exceptionally profitable names.
In the past, USMC’s strategy allowed it to reduce drawdowns somewhat, but its potential to shield portfolios amid broad market softness is much weaker compared to USMV, for example. At the same time, there is a risk USMC will marginally underperform IVV during the phase of robust market recovery due to the exact same reason that has protected it against a steeper decline this year.
That being said, I like USMC’s fairly small expense ratio, especially considering it is an actively managed fund; it is even below the ER of the BTC iShares MSCI USA Quality Factor ETF (QUAL), which charges 15 bps annually vs. USMC’s net expense ratio of 12 bps. It is also nice to see around $1.2 billion in AUM, even though we see worrisome flows trends.
So it can be used as a comparatively cheap vehicle for exposure to the quality factor. At the same time, I do not see reasons strong enough to short this ETF at the current levels assuming elevated uncertainty.
Be the first to comment