

Edwin Tan/E+ via Getty Images
By Daniel Prince, CFA
Three Takeaways
- Recent stock market volatility has proven why diversification is important and can help reduce risk in portfolios.
- Index funds can help all investors diversify at the single-stock and portfolio levels, including asset allocation ETFs.
- Investors can consider using iShares Core ETFs to build a low cost, diversified portfolio as they pursue their long-term investing goals.
Historians, economists, and social scientists will long study the last decade for lessons on human behavior. For the average investor, though, a key lesson already stands out: There’s wisdom in diversification.
Diversification is the practice of not holding all your eggs in one basket, thereby owning a mix of stocks with different business activities, as well as other investments like bonds. This cornerstone investment principle was born in the 1950s, helped spur the advent of index mutual funds in the 1970s, then drove the rise of index-tracking exchange-traded funds (ETFs) starting in the 1990s.1
Index funds give all investors simple and low-cost access to diversified investment strategies and, in recent decades, helped individuals move from owning individual stocks, which bring with them unique and concentrated risks, to increasingly global strategies spanning stocks, bonds and more. Take iShares Core ETFs as an example, which allows investors to build a low cost, diversified portfolio with as little as one fund.
So, what has diversification and index funds done for investors recently?
Spreading The Risk Around Through Diversification
Over the last few years, investors have been whipsawed by unprecedented market events. Steep declines tied to COVID-19 were followed by a sharp rebound in U.S. stocks, only to give way to losses driven by inflation and slowing growth. In fact, the first four months of 2022 marked the 3rd worst start to a year for U.S. stocks since 1926.2
Despite this wild ride, over the last five years, patient investors have been rewarded as U.S. stock indexes have risen over 80%.3 But, while the market has gone up, not all stocks have been a good investment. 36% of U.S. stocks declined during that same period, meaning investors picking stocks from the broad market had a greater than one out of three chances of selecting a loser. And many of the stocks that fell, fell hard. Among the U.S. stocks that declined over the last five years, the average drop was 52%.3 In other words, one in three stocks lost half their value. If buying single stocks, it could have been easy to be a loser in a winning market.
Don’t be a loser in a winning market
Doughnut chart showing the percentage of U.S. stocks that have gone up vs. down in value over the last five years (through 5/31/2022). (Morningstar as of 5/31/2022. Market return is represented by the S&P US Total Market Index, using cumulative total return which assumes the reinvestment of dividends. Past performance is not indicative of future results. Indexes are unmanaged and one cannot invest directly in an index.)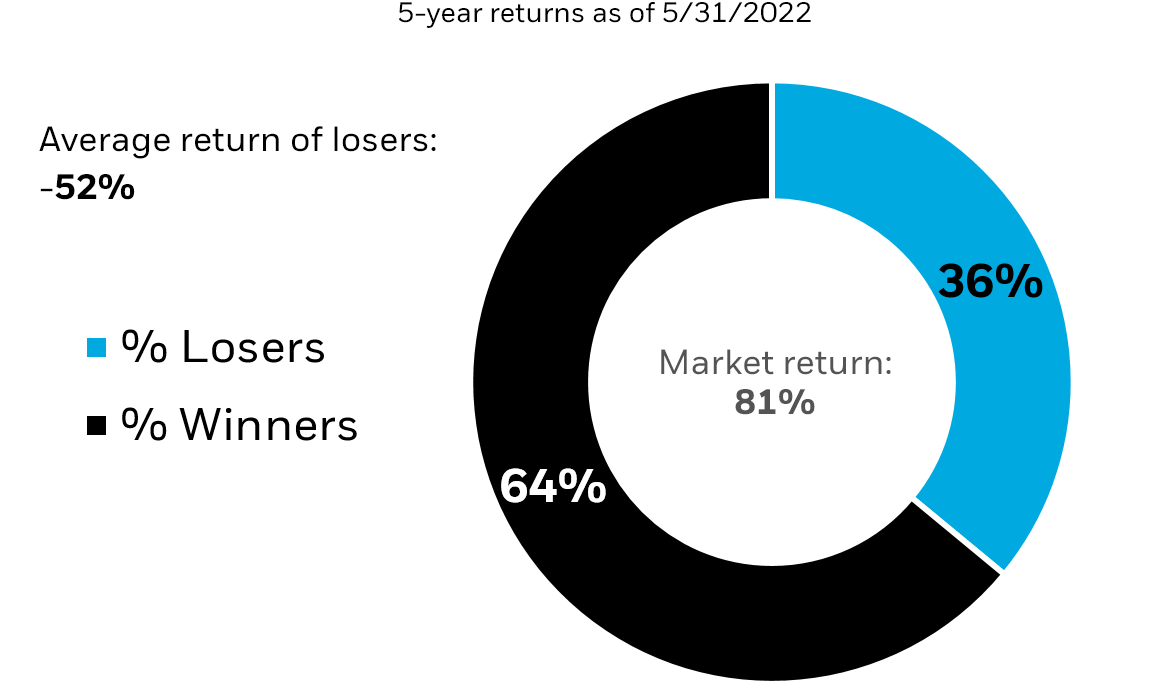
Winners & Losers
Over the last few years, the pendulum has swung dramatically between market leaders and market laggards. The COVID-19 sell off disproportionately impacted airlines and hotels as stay-at-home darlings like Zoom Video Communications and Peloton reigned supreme.4 When doors began to reopen and inflation rose at levels unseen in decades, the tech darlings sold off in dramatic fashion while unloved sectors from years past, like energy, were resurrected. In fact, energy was the worst-performing sector in four of the last five years but is outperforming the market by a whopping 70.8% in 2022 through the end of May.5
Bar charts showing the YTD (through 5/31/2022) and calendar year returns of U.S. technology stocks and U.S. energy stocks relative to the U.S. stock market. Positive numbers indicate outperformance while negative numbers indicate underperformance. During the time period measured, energy was the worst performing sector in four of the last five years but is outperforming the market by 70.8% in 2022 through the end of May. (Morningstar as of 5/31/2022. U.S. stock market represented by the S&P 1500 index, Technology represented by the S&P 1500 Information Technology index and Energy represented by the S&P 1500 Energy index. Using total return which assumes the reinvestment of dividends. Index performance is for illustrative purposes only. Index performance does not reflect any management fees, transaction costs or expenses. Indexes are unmanaged and one cannot invest directly in an index. Past performance does not guarantee future results)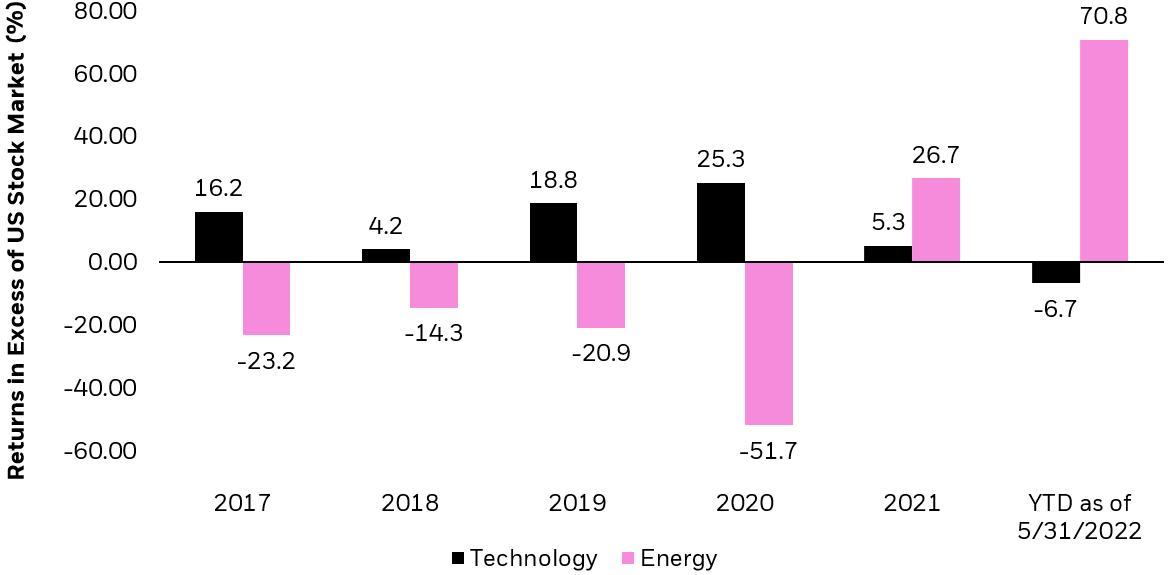
Keeping An Eye On The Long-Term
The point is that successfully timing the market with individual securities or even whole sectors – buying and selling at just the right times – is difficult even for the most experienced investor. In fact, chasing the latest high-flying investment can cause harm to a portfolio’s long-term returns. Some index ETFs can hold the whole market, a strategy which can help investors avoid sharp declines of a few stocks or sectors.
Summing It Up
Diversification helps investors to navigate fast-changing markets and stay the course to pursue their financial goals. The past few years have offered a masterclass in how diversification through index-based ETFs could have helped the average investor avoid losing in a winning, albeit volatile, market.
© 2022 BlackRock, Inc. All rights reserved.
1 See Harry Markowitz’s 1952 thesis, Portfolio Selection, available at www.jstor.org/stable/2975974.
2 Measured by U.S. stock market returns from Jan 1 to April 30 of each calendar year. U.S. stocks represented by the S&P 500 index from 3/4/57 to 4/30/22 and the IASBBI U.S. Lrg Stock TR USD Index from 7/1/26 to 3/4/57. Past performance is not indicative of future results. Indexes are unmanaged and one cannot invest directly in an index.
3 U.S. stock market as measured by the S&P Total Market Index. Morningstar (covering period May 31, 2017, to May 31, 2022).
4 As of 5/31/2022, weights for these companies in the highlighted iShares funds are as follows: Zoom Video Communications: ITOT: 0.06%, AOK, AOM, AOR and AOA: 0.0%; Peloton Interactive Inc: ITOT: 0.01%, AOK, AOM, AOR and AOA: 0.0%. For current fund holdings, please click on the tickers under the “Related iShares Funds” section above.
5 Source: Morningstar as of 5/31/2022. The S&P 1500 Energy index underperformed all other S&P 1500 sector indexes in 2017, 2018, 2019, and 2020.
Carefully consider the Funds’ investment objectives, risk factors, and charges and expenses before investing. This and other information can be found in the Funds’ prospectuses or, if available, the summary prospectuses, which may be obtained by visiting the iShares Fund and BlackRock Fund prospectus pages. Read the prospectus carefully before investing.
Investing involves risk, including possible loss of principal.
Diversification and asset allocation may not protect against market risk or loss of principal.
Specific companies or issuers are mentioned for educational purposes only and should not be deemed as a recommendation to buy or sell any securities. Any companies mentioned do not necessarily represent current or future holdings of any BlackRock products. For actual fund holdings, please visit the respective fund product pages.
Index performance is for illustrative purposes only. Index performance does not reflect any management fees, transaction costs or expenses. Indexes are unmanaged and one cannot invest directly in an index. Past performance does not guarantee future results.
Index performance does not represent actual Fund performance. For actual fund performance, please visit www.iShares.com or www.blackrock.com.
A fund’s environmental, social and governance (“ESG”) investment strategy limits the types and number of investment opportunities available to the fund and, as a result, the fund may underperform other funds that do not have an ESG focus. A fund’s ESG investment strategy may result in the fund investing in securities or industry sectors that underperform the market as a whole or underperform other funds screened for ESG standards. In addition, companies selected by the index provider may not exhibit positive or favorable ESG characteristics.
Funds that concentrate investments in specific industries, sectors, markets or asset classes may underperform or be more volatile than other industries, sectors, markets or asset classes and than the general securities market.
Fixed income risks include interest-rate and credit risk. Typically, when interest rates rise, there is a corresponding decline in bond values. Credit risk refers to the possibility that the bond issuer will not be able to make principal and interest payments.
International investing involves risks, including risks related to foreign currency, limited liquidity, less government regulation and the possibility of substantial volatility due to adverse political, economic or other developments. These risks often are heightened for investments in emerging/ developing markets or in concentrations of single countries.
Certain sectors and markets perform exceptionally well based on current market conditions and iShares and BlackRock Funds can benefit from that performance. Achieving such exceptional returns involves the risk of volatility and investors should not expect that such results will be repeated.
Buying and selling shares of ETFs may result in brokerage commissions.
This material represents an assessment of the market environment as of the date indicated; is subject to change; and is not intended to be a forecast of future events or a guarantee of future results. This information should not be relied upon by the reader as research or investment advice regarding the funds or any issuer or security in particular.
The strategies discussed are strictly for illustrative and educational purposes and are not a recommendation, offer or solicitation to buy or sell any securities or to adopt any investment strategy. There is no guarantee that any strategies discussed will be effective.
The information presented does not take into consideration commissions, tax implications, or other transactions costs, which may significantly affect the economic consequences of a given strategy or investment decision.
This material contains general information only and does not take into account an individual’s financial circumstances. This information should not be relied upon as a primary basis for an investment decision. Rather, an assessment should be made as to whether the information is appropriate in individual circumstances and consideration should be given to talking to a financial professional before making an investment decision.
The Funds are distributed by BlackRock Investments, LLC (together with its affiliates, “BlackRock”).
The iShares Funds are not sponsored, endorsed, issued, sold or promoted by Bloomberg, BlackRock Index Services, LLC, Cohen & Steers, European Public Real Estate Association (“EPRA®”), FTSE International Limited (“FTSE”), ICE Data Indices, LLC, NSE Indices Ltd, JPMorgan, JPX Group, London Stock Exchange Group (“LSEG”), MSCI Inc., Markit Indices Limited, Morningstar, Inc., Nasdaq, Inc., National Association of Real Estate Investment Trusts (“NAREIT”), Nikkei, Inc., Russell or S&P Dow Jones Indices LLC or STOXX Ltd. None of these companies make any representation regarding the advisability of investing in the Funds. With the exception of BlackRock Index Services, LLC, which is an affiliate, BlackRock Investments, LLC is not affiliated with the companies listed above.
Neither FTSE, LSEG, nor NAREIT makes any warranty regarding the FTSE Nareit Equity REITS Index, FTSE Nareit All Residential Capped Index or FTSE Nareit All Mortgage Capped Index. Neither FTSE, EPRA, LSEG, nor NAREIT makes any warranty regarding the FTSE EPRA Nareit Developed ex-U.S. Index or FTSE EPRA Nareit Global REITs Index. “FTSE®” is a trademark of London Stock Exchange Group companies and is used by FTSE under license.
© 2022 BlackRock, Inc. All rights reserved. BLACKROCK, BLACKROCK SOLUTIONS, BUILD ON BLACKROCK, ALADDIN, iSHARES, iBONDS, FACTORSELECT, iTHINKING, iSHARES CONNECT, FUND FRENZY, LIFEPATH, SO WHAT DO I DO WITH MY MONEY, INVESTING FOR A NEW WORLD, BUILT FOR THESE TIMES, the iShares Core Graphic, CoRI and the CoRI logo are trademarks of BlackRock, Inc., or its subsidiaries in the United States and elsewhere. All other marks are the property of their respective owners.
iCRMH0622U/S-2246333
This post originally appeared on the iShares Market Insights.
Editor’s Note: The summary bullets for this article were chosen by Seeking Alpha editors.
Be the first to comment