

US Dollar Outlook:
- April is the worst month of the year for the US Dollar (via the DXY Index) from a seasonal perspective, leaving it susceptible to weakness over the next few weeks.
- USD/CHF rates have been following US Treasury yields (similar to USD/JPY), but USD/NOK and USD/SEK are acting like more risk-on/risk-off pairs.
- According to the IG Client Sentiment Index, USD/CHF has a bearish bias.
Non-Major USD-crosses Look Bearish
You’ve heard it a lot in recent days: we’re in the midst of the worst month of the year for the US Dollar. This point bears repeating because seasonal tendencies like earnings repatriation in Japan or Sweden can have a profound impact on cross-border foreign exchange flows. The macro mix of stable global bond yields, strong economic data, and falling volatility speaks to a growing appetite for risk. It’s against this backdrop that the seasonal tendency for US Dollar weakness is intriguing, as these are the conditions that typically favor US Dollar weakness during normal (e.g. non-pandemic) times.
Although given less attention than their major European contemporaries, a trio of USD-pairs warrant discussion (incidentally, two of the three pairs are minor components of the DXY Index). USD/CHF rates have been following US Treasury yields (similar to USD/JPY), but USD/NOK and USD/SEK are acting like more risk-on/risk-off pairs. If April is indeed the worst month of the year for the US Dollar from a seasonal perspective, then it may remain susceptible to weakness over the next few weeks via this trio of European currencies.

Recommended by Christopher Vecchio, CFA
Get Your Free USD Forecast
USD/NOK RATE TECHNICAL ANALYSIS: WEEKLY CHART (May 2014 to April 2021) (CHART 1)
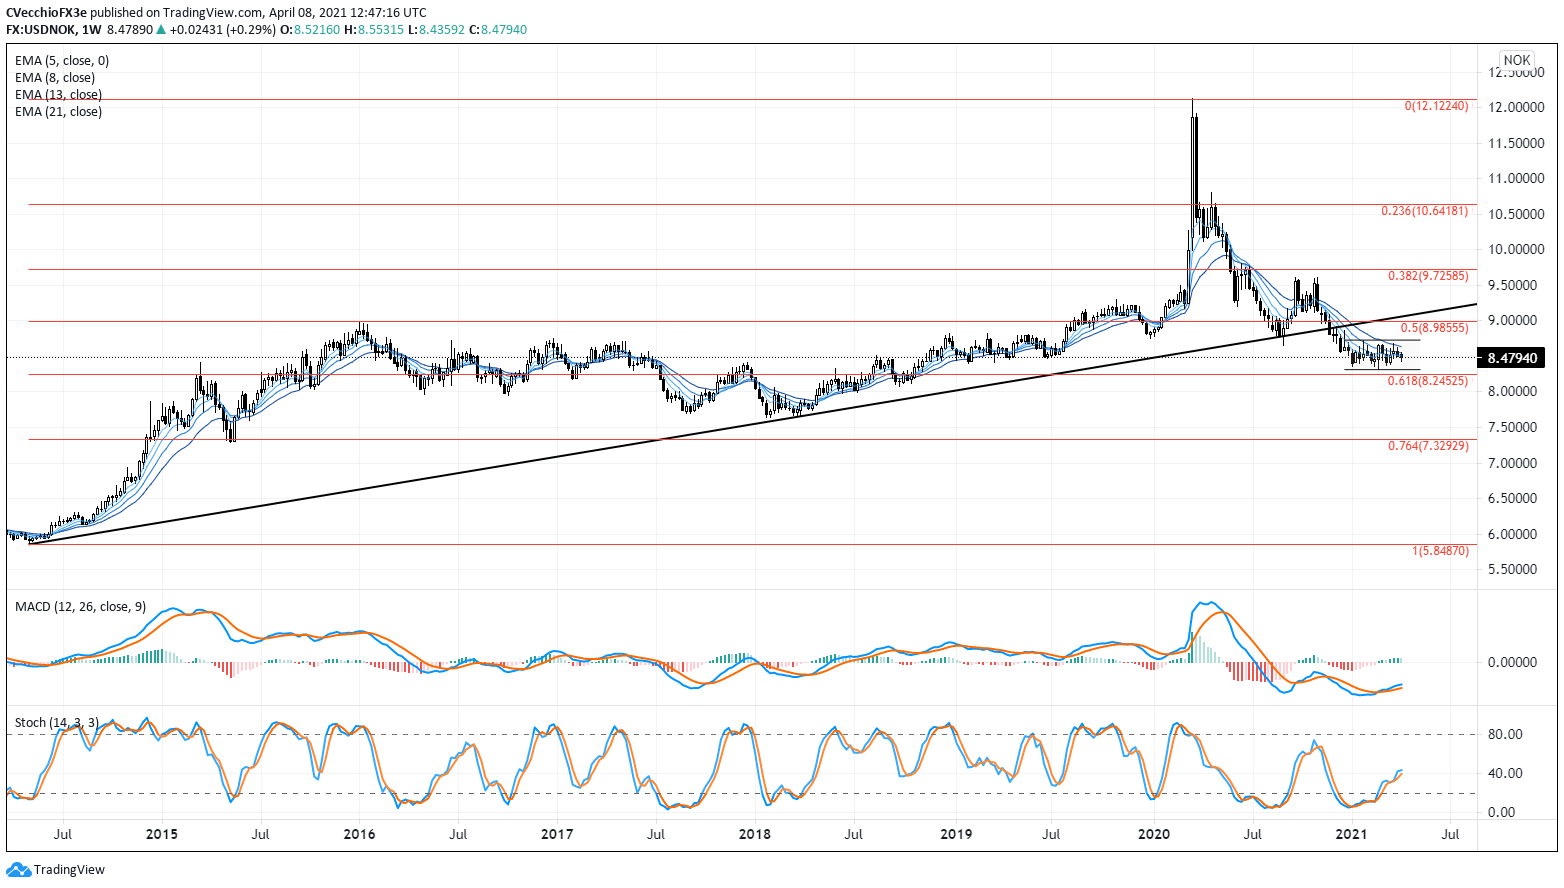
Taking a look at the weekly timeframe, it appears that USD/NOK rates are in the midst of a bear flag consolidation in context of the preceding move, which was a steady decline from the March 2020 high. Concurrently, the bear flag consolidation is occurring after USD/NOK dropped below the ascending trendline from the May 2014 and March 2018 lows (which briefly held as support in August 2020 before giving way in November 2020).
Even though momentum indicators have eased off their extreme bearish readings, there has been no recovery in price action – a sign that the market is digesting the move before continuing lower. The biggest sign of confidence USD/NOK rates might offer that a bearish breakout is gathering pace would be if the pair achieved a weekly close 8.2453, the 61.8% Fibonacci retracement of the May 2014 low/March 2020 high range.

Recommended by Christopher Vecchio, CFA
Building Confidence in Trading
USD/SEK RATE TECHNICAL ANALYSIS: DAILY CHART (October 2016 to April 2021) (CHART 2)
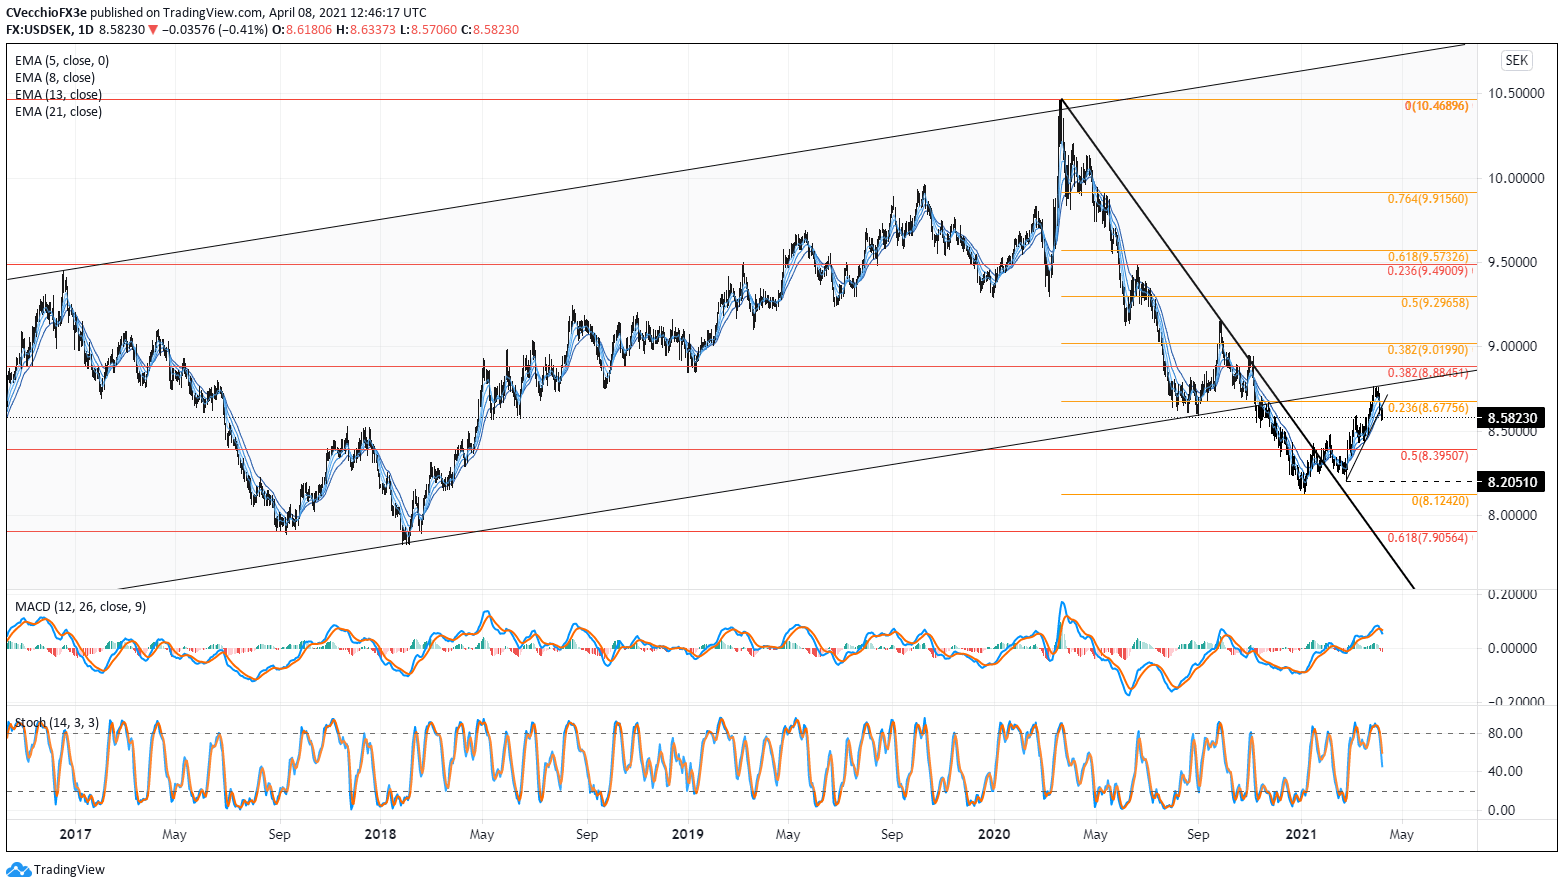
USD/SEK rates have pulled back sharply over the past two weeks, failing to return into the rising parallel channel drawn from the December 2016 and March 2020 highs again the February 2018 and August 2020 lows. In failing to retake the channel in recent weeks, USD/SEK also lost its uptrend from the February and March 2021 swing lows. This also constitutes a failure below the 23.6% Fibonacci retracement of the 2020 high/2021 low range at 8.6776, a sign that the rebound has lost its muster.
Momentum is turning bearish rather quickly following the loss of the February and March uptrend. USD/SEK rates are below their daily 5-, 8-, 13-, and 21-EMA envelope, which is nearly aligned in bearish sequential order. Daily MACD is pulling back while above its signal line, while daily Slow Stochastics are on the precipice of breaking below their median line. USD/SEK rates may soon be heading back towards the 50% Fibonacci retracement of the March 2014 low/March 2020 high at 8.3951.
Discover what kind of forex trader you are

USD/CHF RATE TECHNICAL ANALYSIS: DAILY CHART (March 2020 to April 2021) (CHART 3)
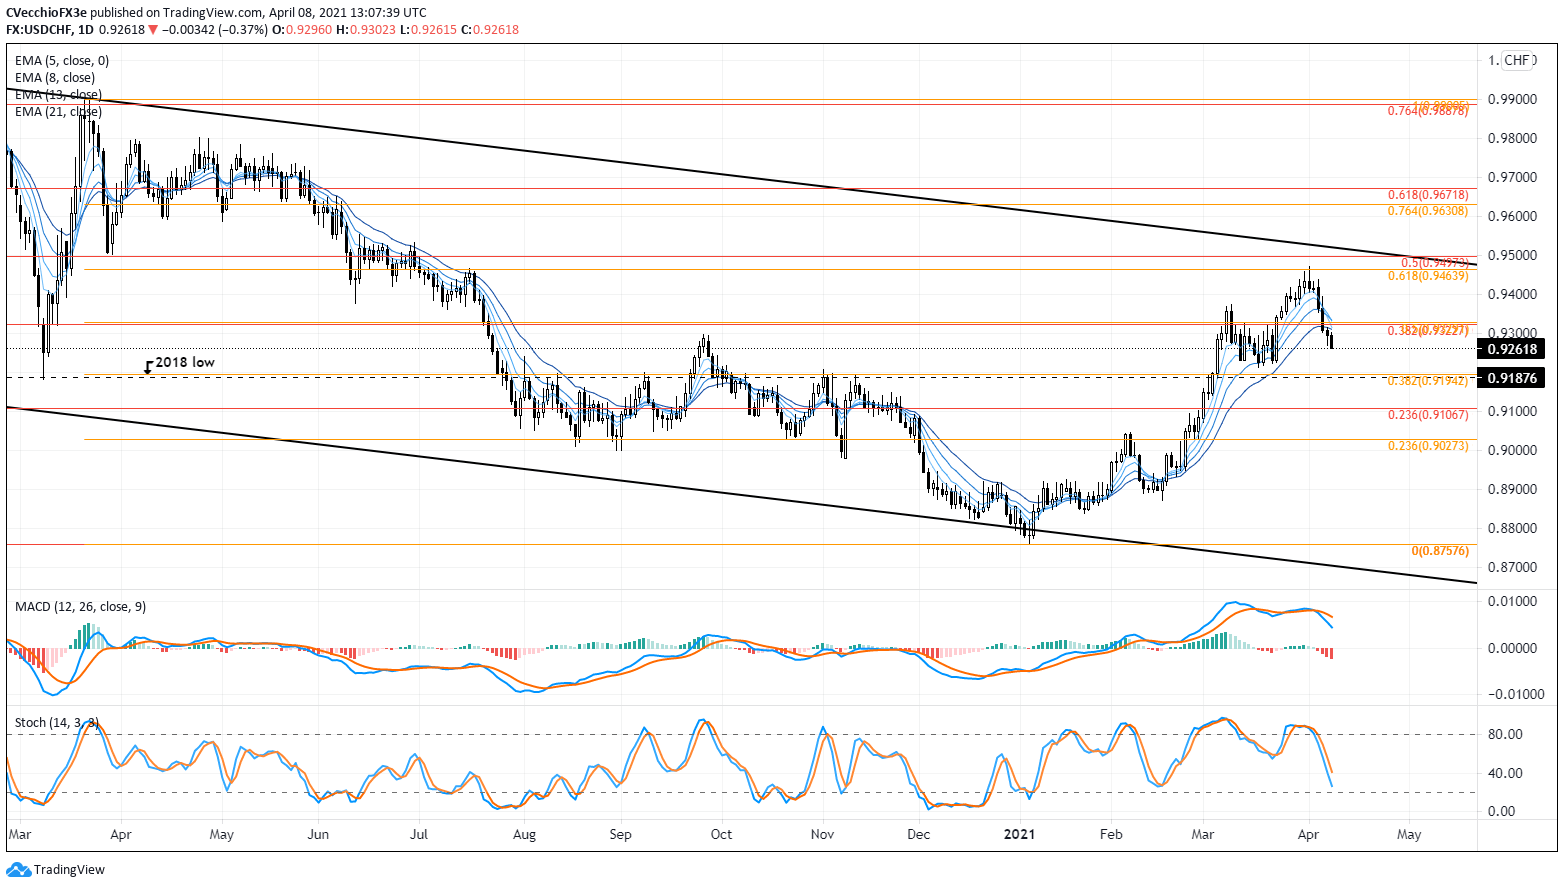
USD/CHF rates have turned the corner in a meaningful way, dropping back from falling channel resistance at the start of the month. Falling below a cluster of Fibonacci retracements measured from the 2019 high/2021 low range and the 2020 high/2021 low range. In doing so, significant damage has been inflicted upon the momentum profile, which is quickly aligning in a bearish manner. While not in bearish sequential order, USD/CHF rates are below the entirety of their daily EMA envelope. Daily MACD’s drop is accelerating, even if it remains above its signal line. Meanwhile, daily Slow Stochastics have already dropped through their median line. A return back to 0.9200 may be in the immediate future.
IG Client Sentiment Index: USD/CHF Rate Forecast (April 8, 2021) (Chart 4)
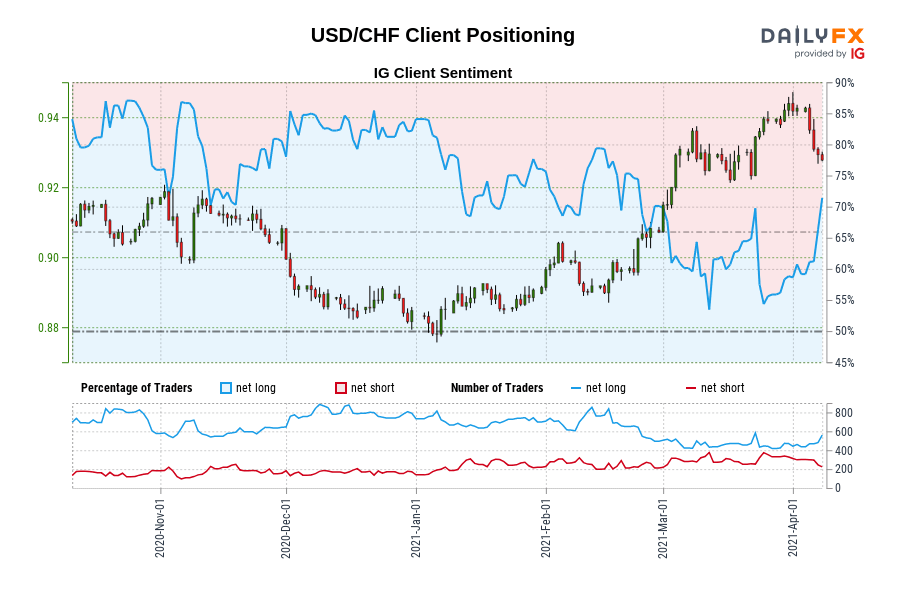
USD/CHF: Retail trader data shows 69.43% of traders are net-long with the ratio of traders long to short at 2.27 to 1. The number of traders net-long is 6.05% higher than yesterday and 25.78% higher from last week, while the number of traders net-short is unchanged than yesterday and 21.09% lower from last week.
We typically take a contrarian view to crowd sentiment, and the fact traders are net-long suggests USD/CHF prices may continue to fall.
Traders are further net-long than yesterday and last week, and the combination of current sentiment and recent changes gives us a stronger USD/CHF-bearish contrarian trading bias.

Recommended by Christopher Vecchio, CFA
Traits of Successful Traders
— Written by Christopher Vecchio, CFA, Senior Currency Strategist
Be the first to comment