

Japanese Yen Talking Points
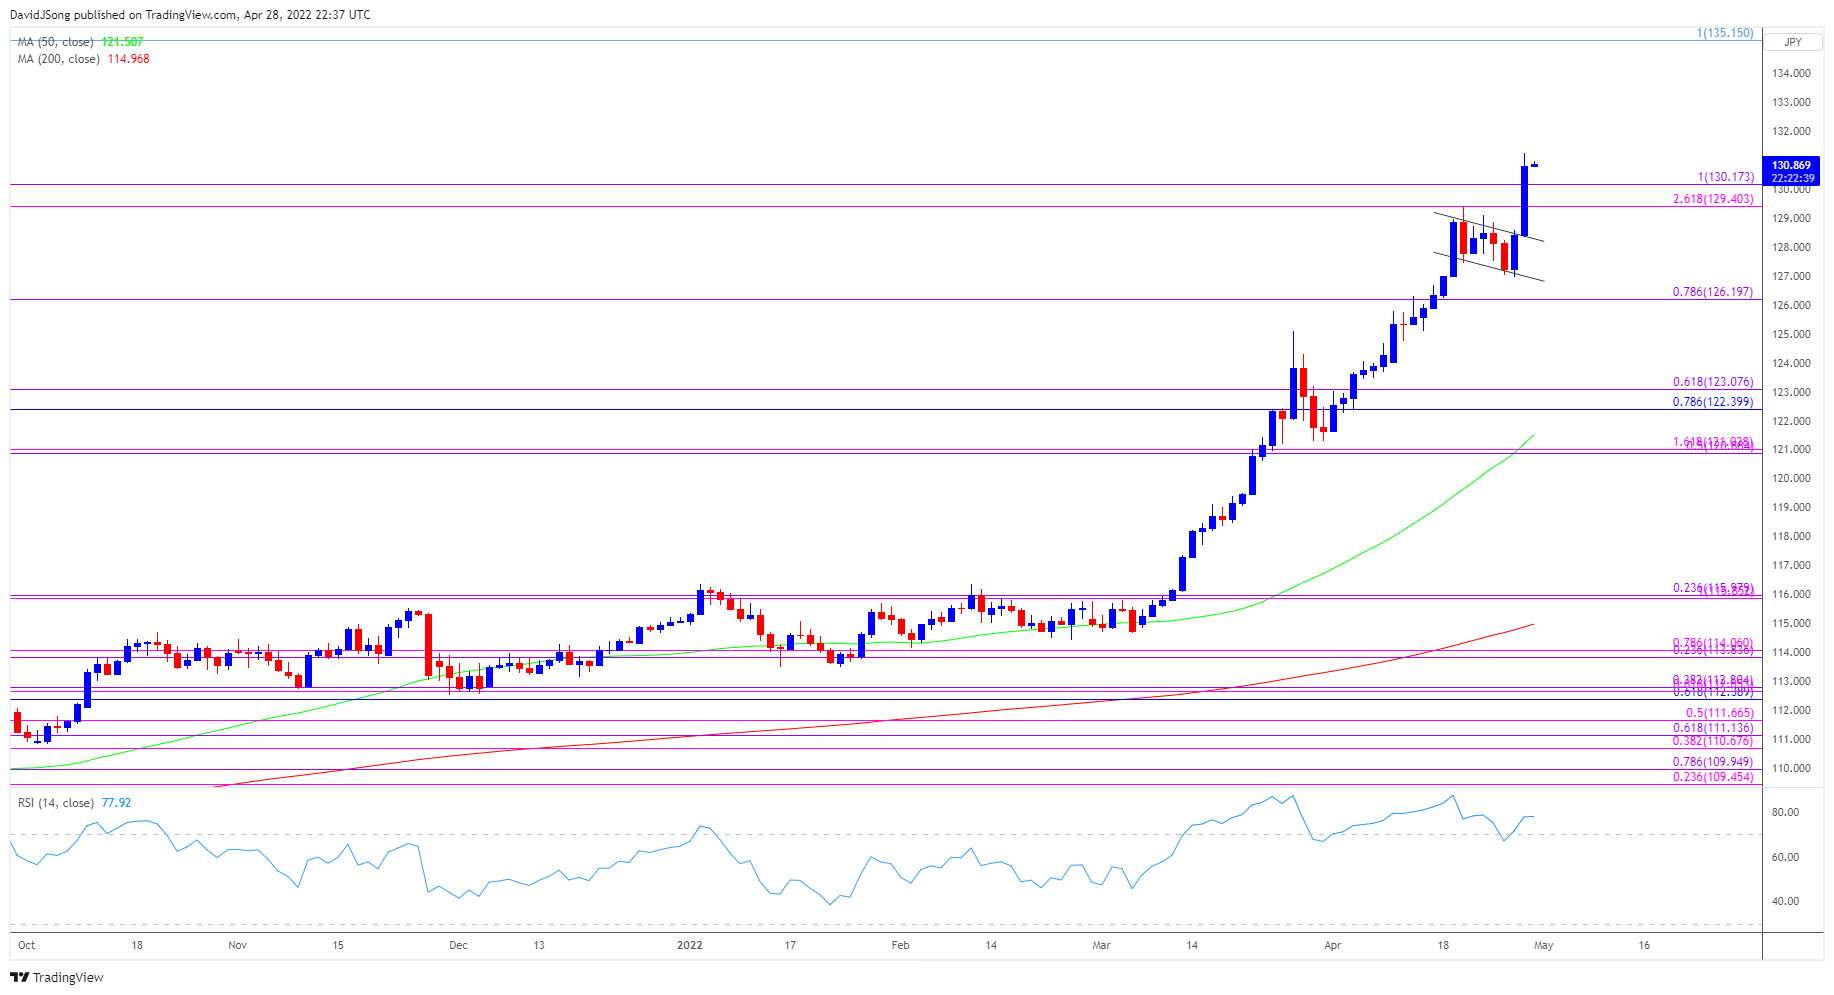
USD/JPY appears to be on track to test the April 2002 high (133.82) as the Bank of Japan (BoJ) remains reluctant to move away from its easing cycle, and the exchange rate may continue to appreciate over the coming days as the recent rally pushes the Relative Strength Index (RSI) back into overbought territory.
USD/JPY Rally Pushes RSI Back into Overbought Territory
USD/JPY climbs to a fresh yearly high (131.25) as a bull-flag formation seems to be unfolding, and the exchange rate may continue to carve a series of higher highs and lows over the coming days as the BoJ stays on track to “purchase a necessary amount of Japanese government bonds (JGBs) without setting an upper limit so that 10-year JGB yields will remain at around zero percent.”
As a result, the recent recovery in US Treasury yields may keep USD/JPY afloat as the Federal Reserve is widely expected to normalize monetary policy at a faster pace, and the diverging paths for monetary policy may lead to a test of the April 2002 high (133.82) as the CME FedWatch Tool reflects nearly 100% probability for a 50bprate hike.
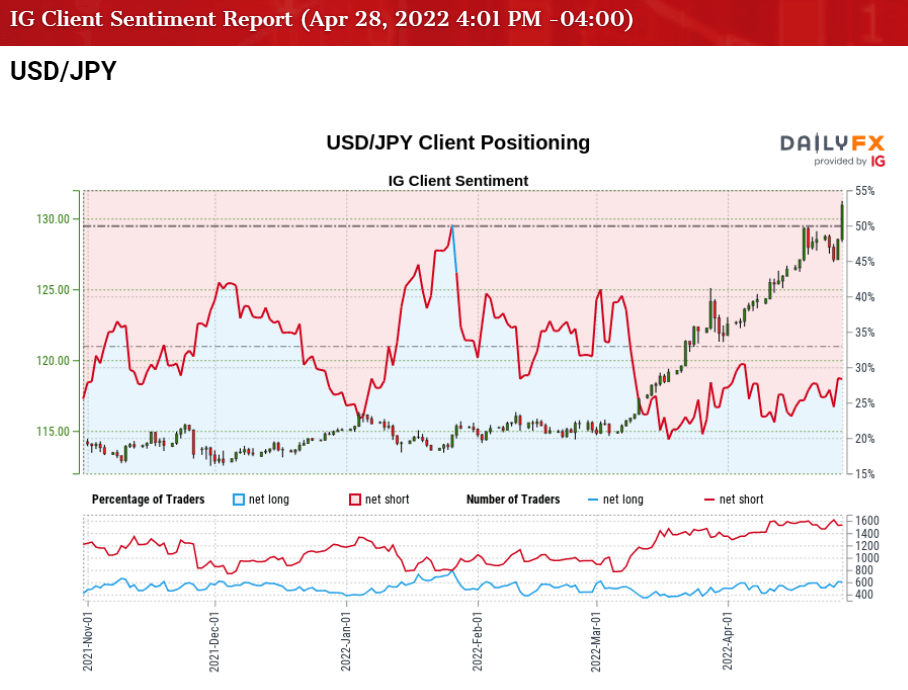
In turn, USD/JPY may continue to appreciate ahead of the Federal Open Market Committee (FOMC) interest rate decision on May 4, while the tilt in retail sentiment looks poised to persist as traders have been net-short the pair since late January.
The IG Client Sentiment report shows only 25.91% of traders are currently net-long USD/JPY, with the ratio of traders short to long standing at 2.86 to 1.
The number of traders net-long is 1.75% lower than yesterday and 10.11% lower from last week, while the number of traders net-short is 4.64% higher than yesterday and 3.09% higher from last week. The decline in net-long position could be a function of profit-taking behavior as USD/JPY trades to a fresh yearly high (131.25), while the crowding behavior has eased despite the rise in n net-short interest as 24.82% of traders were net-long the pair earlier this week.
With that said, recent price action raises the scope for a further advance in USD/JPY as it breaks out of a bull-flag formation, and the bullish momentum underlying the exchange is likely to persist as long as the RSI climbs back into overbought territory.
USD/JPY Rate Daily Chart
Source: Trading View
- USD/JPY is on track to stage an eight-week rally as it climbs to a fresh yearly high (131.25), with the exchange rate initiating a series of higher highs and lows as it breaks out of a bull-flag formation.
- The rally has pushed the Relative Strength Index (RSI) back above 70, and the overbought reading in the oscillator is likely to be accompanied by a further rise in USD/JPY like the price action seen earlier this year.
- The break/close above the Fibonacci overlap around 129.40 (261.8% expansion) to 130.20 (100% expansion) brings the April 2002 high (133.82) on the radar, with the next area of interest coming in around 135.20 (100% expansion).
— Written by David Song, Currency Strategist
Follow me on Twitter at @DavidJSong
Be the first to comment