USD/CAD, USD/JPY, Dow Jones, US Dollar, Trader Positioning – Talking Points
How Can Trader Positioning Impact USD/CAD, USD/JPY and the Dow Jones?
This week, I discussed the US Dollar outlook against the Canadian Dollar and Japanese Yen incorporating trader positioning in addition to fundamental and technical analysis. The Dow Jones was also discussed as it may be a key role for what could come from USD, CAD and JPY amid the coronavirus outbreak. If you would like to join me each week for in-depth discussions, signup in the link below.
Starts in:
Live now:
Mar 18
( 00:03 GMT )
Recommended by Daniel Dubrovsky
What Do Other Traders Buy/Sell Bets Say About Price Trends?
USD/CAD Sentiment Outlook
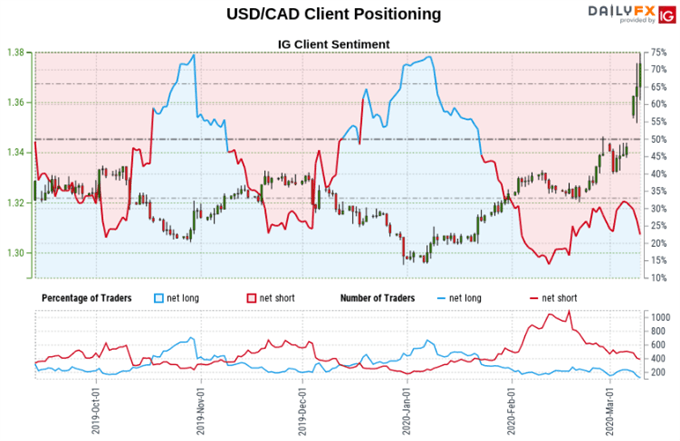
According to IG Client Sentiment (IGCS), about 20.69% of traders are net long USD/CAD at the time of this writing. This is down significantly from just under a 75% upside bias in January. Since then, the exchange rate has climbed about 6% as traders continued to bet on the top in the Loonie. The combination of current sentiment and recent changes produces a stronger USD/CADbullish contrarian trading bias.


Recommended by Daniel Dubrovsky
Improve your trading with IG Client Sentiment Data
Canadian Dollar Technical Analysis
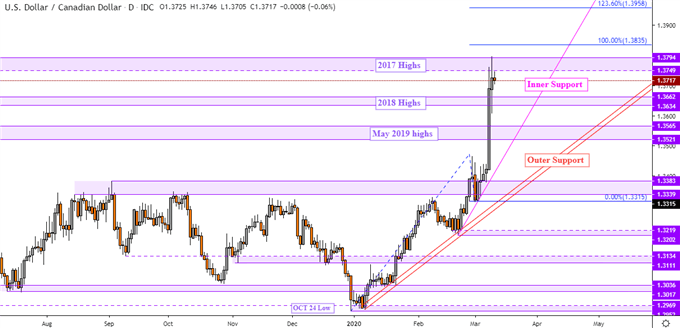
The US Dollar has confirmed a push above 2018 highs against the Canadian Dollar, paving the way to test peaks from 2017. The latter is a range of resistance between 1.3749 and 1.3794. A daily close above the latter exposes the 100% Fibonacci extension at 1.3835 along the way towards 1.3958. Maintaining the medium-term upward bias are a couple of rising support lines labeled “inner” and “outer” on the chart below.
USD/CAD Daily Chart
USD/CAD Chart Created in Trading View
USD/JPY Sentiment Outlook
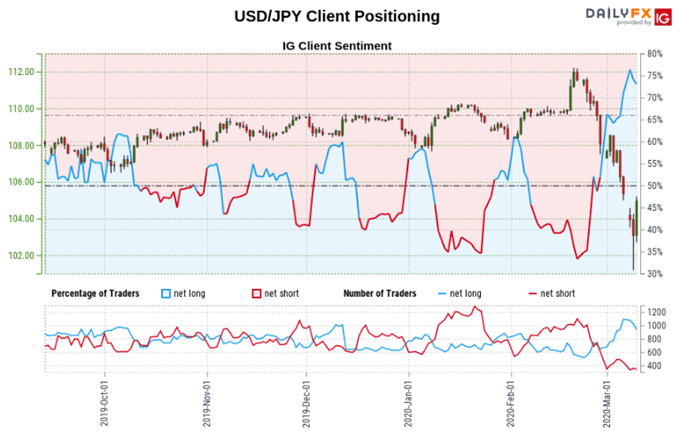
Taking a look at IGCS, about 68.18% of retail investors are net long USD/JPY. That is up from a 35% upside bias back in February. Since then, the pair has fallen over 6.2% as traders increasingly attempt to bet on the reversal point in the Japanese Yen. The combination of current sentiment and recent changes transmits a stronger bearish contrarian trading bias, speaking to a rising amount of traders trying to pick the bottom.


Recommended by Daniel Dubrovsky
Top Trading Lessons
Japanese Yen Technical Analysis
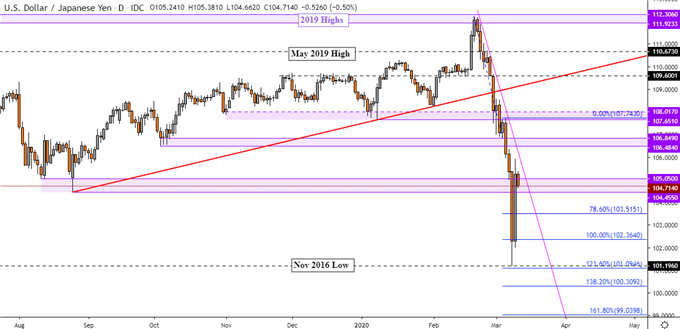
The USD/JPY downtrend is being maintained by falling resistance from February – pink line below. Losses accelerated after the drop under rising support from August – red line. Prices appeared to find a bottom just off lows from November 2016. Downtrend resumption places the focus on the 78.6% Fibonacci extension at 103.51 followed by 102.36. Otherwise, closing above falling resistance may start shifting the outlook bullish.
USD/JPY Daily Chart
USD/JPY Chart Created in Trading View
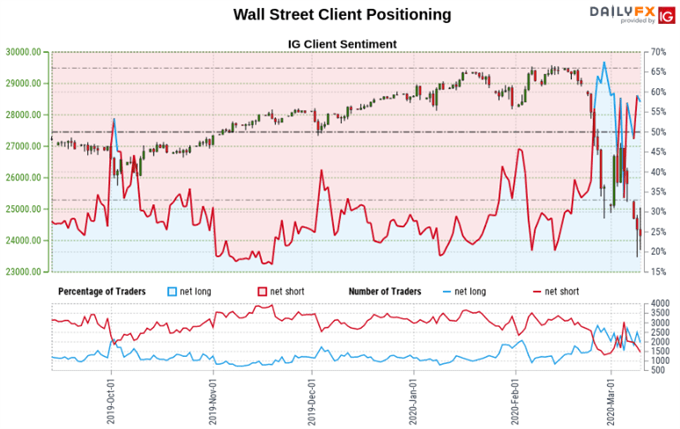
Wall Street Sentiment Outlook
IGCS indicates that about 57.33% of retail Dow Jones investors are net long at the time of this writing. That is a shift from just a 20% long bias in February. Since then, the index has lost over 15% of its value as a rising share of investors attempted to bet on its turning point. From here, traders are further netlong than yesterday and last week. The combination of current sentiment and recent changes gives us a strongerbearish outlook.
Dow Jones Technical Analysis
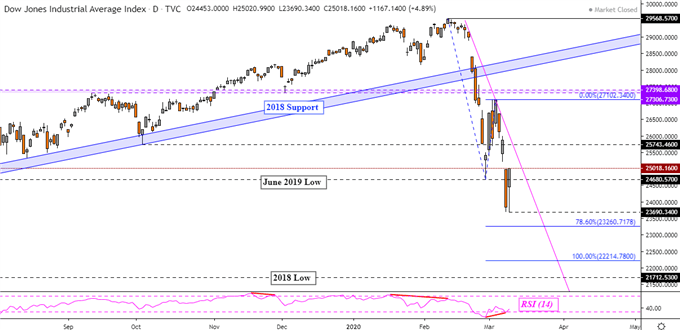
The Dow Jones downtrend is being maintained by falling resistance from February – pink line below. This followed a break under rising support from 2018. Prices have paused their descent on lows from June 2019. A turn lower could pave the way for a revisit to the cheapest point since 2018. Positive RSI divergence does show downside momentum is fading and with upside confirmation, may precede a turn higher.
Dow Jones Daily Chart
Dow Jones Chart Created in Trading View
*IG Client Sentiment Charts and Positioning Data Used from March 10 Report
— Written by Daniel Dubrovsky, Currency Analyst for DailyFX.com
To contact Daniel, use the comments section below or @ddubrovskyFX on Twitter


Be the first to comment