

USD/CAD Price, Chart, and Analysis
Keep up to date with all market-moving data releases and events by using the DailyFX Calendar
The post-Jackson Hole sell-off in the US dollar is pushing the greenback down to a new two-week low with short-term support around 92.45 now under pressure. While chair Powell may have disappointed the market by not releasing a more structured timetable for tapering bond purchases, Friday’s US jobs report (NFP) may nudge the Fed into a more detailed announcement at next month’s FOMC meeting (September 21-22), giving the greenback a supportive bid. The daily DXY chart shows the current weakness in the market with both the 20- and 50-day simple moving averages broken in the last few days.
US Dollar (DXY) Daily Price Chart (January – August 31, 2021)
Moving Averages (MA) Explained for Traders
On the right-hand side of the USD/CAD quote, the Canadian dollar is currently getting a bid from a stronger oil complex after oil production in the Gulf of Mexico was badly hit by the impact of Hurricane Ida. The upcoming OPEC+ meeting is expected to increase production by 400,000 barrels a day, as previously announced, and this may eventually help to unwind some of the tight conditions seen in the market. Later today, second-quarter Canadian GDP is announced (13:30 BST) with annualized growth expected to have slowed to 2.5% from a prior 5.6%. Monthly GDP is forecast to rise to 0.7% in June from -0.3% in May.
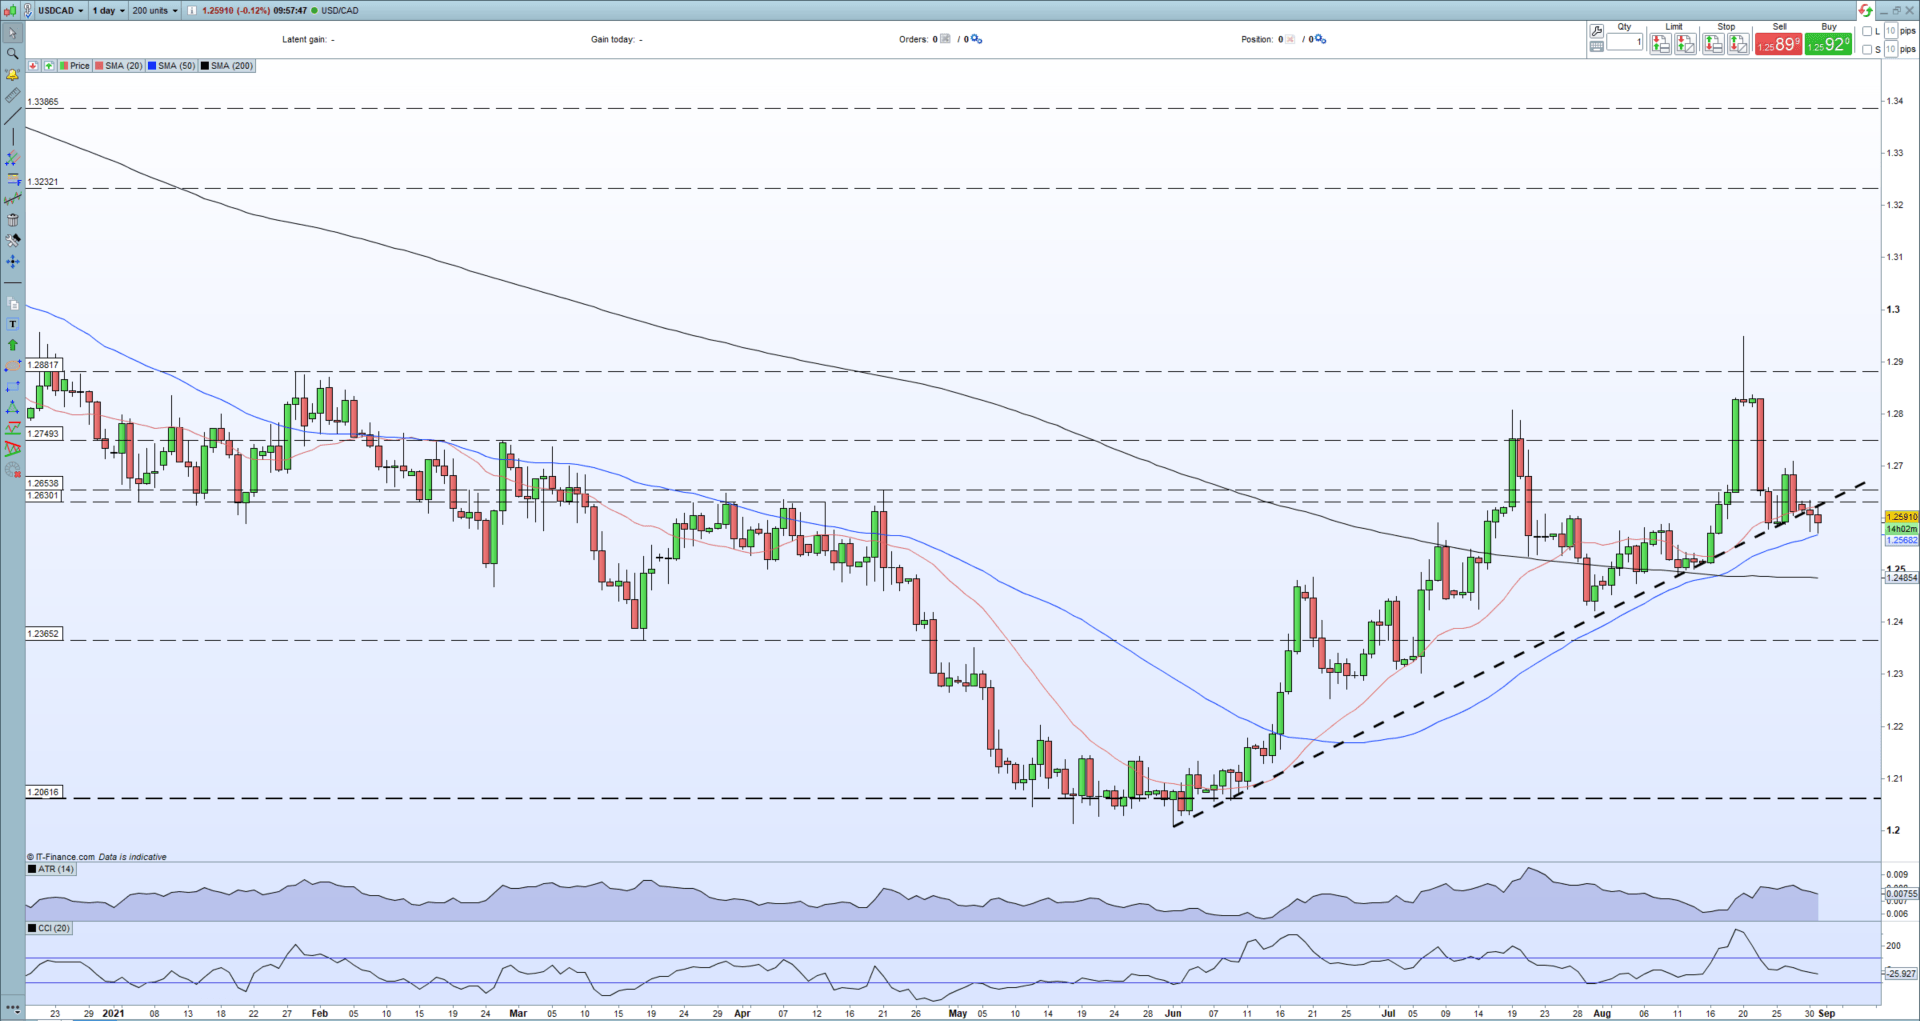
The latest sell-off in USD/CAD sees the pair now trading below recent trend support and a confirmed break will likely see the pair push lower. The supportive 20-day sma has also been broken, just, while the 50-day sma has been tested and rejected. A confirmed break lower will see a cluster of prior lows between 1.2510 and 1.2422 come into focus.
IG retail positioning (see below) confirms this mixed outlook although the sharp increase in weekly net-longs and a sharp decrease in weekly net-shorts shows traders are building further long positions in the pair.
USD/CAD Daily Price Chart (December 2020 – August 31, 2021)
Retail trader data show 73.89% of traders are net-long with the ratio of traders long to short at 2.83 to 1. The number of traders net-long is unchanged than yesterday and 28.03% higher from last week, while the number of traders net-short is unchanged than yesterday and 37.52% lower from last week.
We typically take a contrarian view to crowd sentiment, and the fact traders are net-long suggests USD/CAD prices may continue to fall. Positioning is less net-long than yesterday but more net-long from last week. The combination of current sentiment and recent changes gives us a further mixed USD/CAD trading bias.
What is your view on USD/CAD – bullish or bearish?? You can let us know via the form at the end of this piece or you can contact the author via Twitter @nickcawley1.
Be the first to comment