

Torsten Asmus
A guest post by Ovi
All of the Crude plus Condensate (C + C) production data for the US state charts comes from the EIAʼs December Petroleum Supply monthly PSM which provides updated information up to October 2022.
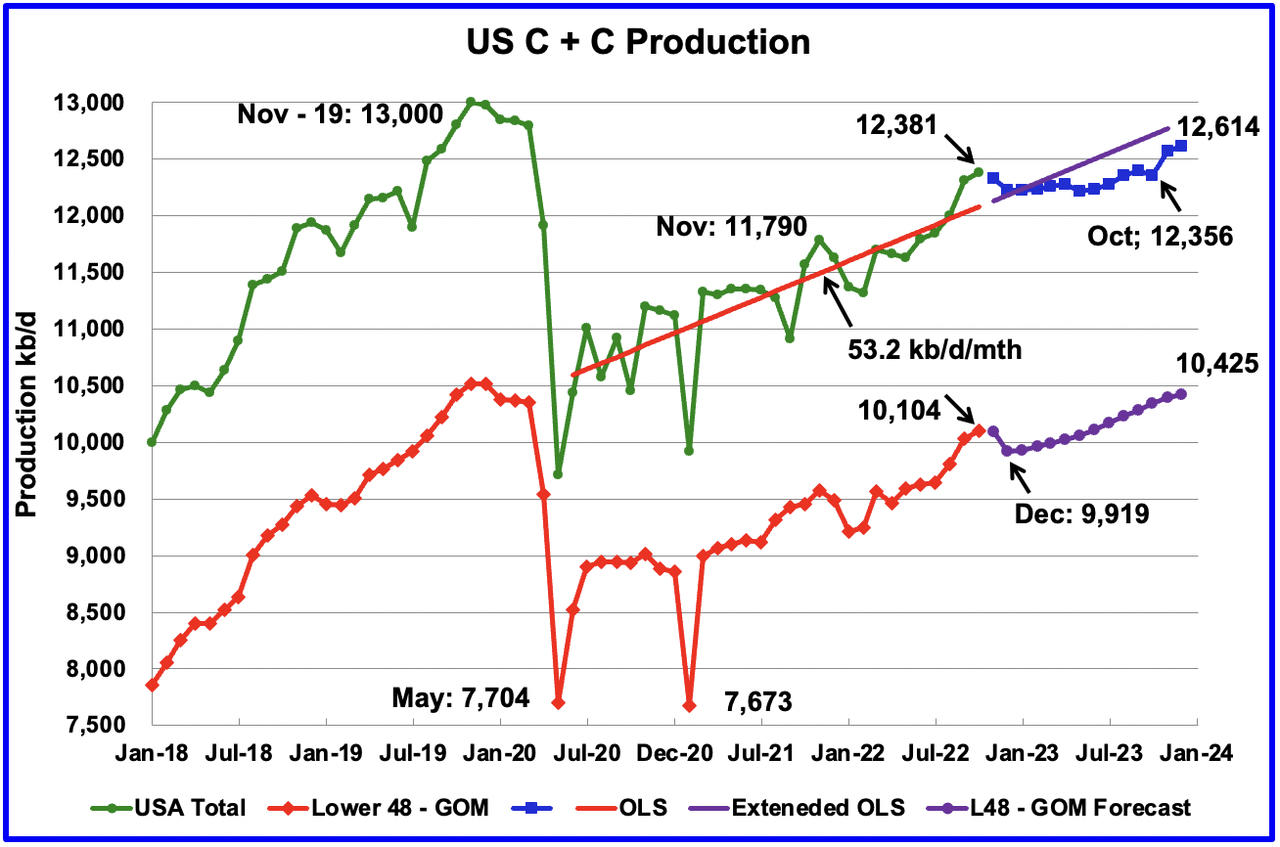
U.S. October production increased by 69 kb/d to 12,381 kb/d to a new post pandemic high. It should be noted that September’s oil production increase of 289 kb/d to 12,268 kb/d which was reported last month and was considered high, was revised further up by 44 kb/d to 12,312 kb/d in the current October report. For September, the state with the largest increase was New Mexico 41 kb/d, along with a number of small increases from the smaller producing states.
While overall US oil production increased, a clearer indication of the health of US production can be gleaned by looking more closely at the Onshore L48 states. In the Onshore L48, October production increased by 69 kb/d to 10,104 kb/d. This means that 100% of the increase in US production came from the Onshore L48.
The blue graph, taken from the December 2022 STEO, is the production forecast for the U.S. from November 2022 to December 2023. Output for December 2023 is expected to be 12,614 kb/d, 34 kb/d higher than reported last month.
Note that production in October 2023 is forecast to be lower than in October 2022. The flatness in overall US output up to October 2023 is because the production increase in the Onshore L48 of 506 kb/d from December 2022 to December 2023 is offset by declining production in the GOM. See GOM chart further down.
The red OLS line from June 2020 to October 2022 indicates a monthly production increase of 53.2 kb/d/mth over that period. The first portion of red line stops at October because that is the range covered by the OLS analysis. The second portion is the same OLS line extended to see how well it fits the STEO forecast.
Oil Production Ranked by State
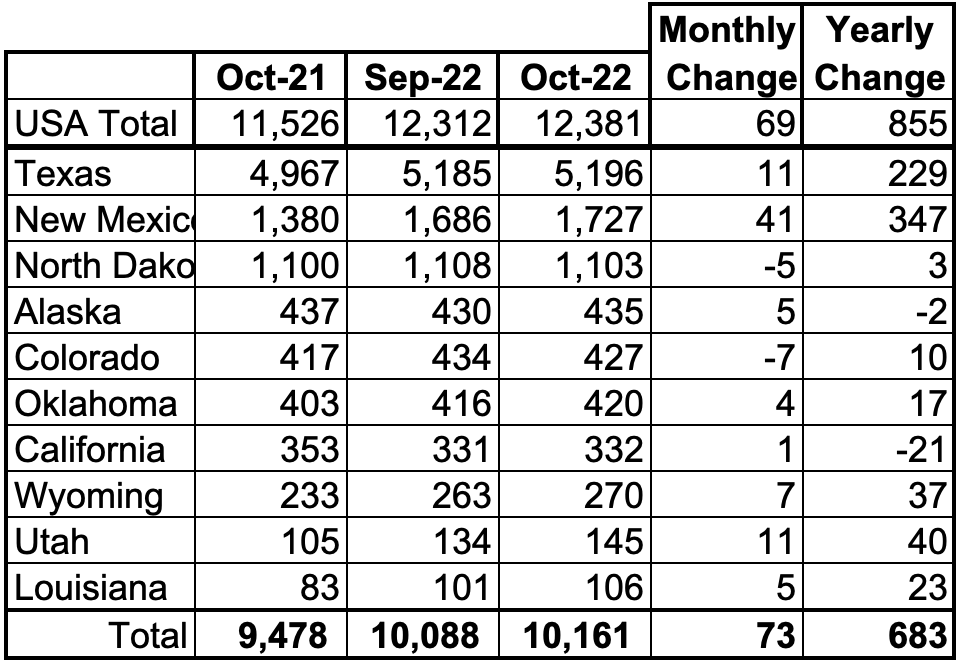
Listed above are the 10 states with the largest US production. These 10 accounted for 82.1% of all U.S. oil production out of a total production of 12,381 kb/d in October 2022.
On a YoY basis, US production increased by 855 kb/d with the majority having come from Texas and New Mexico. Note that only California and Alaska are producing less crude this year than a year ago.
State Oil Production Charts
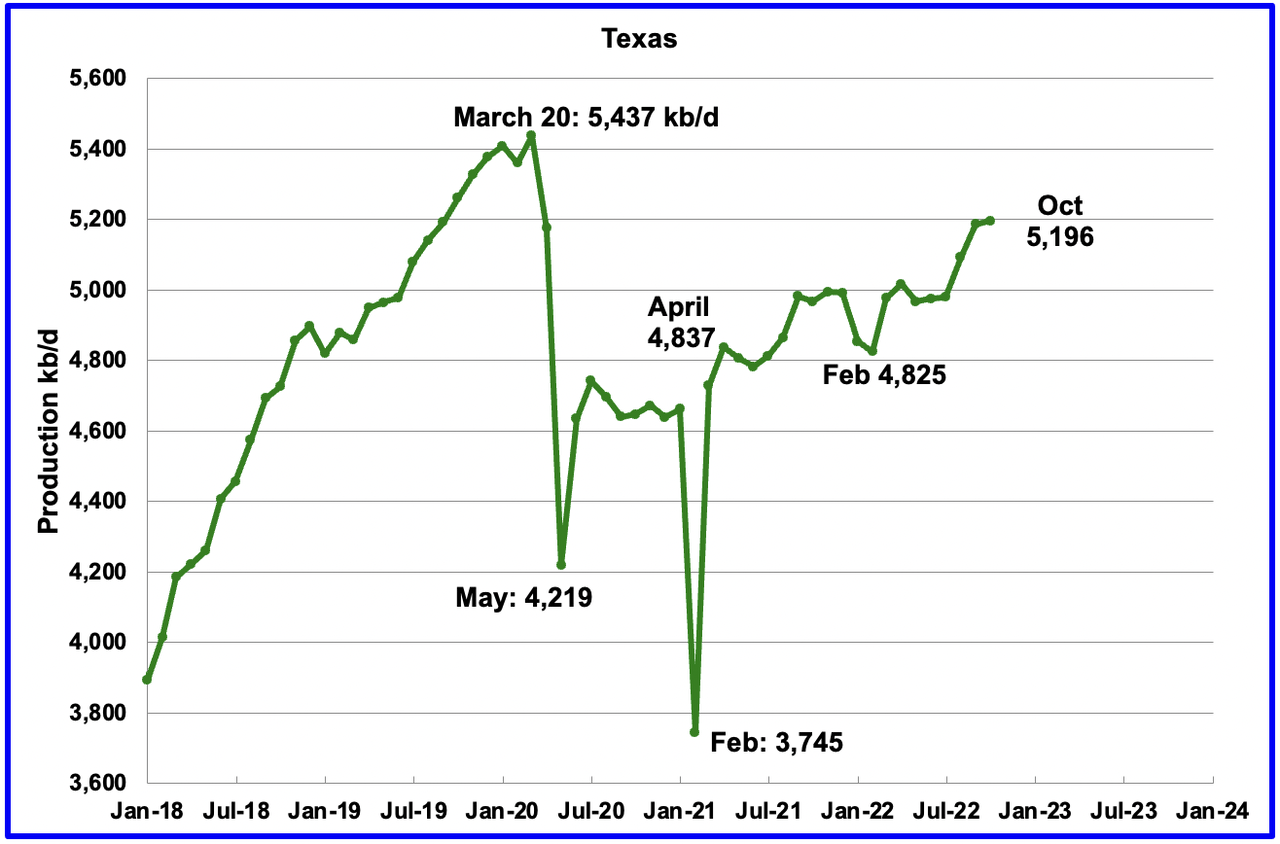
Texas production increased by 11 kb/d in October to 5,196 kb/d, a post pandemic high. The Texas small monthly increase is because September was revised up by 44 kb/d from 5,145 kb/d to 5,185 kb/d.
In October 2021 there were 215 Hz oil rigs operating in Texas. By October 2022, 313 Hz oil rigs were operational, an increase of 98 rigs.
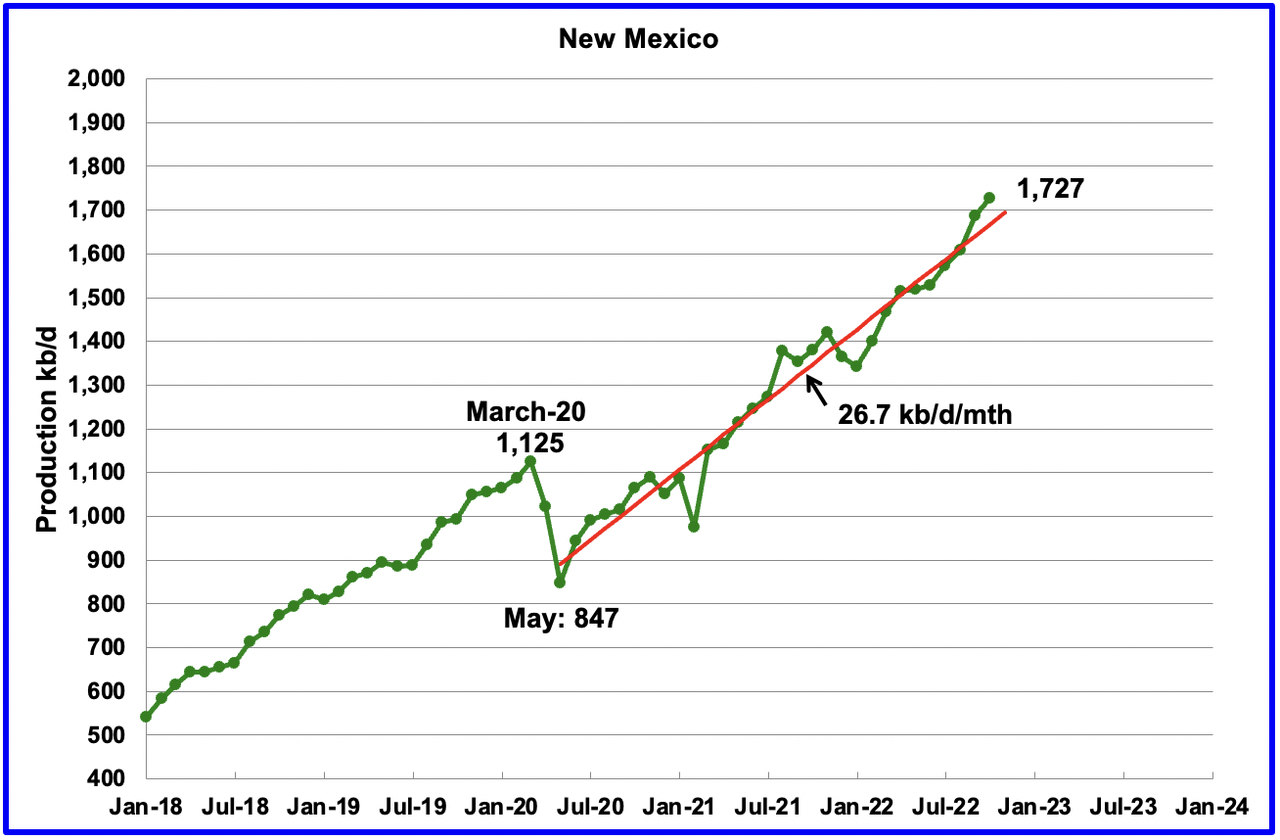
October’s New Mexico production increased by 41 kb/d to 1,727 kb/d to a new record high. The red OLS line from May 2020 to October 2022 indicates a production growth rate of 26.7 kb/d/mth and shows no sign of rolling over. Since August, the rig count has been steady in the mid to high 90s.
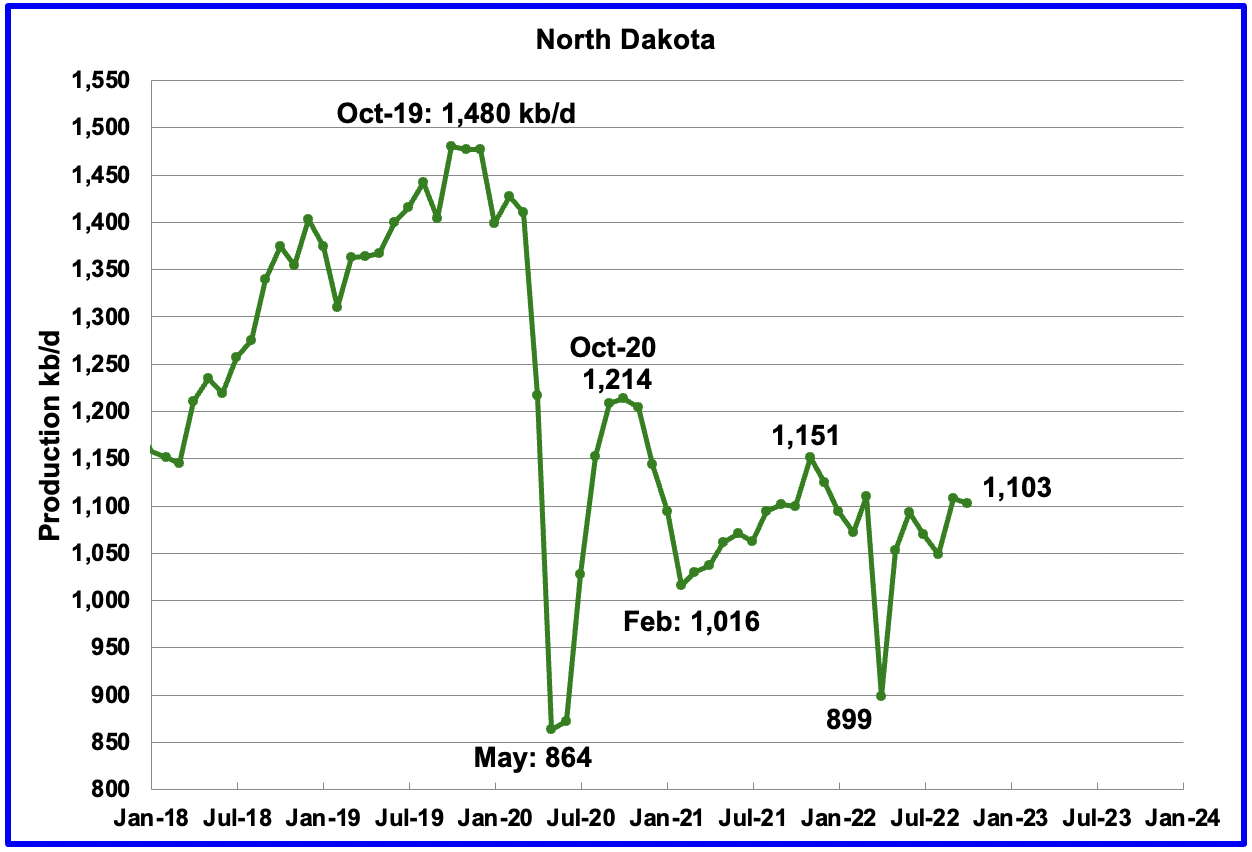
North Dakota’s October output decreased to 1,103 kb/d, a decrease of 5 kb/d from September.
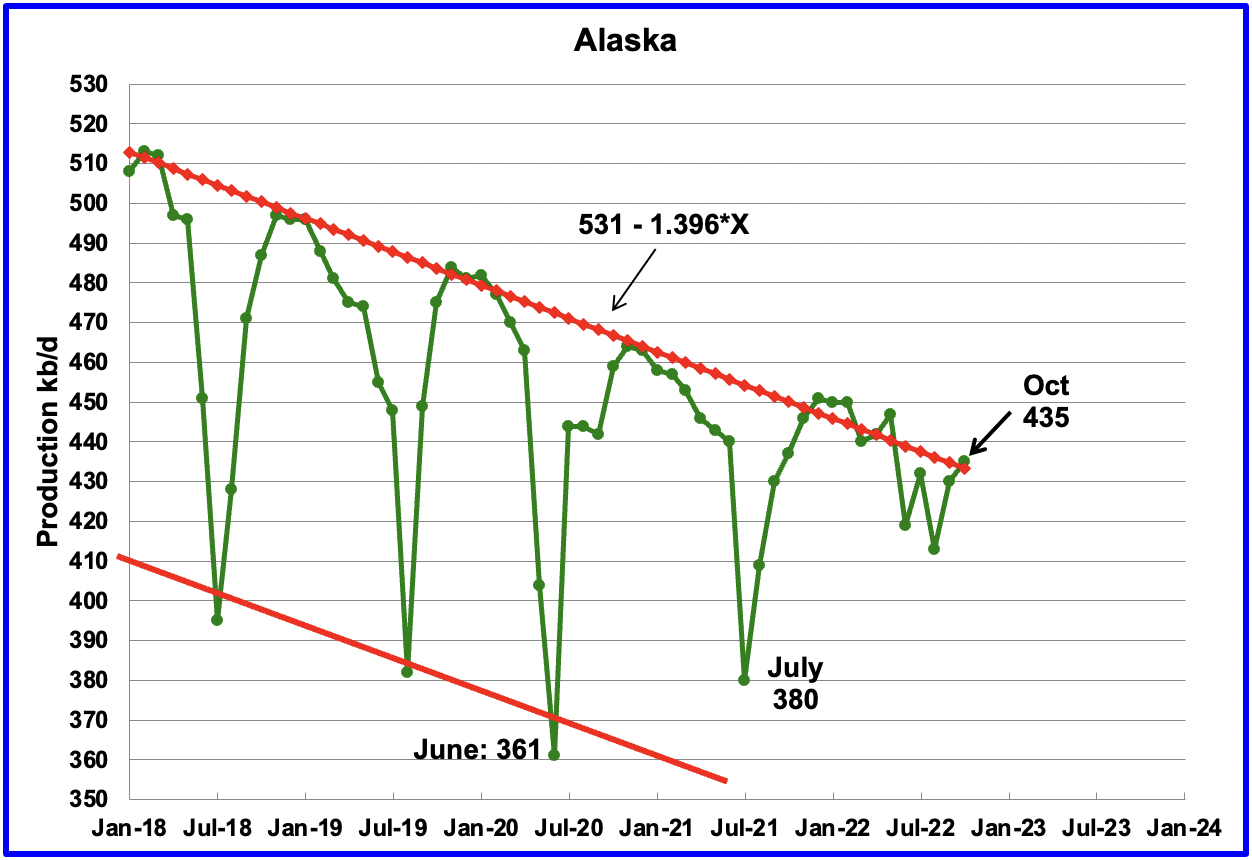
Alaskaʼs October output increased by 5 kb/d to 435 kb/d and was 2 kb/d lower last October.
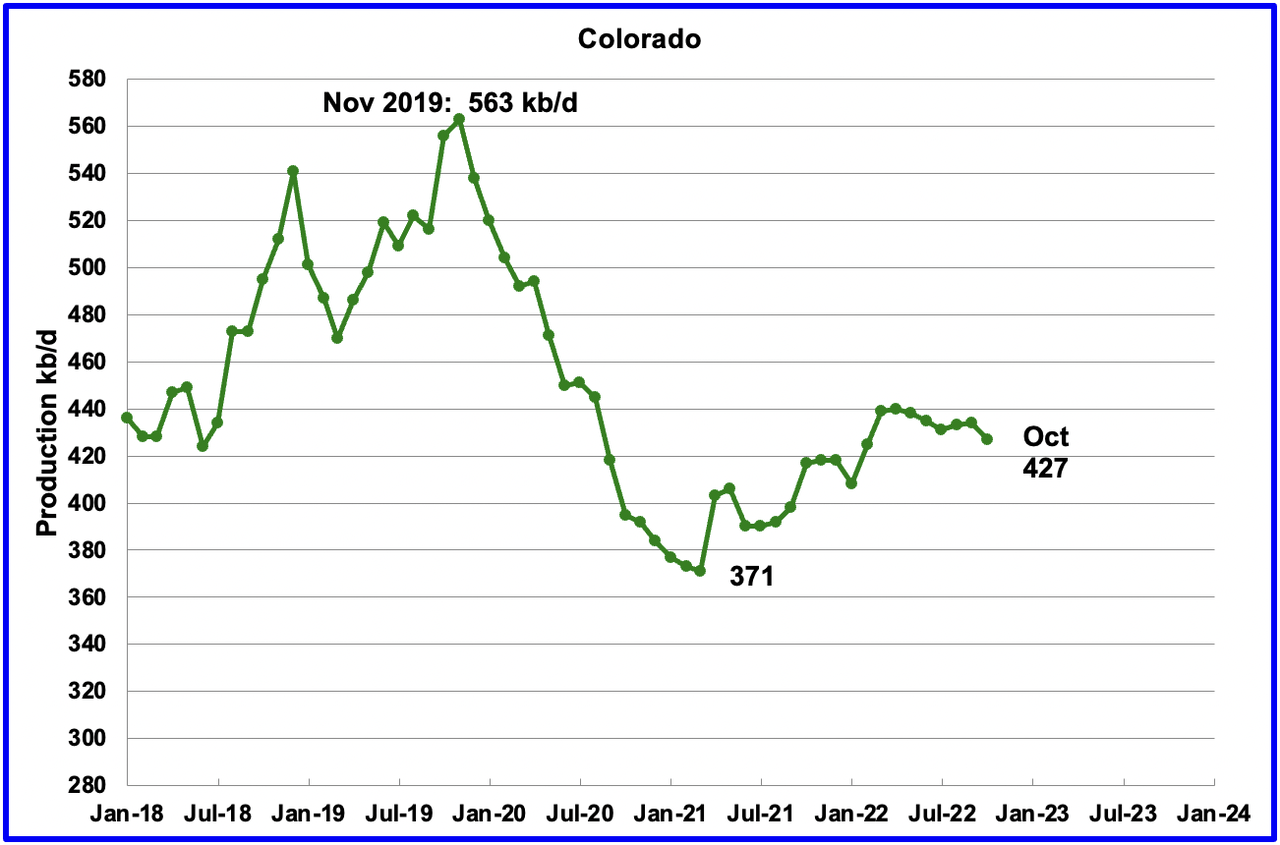
Coloradoʼs October production decreased by 7 kb/d to 427 kb/d. A recent Colorado report forecasts little oil growth is likely in Colorado for 2022.
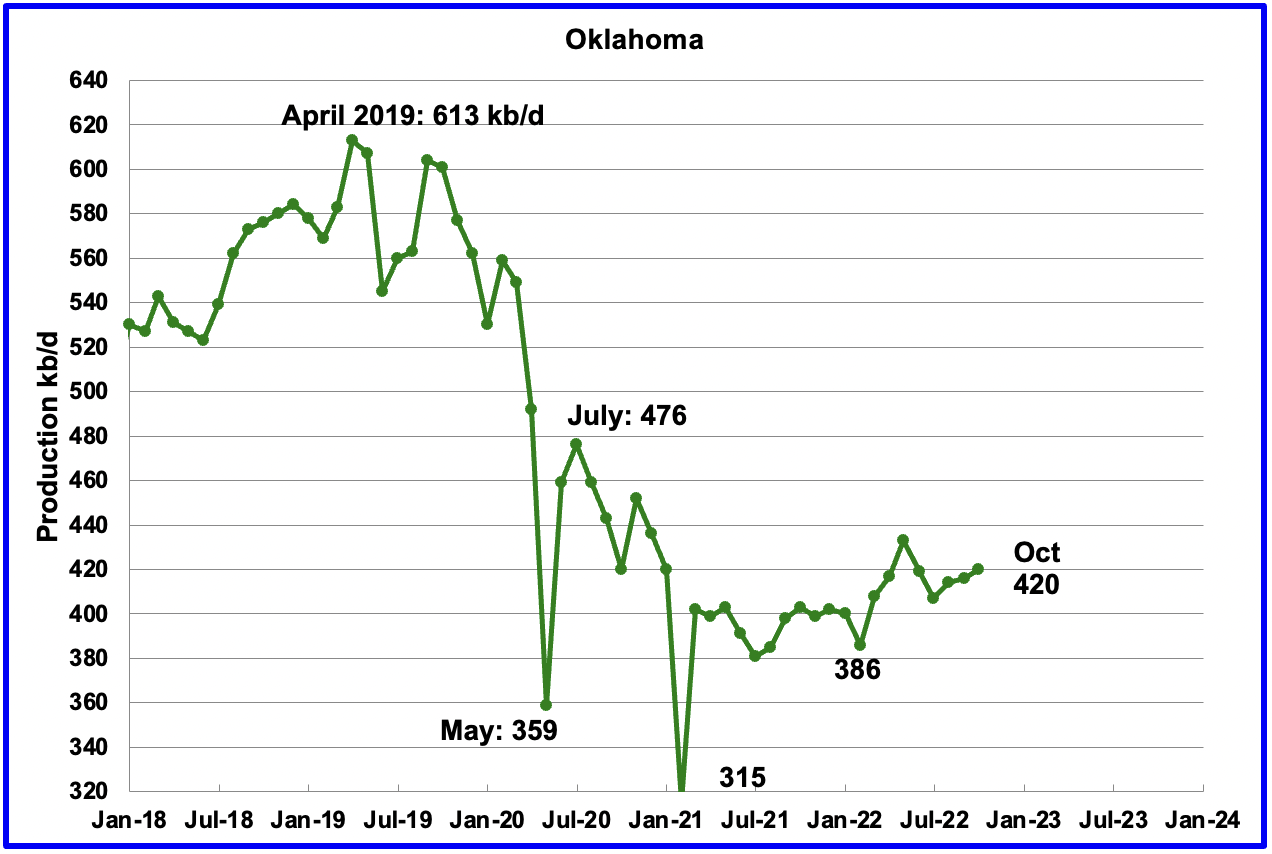
Oklahoma’s output in October increased by 4 kb/d to 420 kb/d. From January to April 2022, close to fifty rigs were operating in Oklahoma. By late October the rig count had increased to 65. Production remains 56 kb/d below the post pandemic high of 476 kb/d.
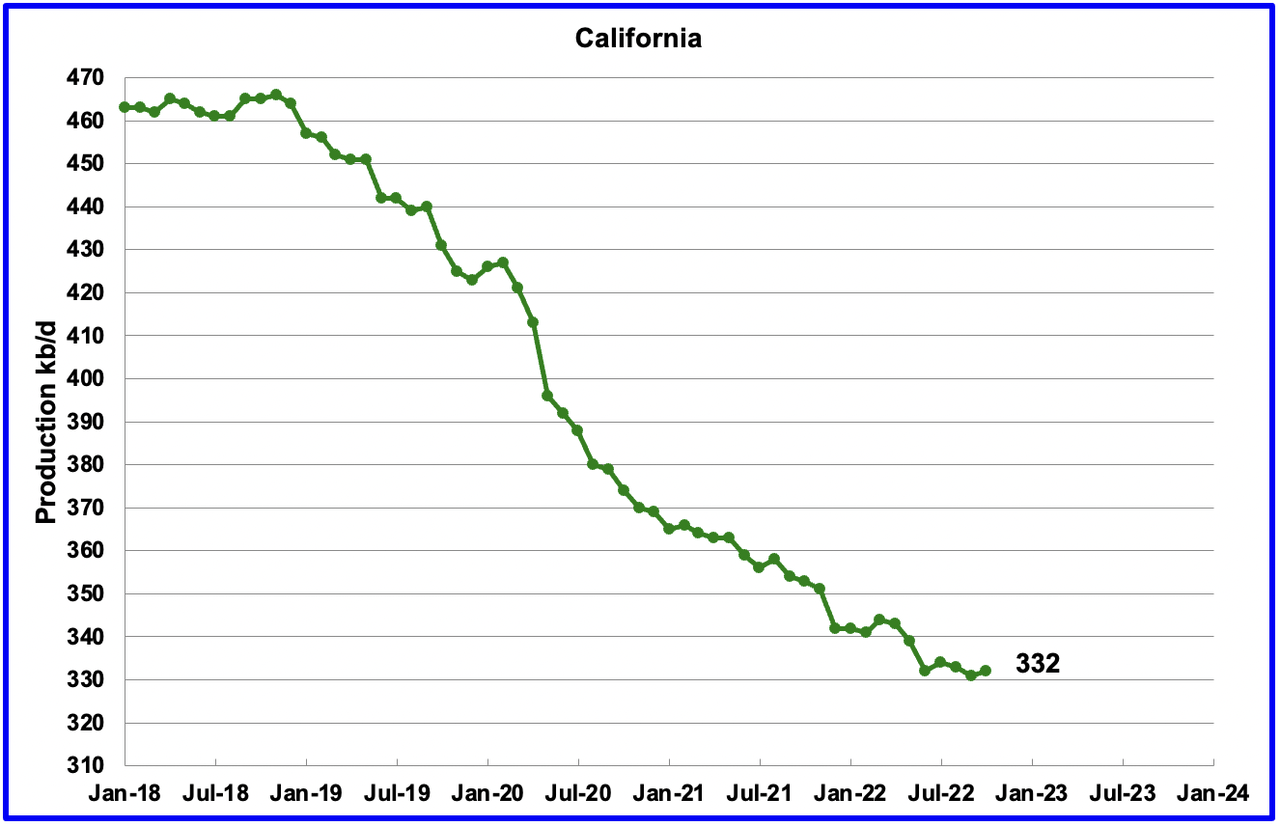
While Californiaʼs overall slow output decline trend continues, October was an exception since production increased by 1 kb/d to 332 in October.
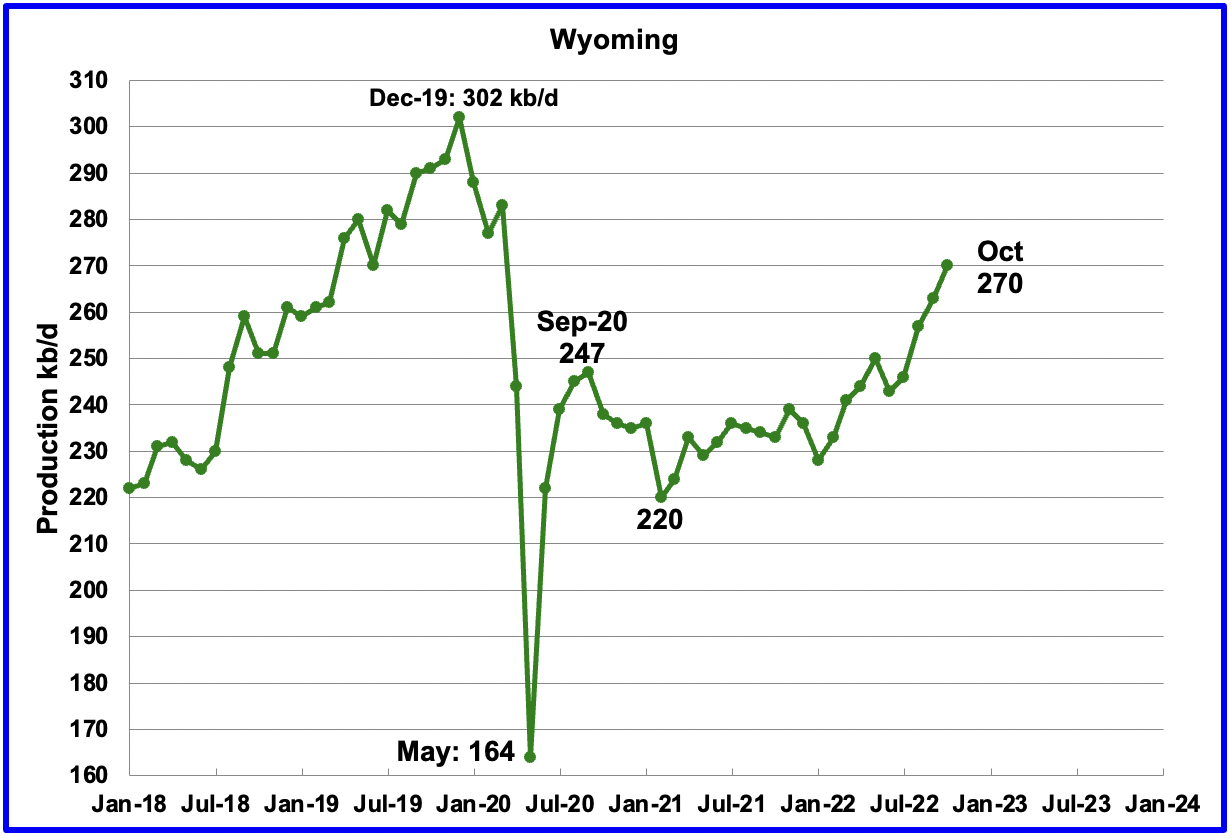
Wyoming’s oil production has been on a slow unsteady uptrend from the low of 220 kb/d in February 2021 due to increased drilling. October’s output reached a new post pandemic high of 270 kb/d, an increase 7 kb/d over September.
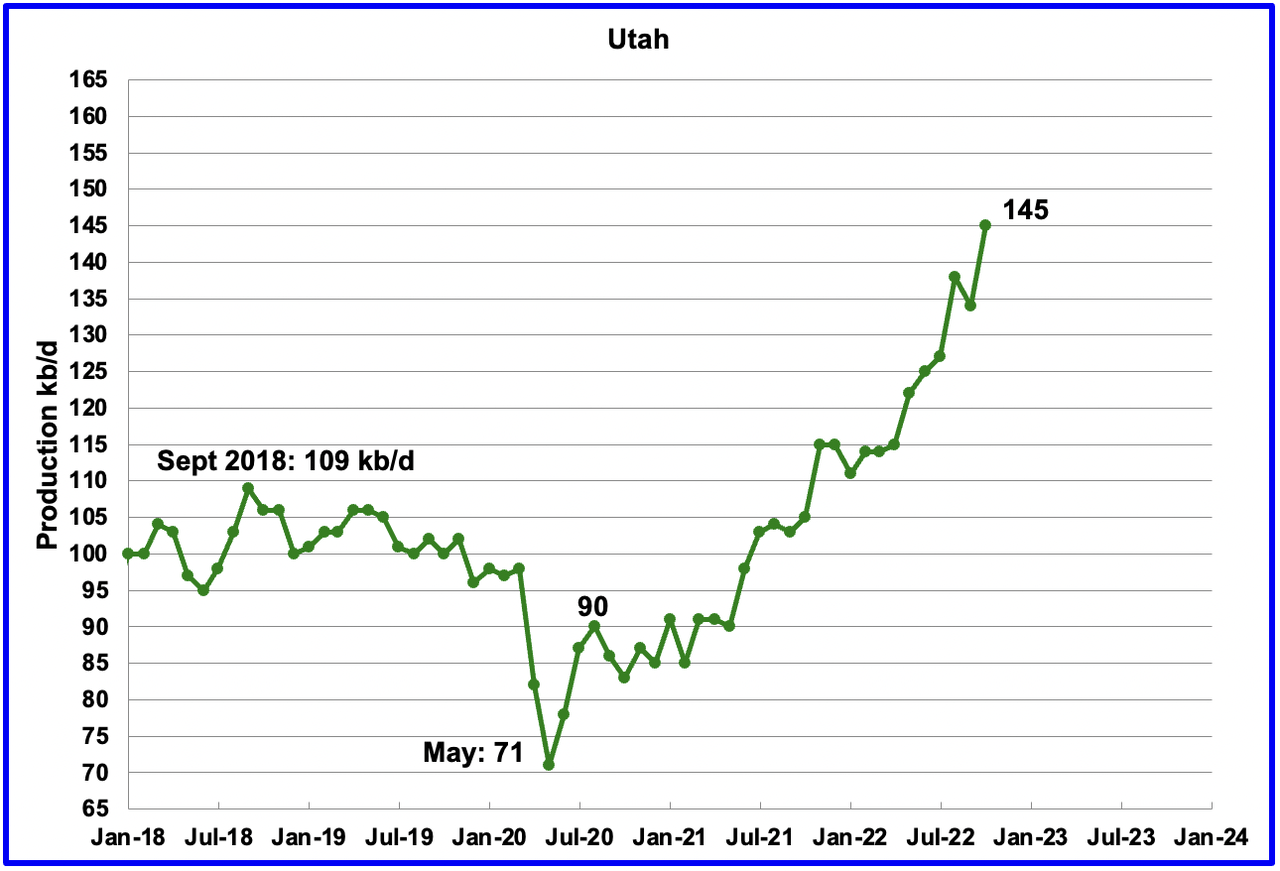
Utah’s oil production had been increasing steadily since January 2022. October production hit another new high of 145 kb/d after adding 11 kb/d to September’s output. Utah had 7 rigs operating in October.
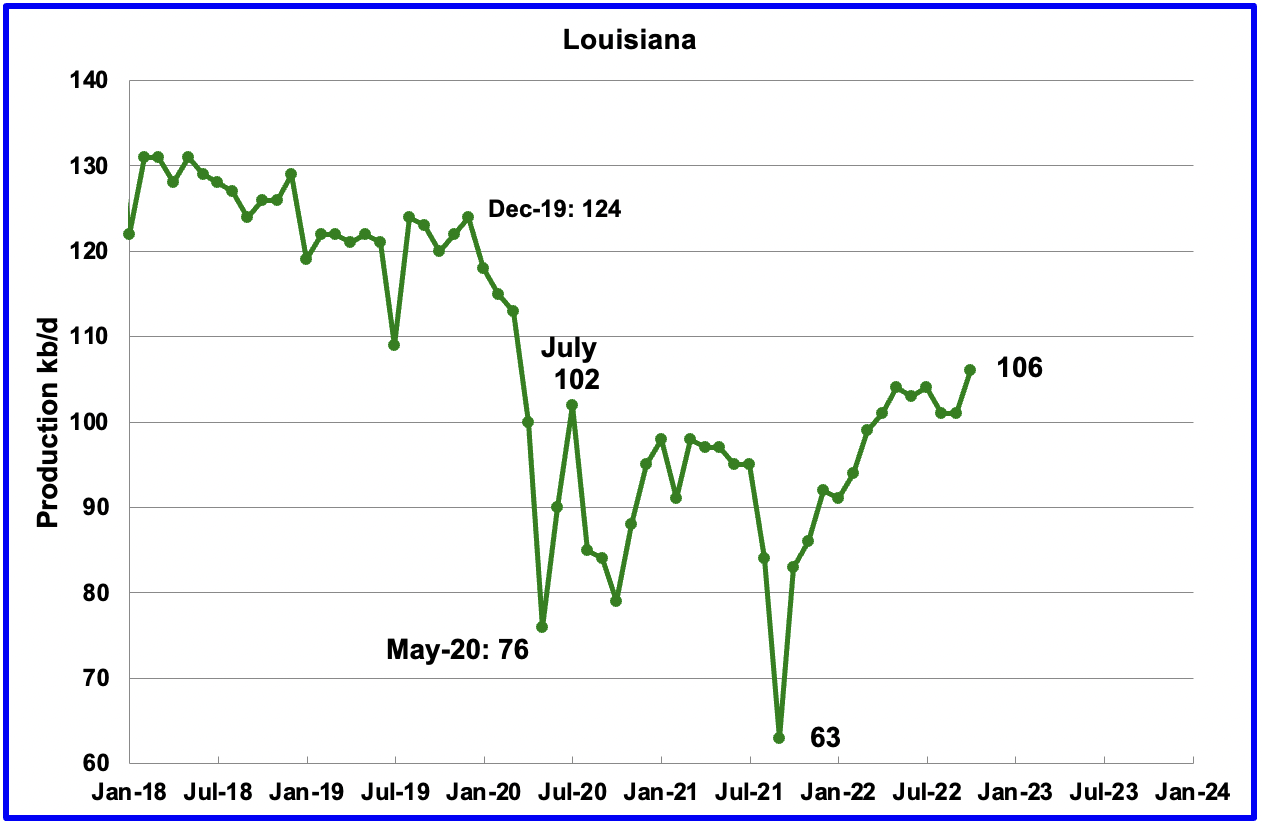
Louisiana’s output continues to climb from the low of 63 kb/d in September 2021. October’s output increased by 5 kb/d to 106 kb/d to a new post-pandemic high of 106 kb/d.
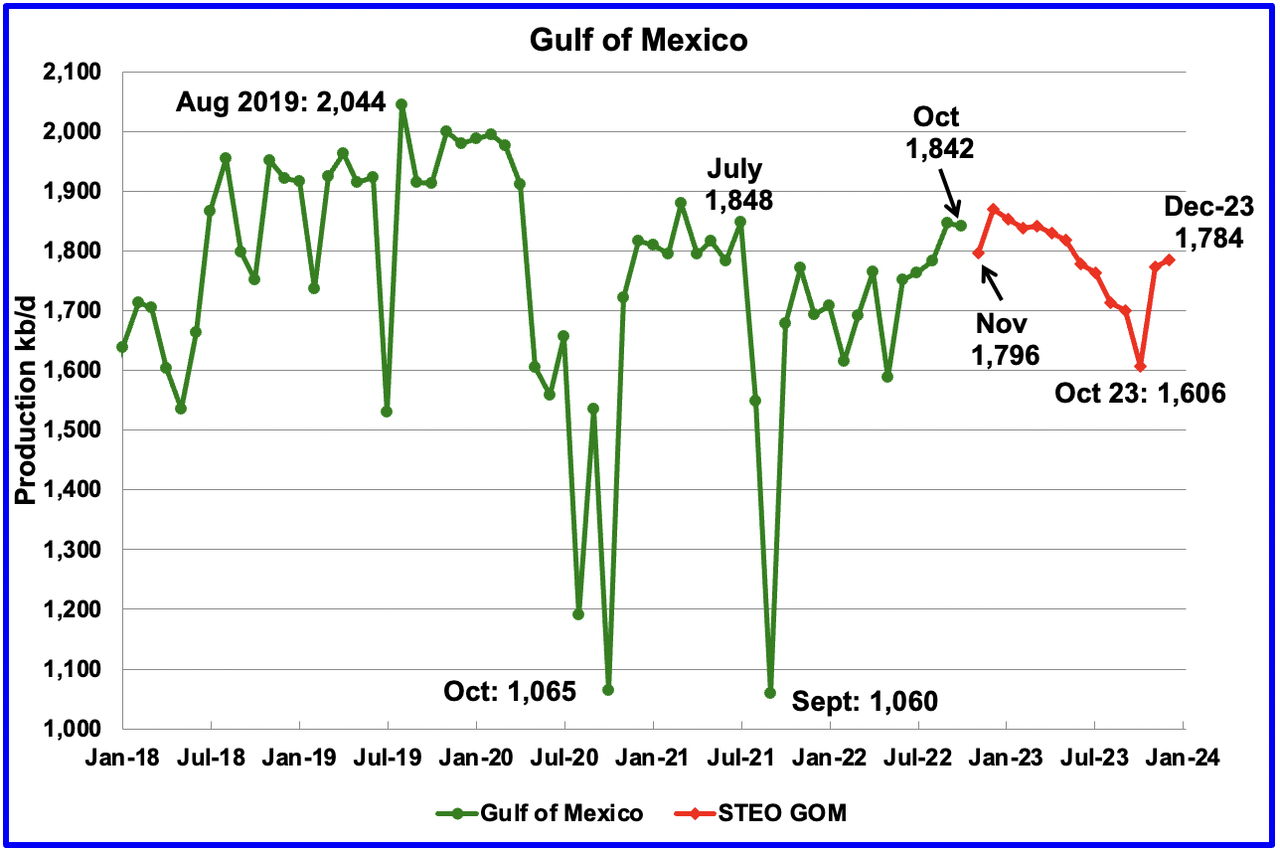
GOM production dropped by 5 kb/d in October to 1,842 kb/d. If the GOM was a state, its production would normally rank second behind Texas.
The December 2022 STEO projection for the GOM output has been added to this chart and projects output will be 1,784 kb/d in December 2023, 43 kb/d lower than reported in the November report. The production decline in 2023 is due to decline in existing GOM fields not being offset by the increases in crude oil production from the new fields mentioned below.
According to this source, the EIA expects nine new Gulf of Mexico fields to start production this year. The fields expected to come online this year include those at Argos/Mad Dog 2, Vito, Lobster, Dome Patrol, Olympus, Taggart, and the Kings Quay fields. The EIA noted that the large development fields at Argos/Mad Dog 2, King’s Quay, and Vito each has a peak production capacity of 100,000 barrels of oil equivalent per day or more.
An update from Equinor states that Vito startup has been delayed till early 2023.
A Different Perspective on US Oil Production
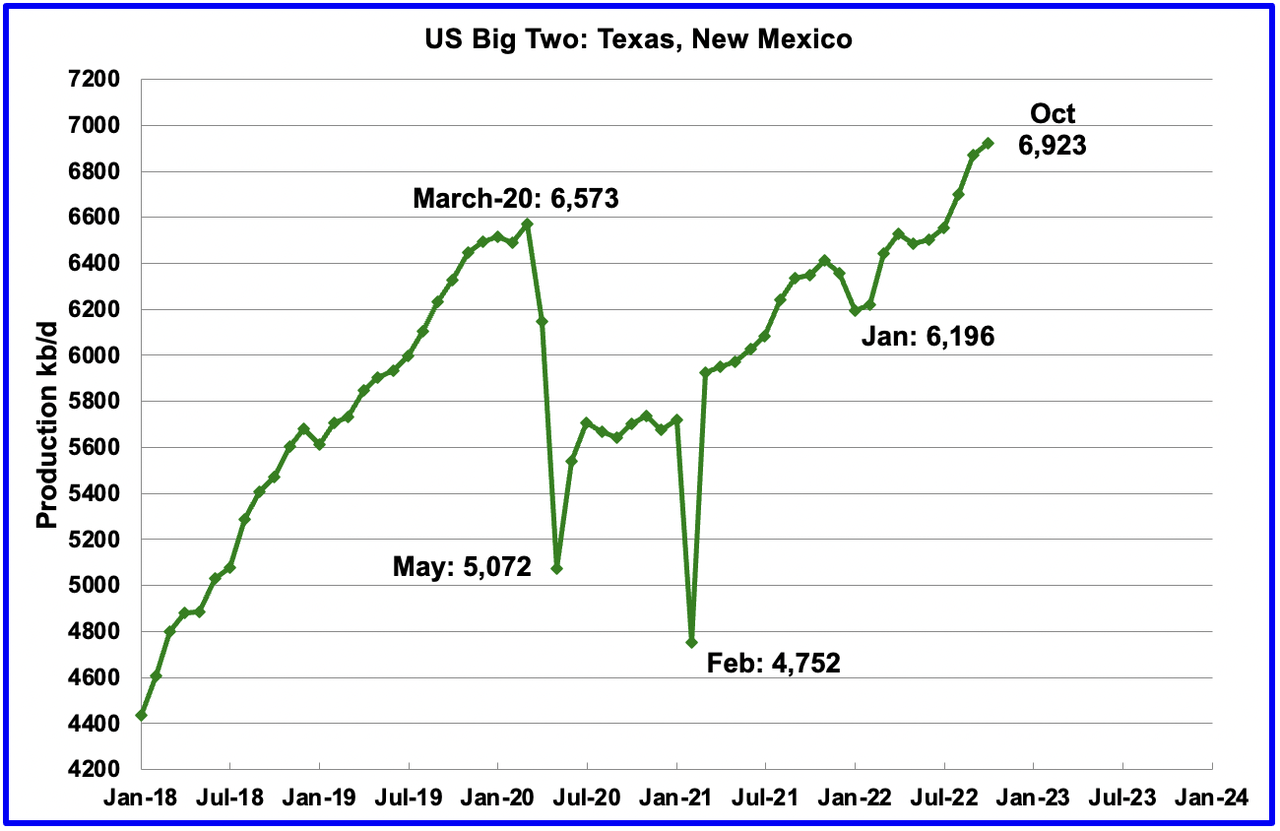
The Big Two states, combined oil output for Texas and New Mexico.
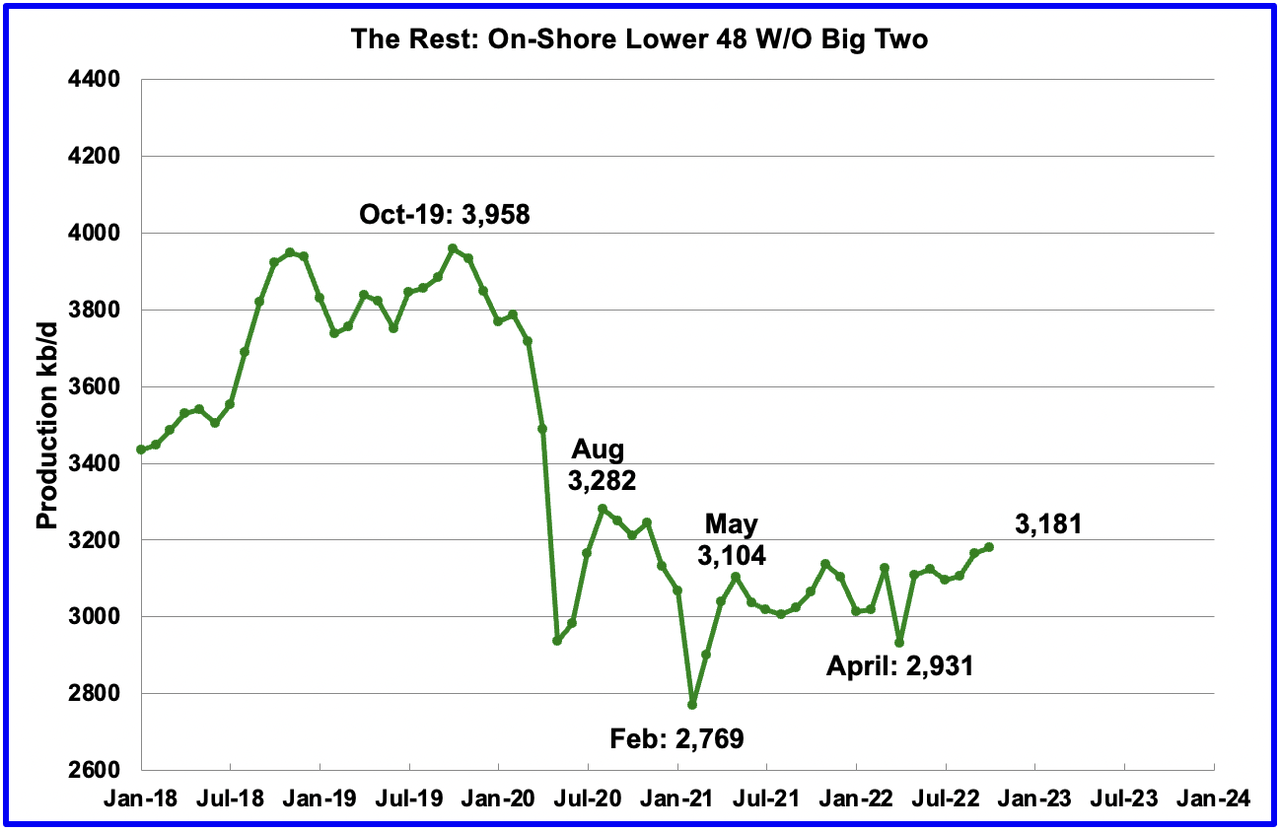
Oil production by The Rest
October’s production in the Big Two states increased by a combined 52 kb/d to a new high of 6,923 kb/d with Texas adding 11 kb/d and New Mexico 41 kb/d. In October The Rest increased output by 17 kb/d to 3,181 kb/d, most of which came from Utah 11 kb/d and Wyoming 7 kb/d.
The main thing to notice in the Rest Chart is that current production is 777 kb/d below the high of October 2019. The question we need answered Is “Is this a permanent loss that will never be recovered?”
Comparing May 2021 output with October 2022 output, the Rest have added 77 kb/d to US output, indicating a period of slowly increasing production.
Rigs and Fracs
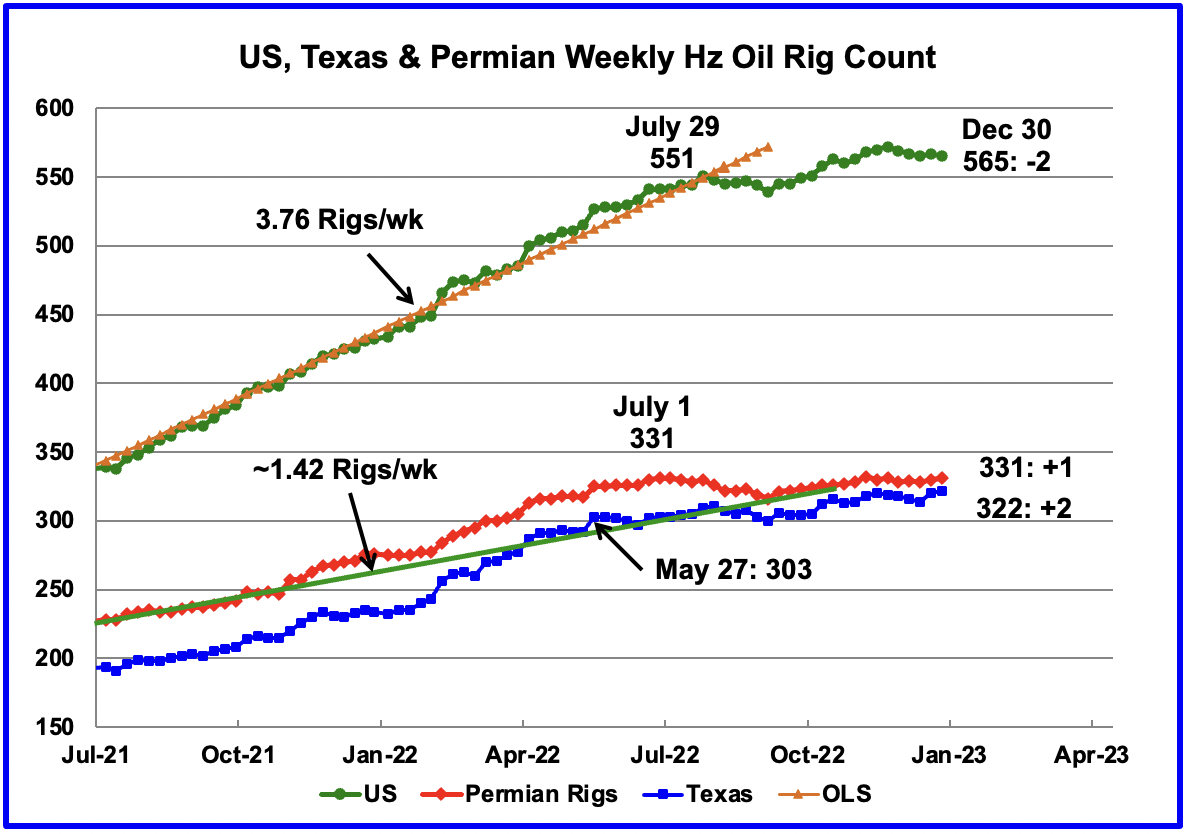
Since the beginning of April 2021 through to the week ending July 29, 2022, the US has been adding horizontal oil rigs at a rate of close to 3.82 rigs/wk, orange OLS line, and peaked at 551 rigs in the week ending July 29. However since then the number of operational rigs has wondered sideways. In the week ending December 30, the number of rigs decreased by 2 to 565.
In the week ending December 30, the Permian added 1 rig and Texas added 2.
In the Permian, the general trend for the number of operational rigs since July has been flat. This indicates that the growth in rigs has occurred primarily in the other US basins.
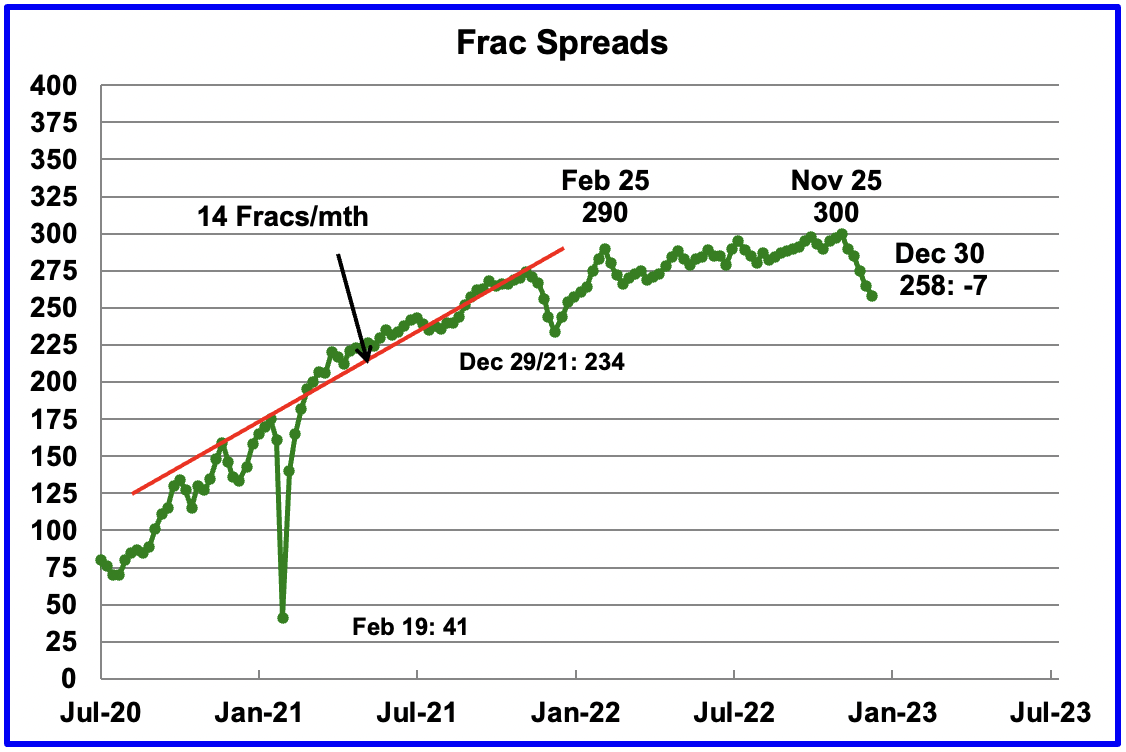
For frac spreads, the general trend since late February can best be described as essentially flat around the 290 level but with a hint of a slow increase toward 300 frac spreads. However for the week ending December 30, the count dropped by 7 to 258 for an overall drop of 42 since November 25. This is the end or close to the end of this dropping period as this is the slowdown associated with Thanksgiving and Christmas holidays. A similar trend occurred last year.
Note that these 258 frac spreads include both gas and oil spreads.
In a YouTube video I came across the other day, the commentator said that of the 300 Frac spreads operating in the week ending November 25, 160 were in the Permian. This is consistent with other reports that have stated that 1/2 of the frac spreads are in the Permian. No indication of the split between oil and gas.
Drilling Productivity Report
The Drilling Productivity Report (DPR) uses recent data on the total number of drilling rigs in operation along with estimates of drilling productivity and estimated changes in production from existing oil wells to provide estimated changes in oil production for the principal tight oil regions. The December DPR forecasts production to January 2023 and the following charts are updated to January 2023.
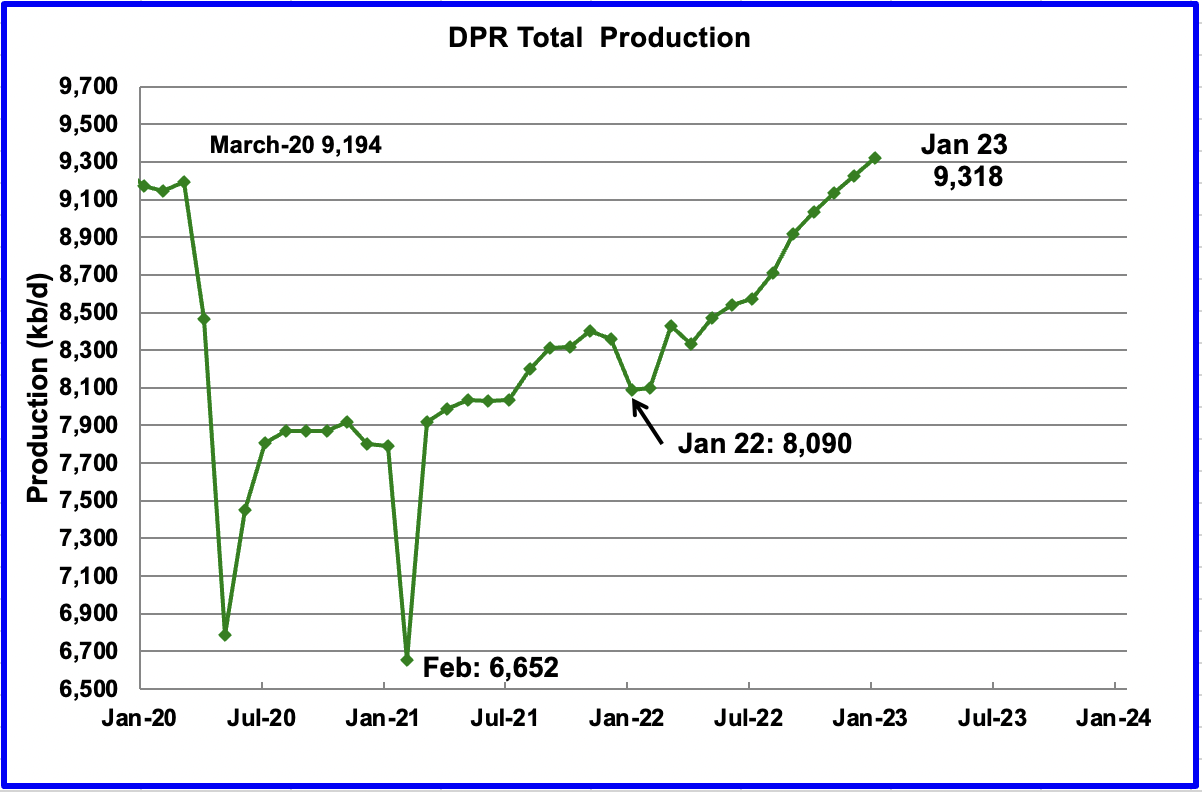
Above is the total oil production projected to January 2023 for the 7 DPR basins that the EIA tracks. Note that DPR production includes both LTO oil and oil from conventional wells.
The January DPR report made minimal revisions to the December report. For instance, December output was revised up by just 34 kb/d. The DPR is projecting that oil output for January 2023 will increase by 94 kb/d to 9,318 kb/d. January’s output is projected to be 45 kb/d higher than the pre-pandemic high of 9,273 kb/d.
From January 2022 to January 2023, output in the DPR basins is forecast to increase by 1,228 kb/d or by an average growth rate of 102.3 kb/d/mth. This high growth rate is almost double the rate, 48.3 kb/d/mth, shown in the LTO report in the next section. Since the LTO underwent a significant downward revision, a similar revision could be made to the DPR report next month.
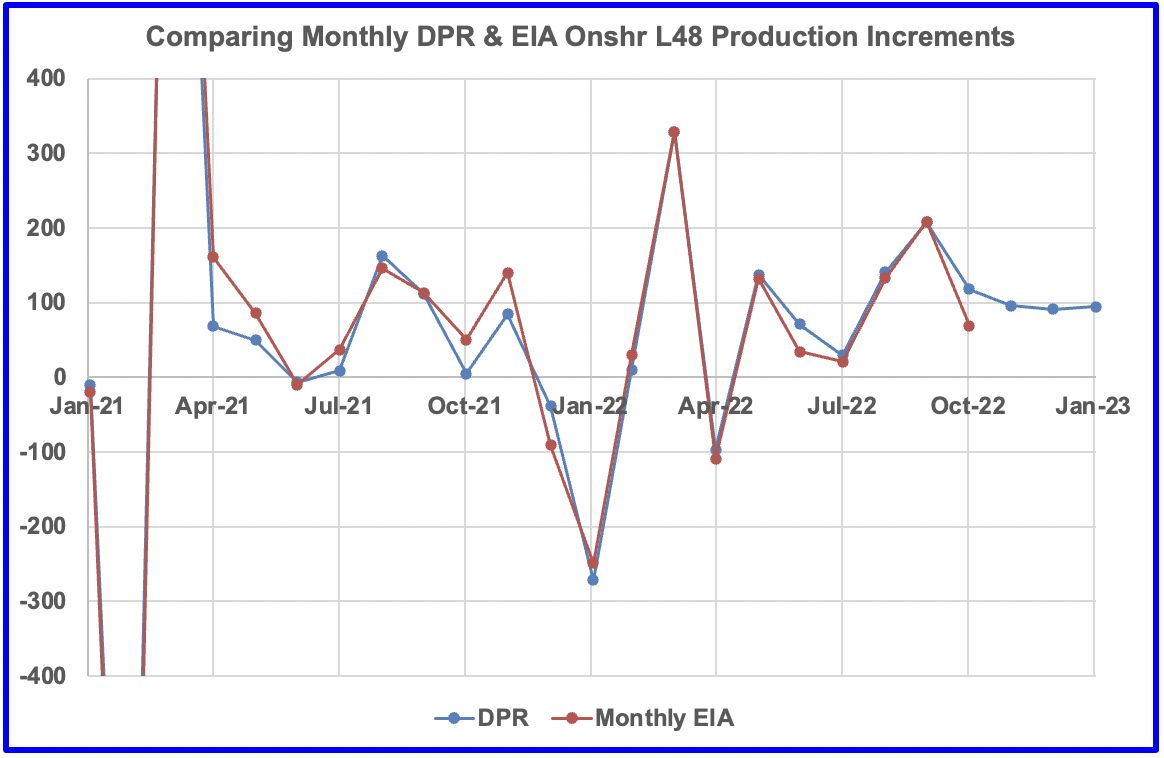
This is a comparison of the DPR’s Monthly output increments, as taken from the January 2023 DPR report, with the EIA’s monthly output increments for the Onshore L48 states. The October EIA data point was released after the DPR report was issued. The DPR got the increment correct directionally, i.e, it would be smaller in October than in September, but was smaller than predicted, 69 kb/d vs 118 kb/d.
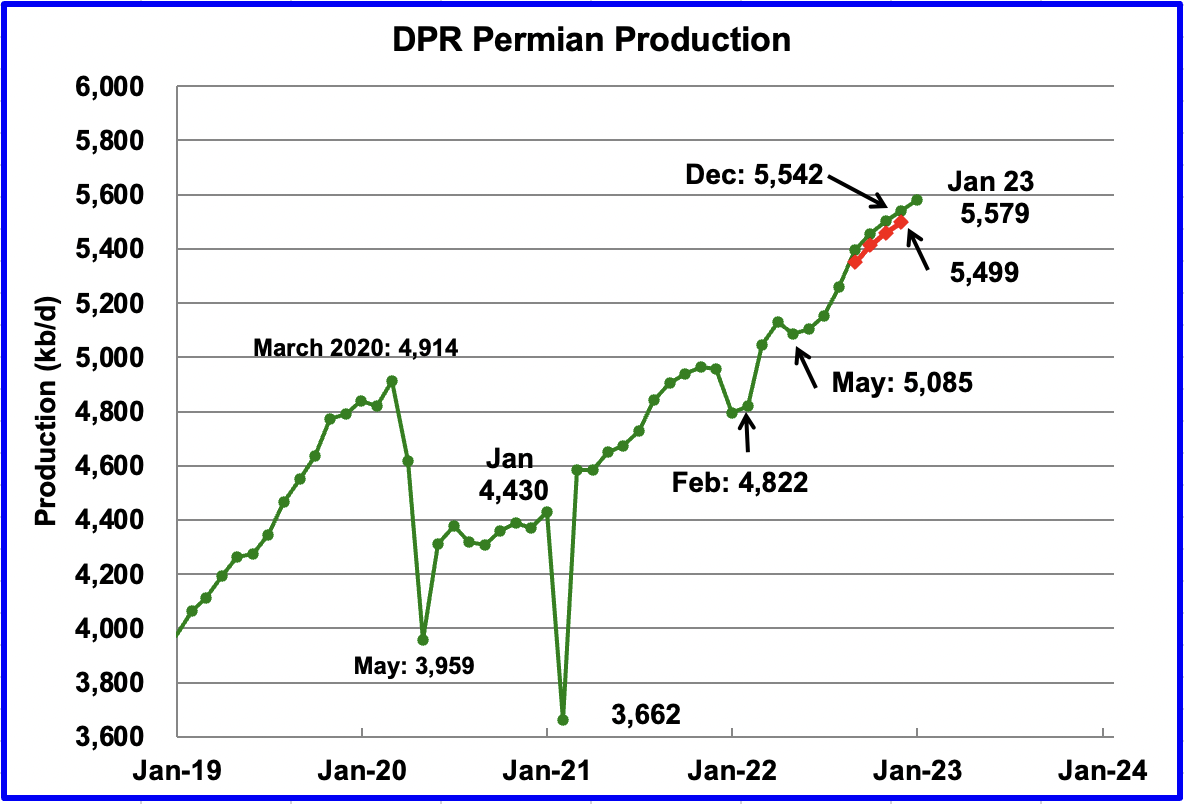
Permian output continues to rise in January. Production is expected to increase by 37 kb/d to a new high of 5,579 kb/d, which is also 80 kb/d higher than the December 2022 output published in the previous post due to revisions. Revisions have increased December output, red graph, by 43 kb/d. From May to January, production is forecast to increase by 494 kb/d or at an average rate of 61.8 kb/d/mth.
If the Permian were part of OPEC, at 5,579 kb/d it would be the second largest producer after Saudi Arabia.
In September 2022, output increased by 135 kb/d. The January increase is less than third of that at 37 kb/d. Is that a sign of slowing production in the Permian or just due to updated revisions?
During November, 427 wells were drilled and 435 were completed in the Permian. (Note that November is the latest month for DUC information). The completed wells added 366 kb/d to November’s output for an average of 841 b/d/well. The overall decline was 320 kb/d which resulted in a net increase for Permian output of 46 kb/d. Of the 435 completed wells, 381 were required to offset the decline. The completion of 8 extra DUCs over the drilled wells contributed 6.7 kb/d of the overall 46 kb/d increase, or 14.6%.
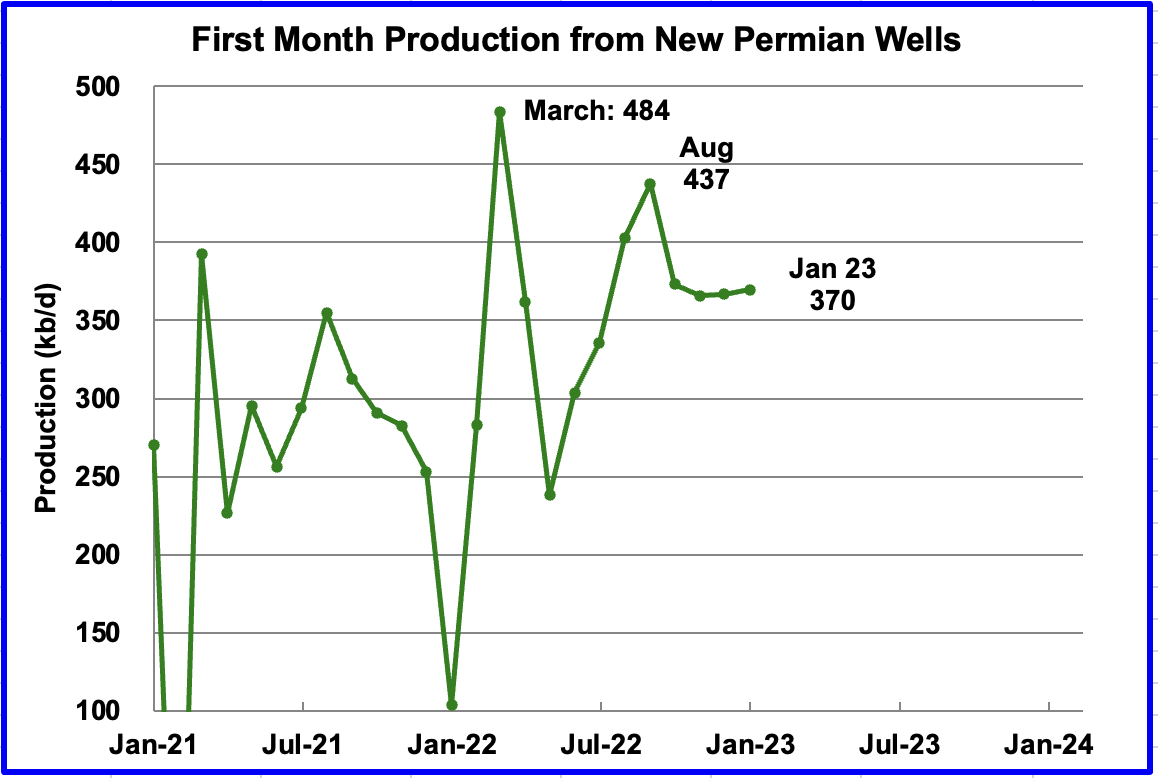
This chart shows the average first month total production from Permian wells tracked on a monthly basis. Since July 2022, the volatility shown in prior months has been reduced. Assuming the latest information is correct, total monthly production from the newest Permian wells may have stabilized around the 370 kb/d level. Part of the flat production shown is related to an essentially unchanging number of wells being completed, 435.
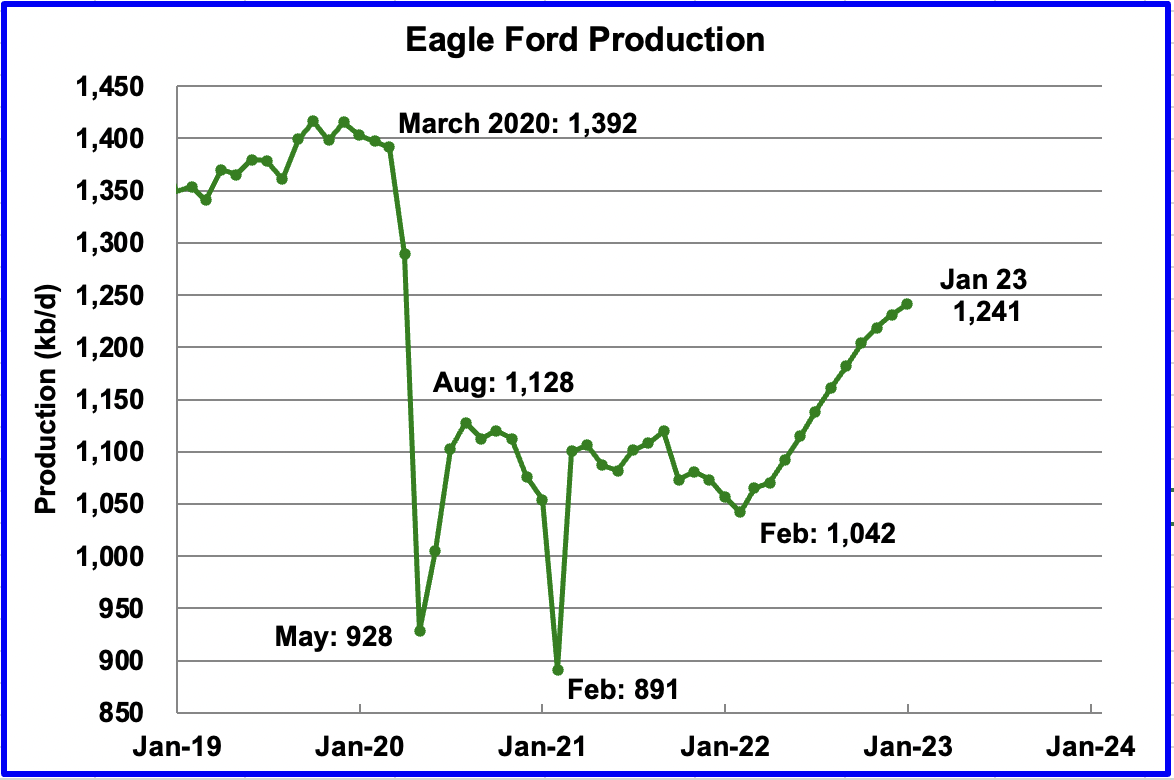
Output in the Eagle Ford basin has been showing an increasing trend since March 2022. For January, output is expected to increase by 10 kb/d to 1,241 kb/d. At the beginning of the year, 43 rigs were operating in the EF. As of December, 66 are operational and may account for the increasing production.
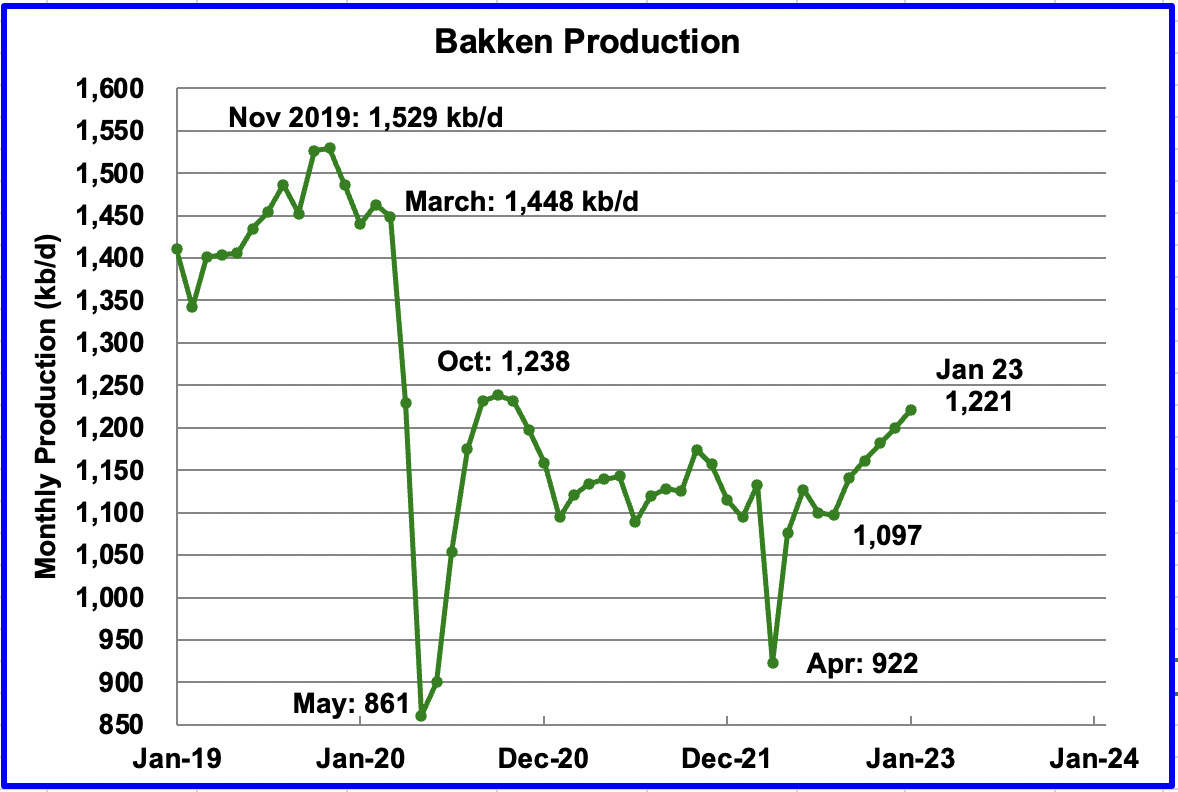
The DPR forecasts Bakken output in January will be 1,221 kb/d an increase of 20 kb/d over December. Production from September and onward looks optimistic considering the extreme weather that North Dakota has experienced recently.
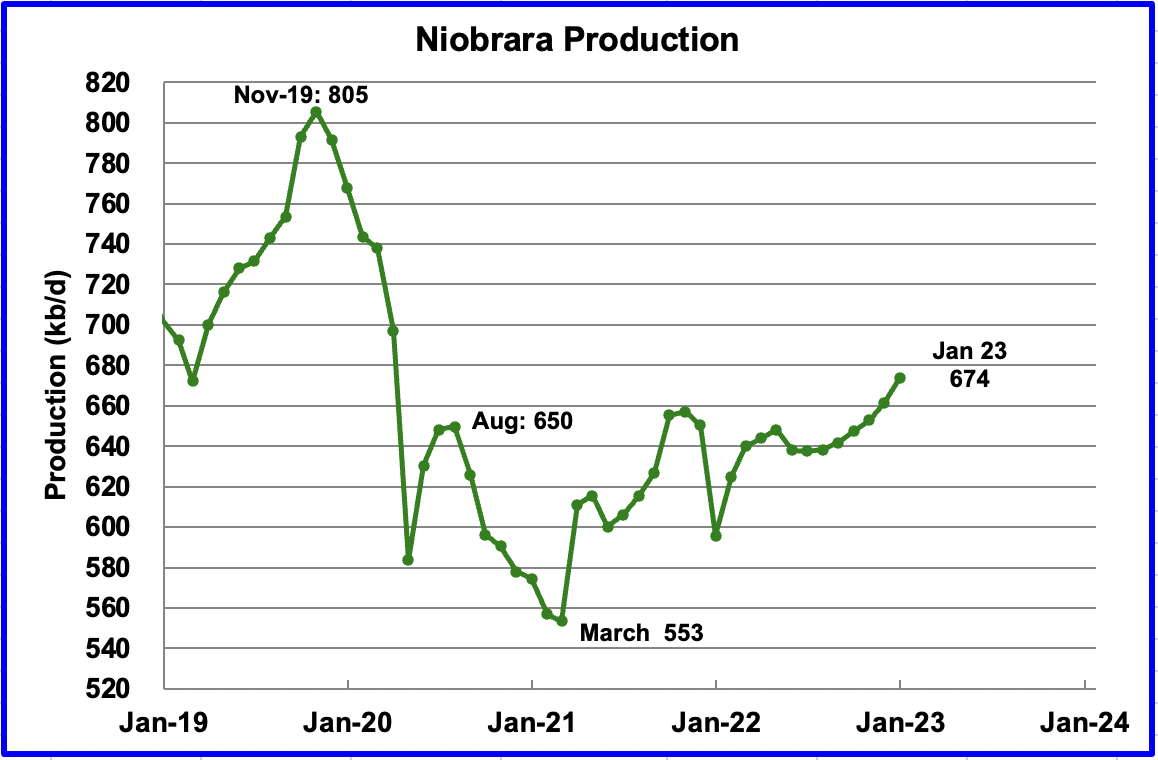
Output in the Niobrara continues to increase slowly. January output increased by 12 kb/d and set a post pandemic high of 674 kb/d.
The Niobrara had 12 rigs operating in January. By November, the count had increase to 19. In January, 83 wells were completed. By November, monthly completions increased to 112, which accounts for the increasing production. Further the number of wells drilled went from 56 in January to 75 in November and drilled exceeded completed by 10 in November.
DUCs and Drilled Wells
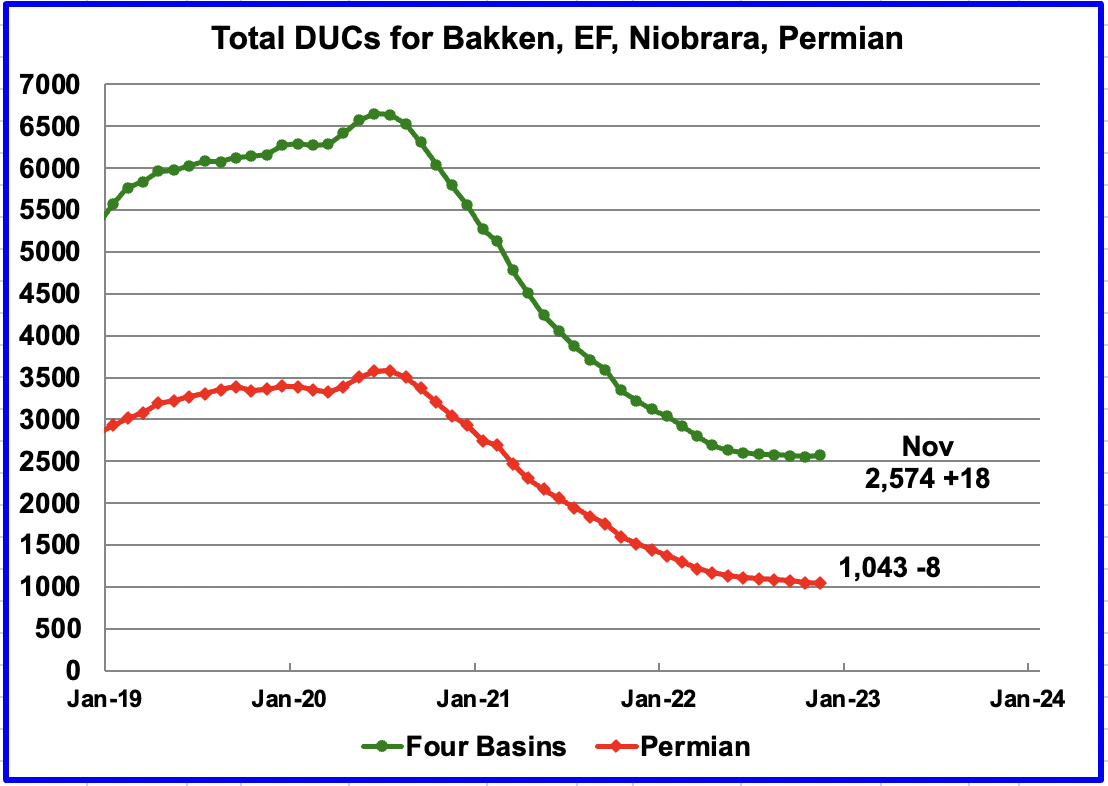
The number of DUCs available for completion in the Permian and the four major DPR oil basins has fallen every month since July 2020 but that trend has now reversed. In November the trend for total DUCs changed and increased by 18.
In the Permian, the change in the monthly completion rate for DUCs has slowed from a recent high of 82 in March to a low of 8 in November. However, in the Niobrara, 143 wells were drilled and 112 were completed for an overall net increase of 18 DUCs to 2,574 in the four basins.
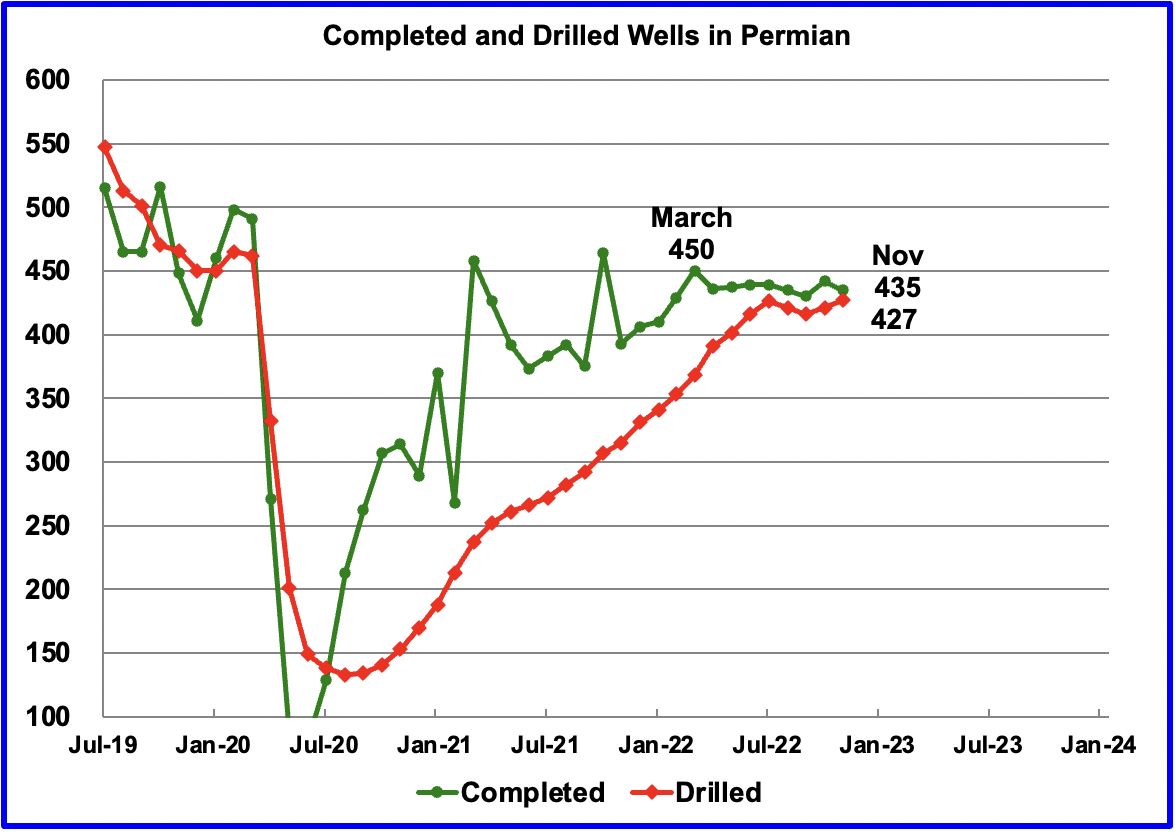
In the Permian, the monthly completion rate has been showing signs of slowing since the recent March peak of 450. This is consistent with the frac spread chart shown above where there has been little to no growth in frac spreads since February. Also the Permian rig count has been essentially flat since July.
In November 435 wells were completed, 7 fewer than in October and 15 fewer than in March. During November, 427 new wells were drilled, an increase of 6 over October. The gap between drilled and completed wells in the Permian has now reached new post pandemic low of 8.
December Light Tight Oil Update
The EIA’s LTO database provides information on LTO production from seven tight oil basins and a few smaller ones. The December 2022 report updates tight oil production to November 2022.
This is the fourth LTO report published since it was updated due operational issues. While the first report revised production down, a bit much it appears, the second and third reports revised production up. The current fourth update has reversed direction and made a significant downward revision to the production reported in the previous report.
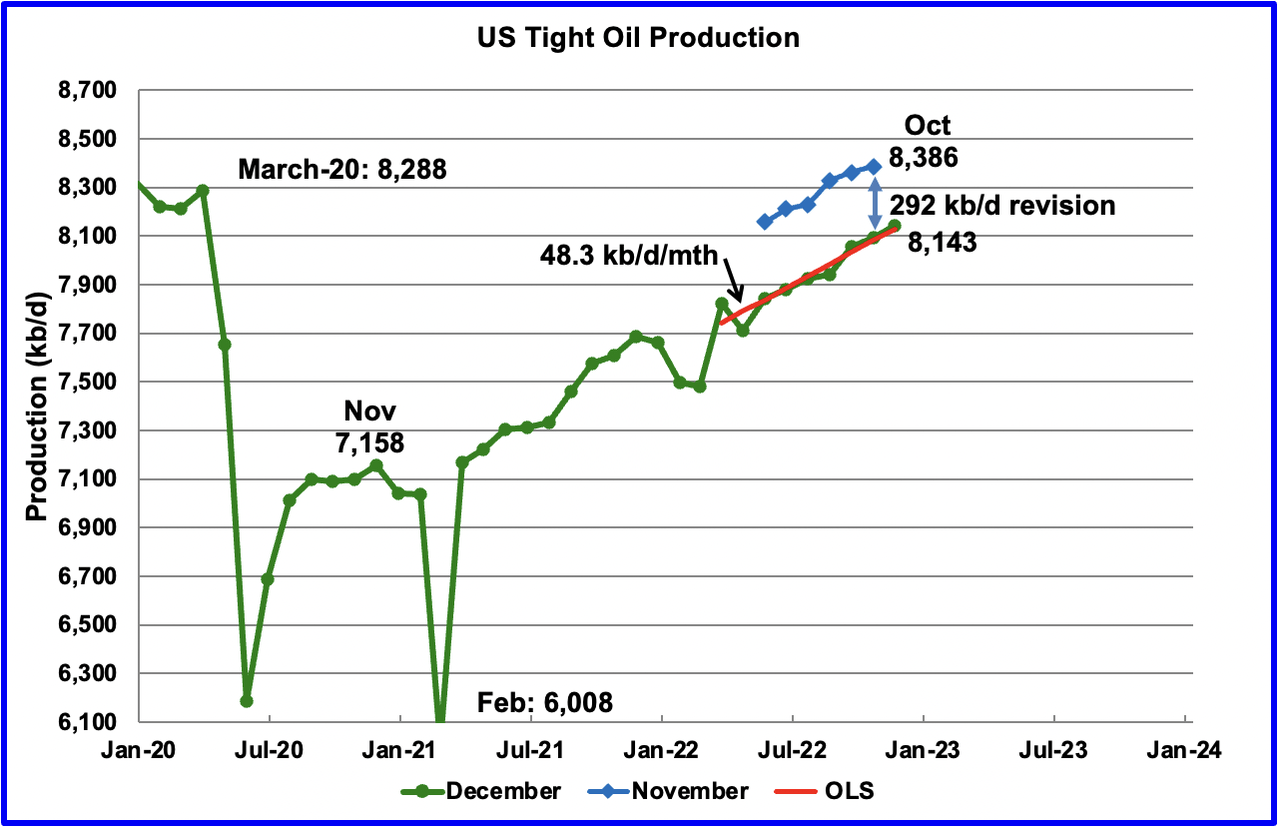
According to the latest LTO report, November’s LTO output increased by 49 kb/d to 8,143 kb/d.
However, the December report made a significant downward revision to projected US LTO output reported in the November report. For instance, October production in the November report has been decreased from 8,386 kb/d to 8,094 kb/d in the current report, a decrease of 292 kb/d.
The red OLS line from March 2022 to November 2023 indicates a monthly production increase of 48.3 kb/d/mth.
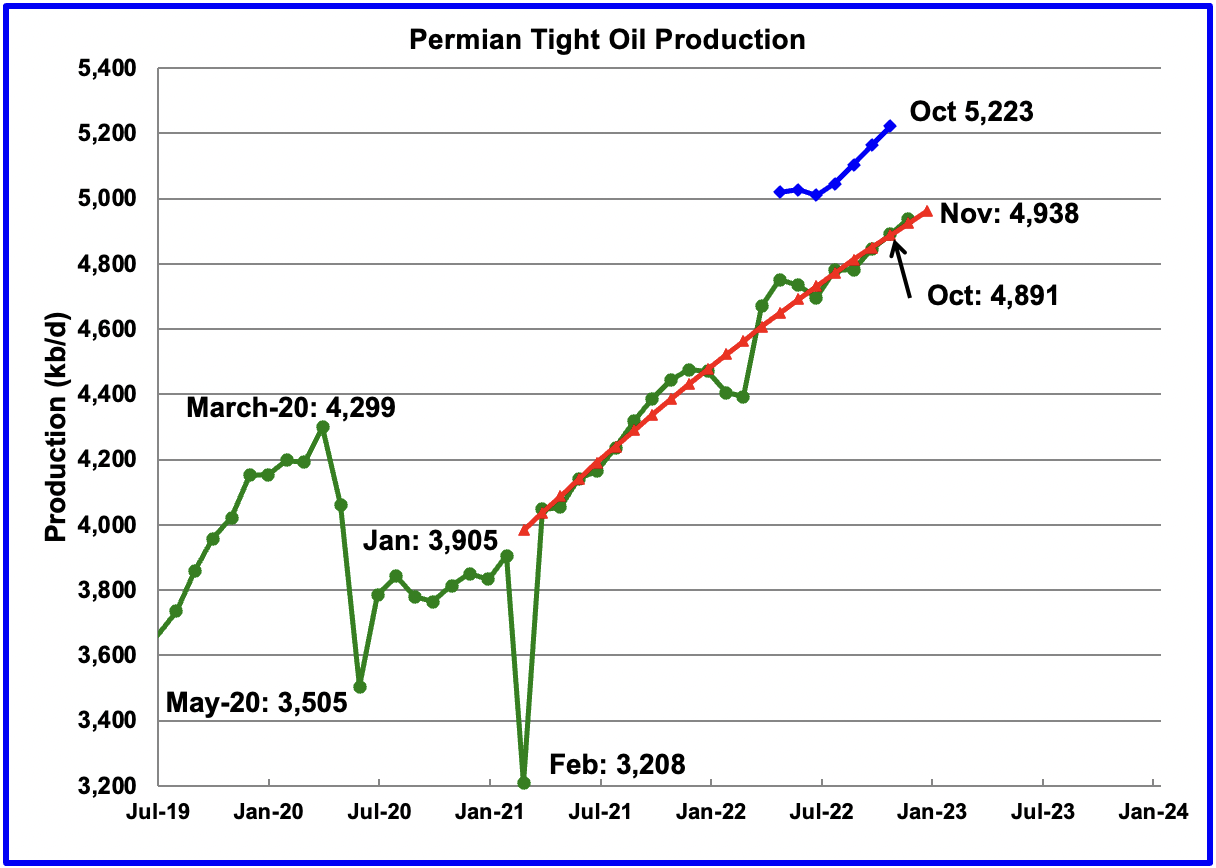
November’s output increased by 47 kb/d to 4,938 kb/d and is 639 kb/d higher than the high of 4,299 kb/d recorded in March 2020. Also shown is the October output, blue graph, from the previous post. The December LTO report revised October’s output down by 332 kb/d to 4,891 kb/d.
The monthly production increments for the last three months appear to be smaller than those around June 2021. Is this an early indication of slowing output in the Permian? In July 2021, completions were around 400/mth while the current rate is closer to 435/mth and have been steady at close to that level for the last 8 months.
To better asses whether there is a slowing trend, a quadratic least squares, QLS, was fit to the data from March 2021 to November 2022, red graph. The monthly production rate in March 2021 is 53.6 kb/d/mth. At November 2022, the monthly rate is 36.4 kb/d/mth. This slowing growth trend can be attributed to the almost steady completion rate of 435 wells per month and possibly lower quality wells. See next chart…
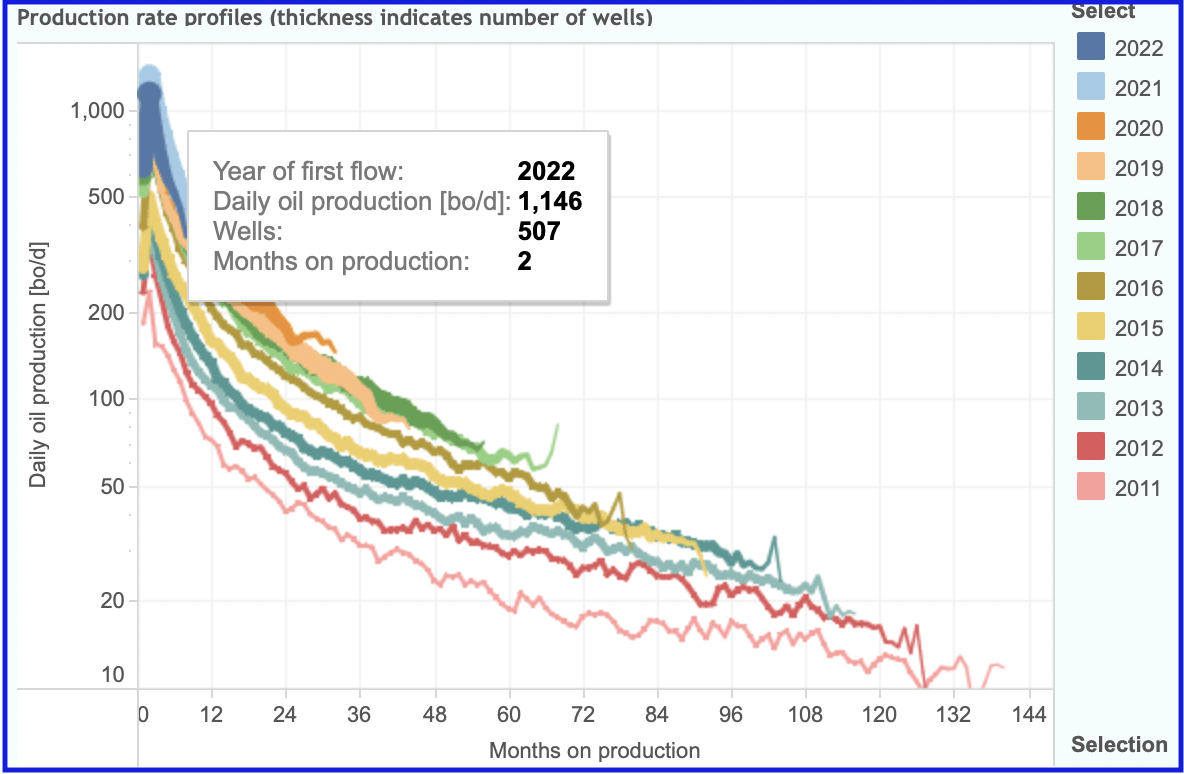
Above is a chart taken from Novi Labs. It shows peak production from the wells in Lea county, rated as one of the best Permian counties for productive oil wells, are lower in 2022 than in 2021. Peak production for the 2022 wells is 1,146 kb/d compared to 1,334 kb/d for the 2021 wells. To better assess the effect of the lower peak production, total output after one year should compared.
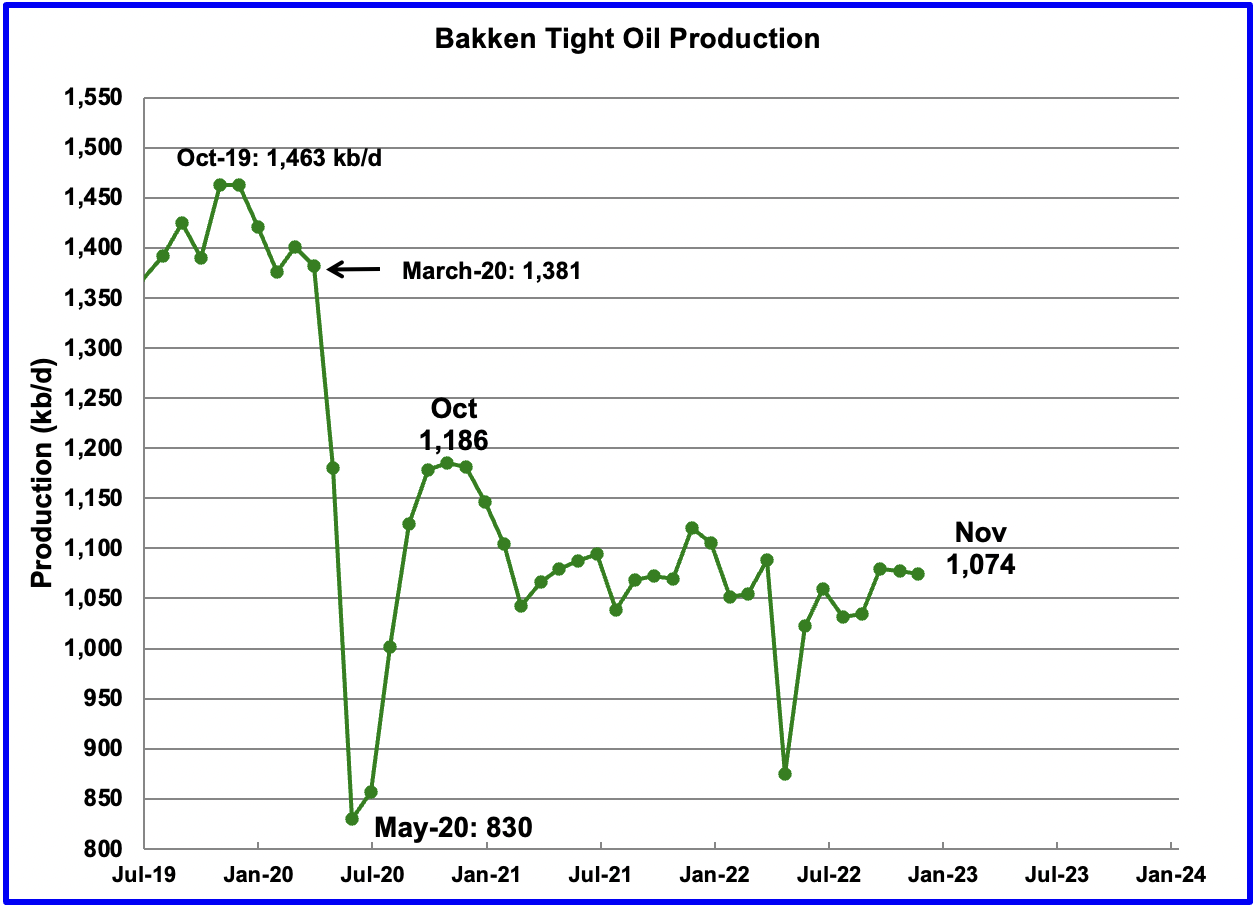
The Bakken’s November LTO output decreased by 3 kb/d to 1,074 kb/d. For comparison, note in the DPR Bakken report, November production increased by 21 kb/d and increased steadily from August to December.
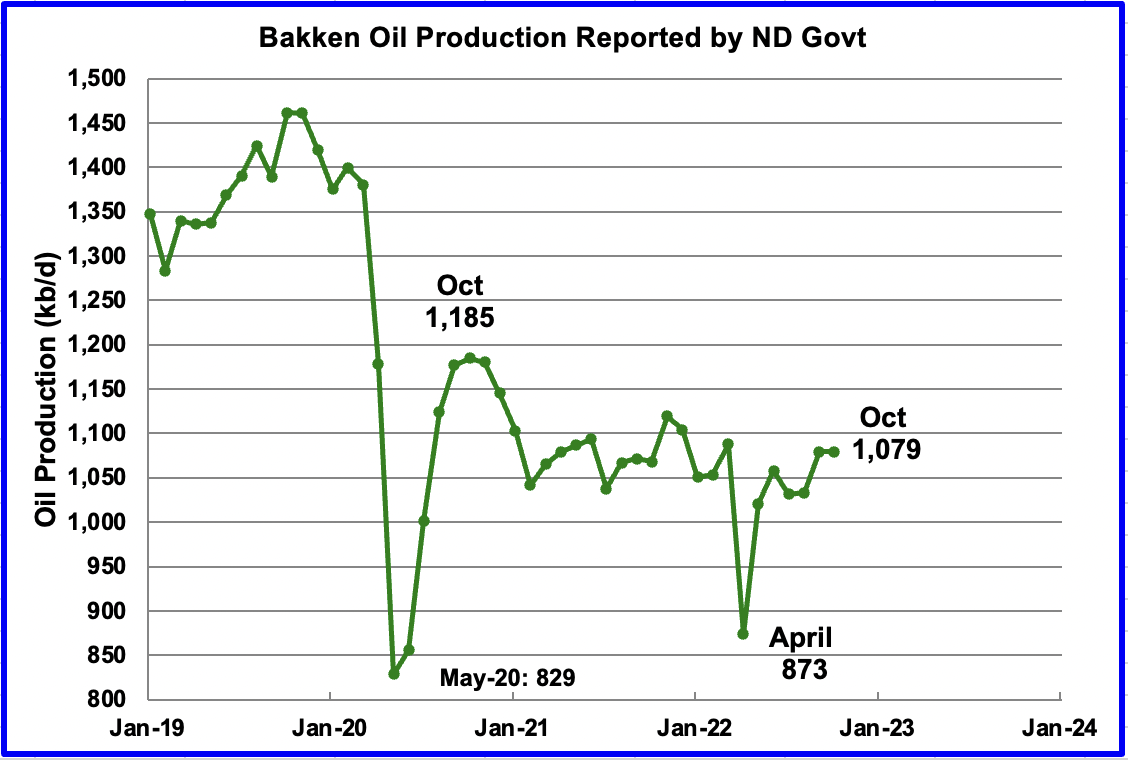
This chart shows the Bakken’s output as reported by the North Dakota Oil and Gas Division. October production was unchanged from September at 1,079. Up to October, the trends in the two charts are essentially the same.
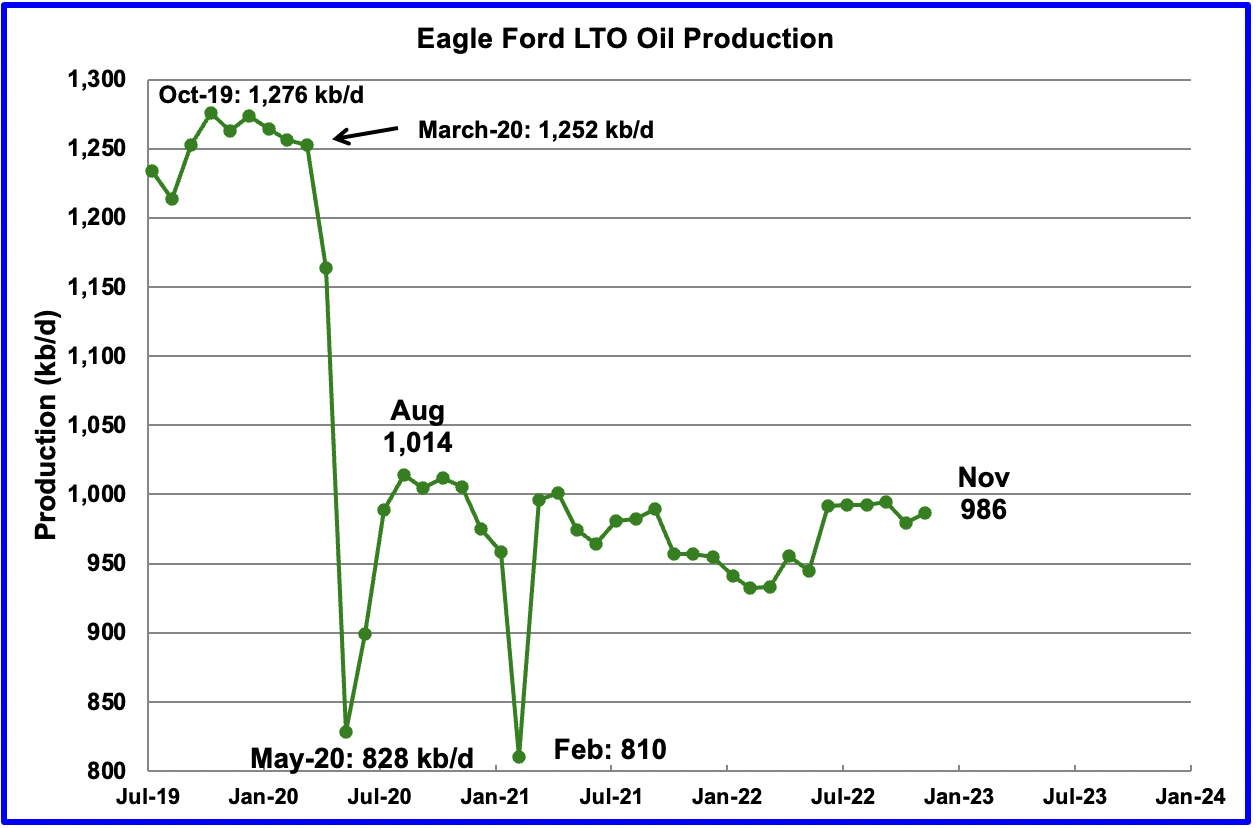
Production in the Eagle Ford basin increased by 7 kb/d in October to 986 kb/d and is little changed from March 2021. In the DPR section, November production is 1,219 kb/d and overall production is increasing.
The reason for the difference could be associated with the revised data in the LTO report that was not available to the DPR group at time of publishing.
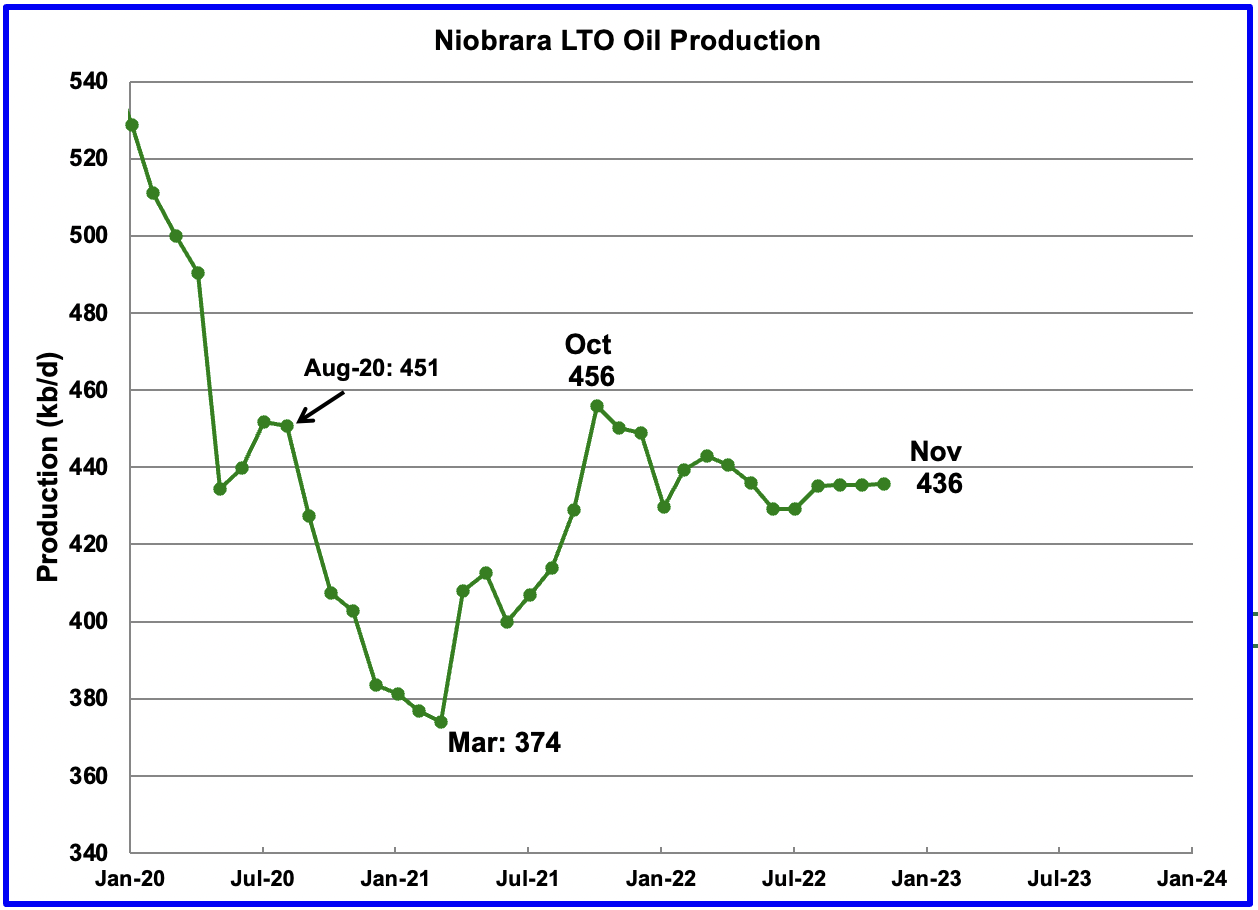
After increasing production from March 2021 to October 2021, output in the Niobrara began to drop in November 2021. Production since April has shown little growth. October’s output increased by 1 kb/d to 436 kb/d and has been essentially flat for the past four months.
Onshore L48 Conventional Production
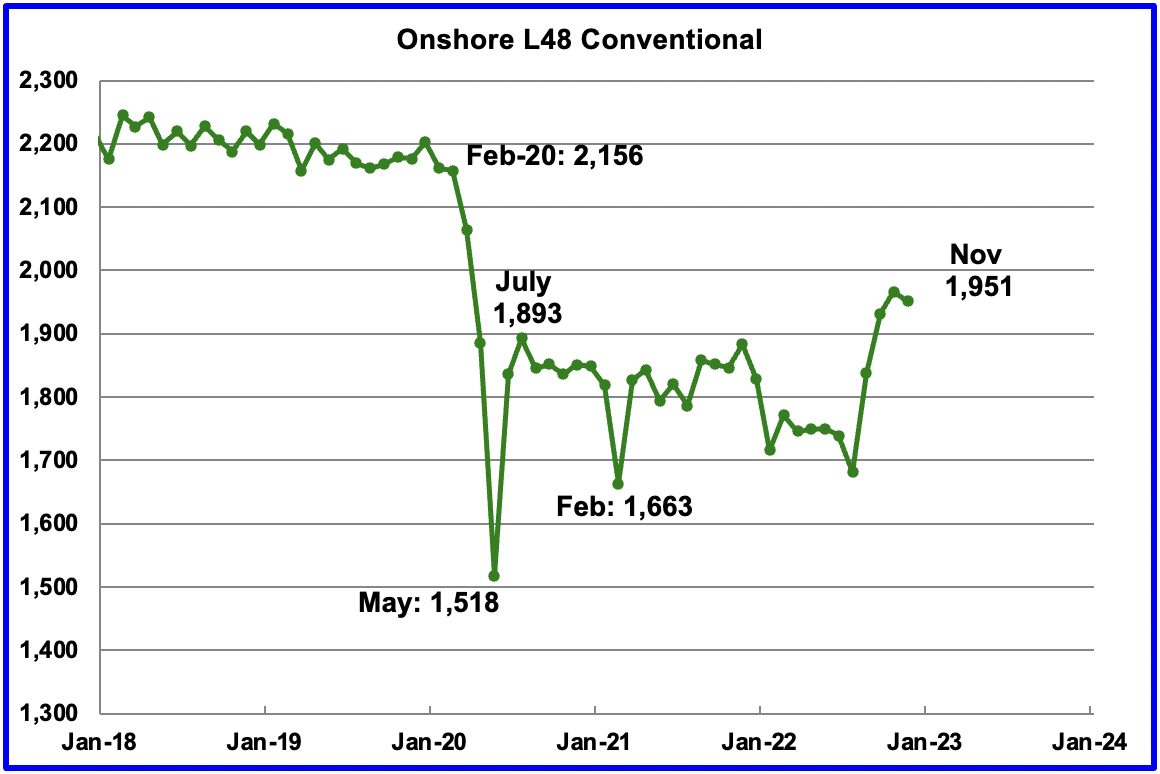
Conventional oil output in the Onshore L48 dropped by 15 kb/d in November to 1,951 kb/d and is 58 kb/d higher than July 2020. This estimate is based on a combination of the expected November LTO output and the December 2022 STEO report that has a November 2022 forecast for the US Onshore L48 output.
The big production increase in conventional crude in August 2022 is due to the the massive downward revision to LTO production shown in the first chart of this section. Note that the conventional oil estimate comes from subtracting two large numbers and is quite volatile on a month to month due to revisions.
Editor’s Note: The summary bullets for this article were chosen by Seeking Alpha editors.
Be the first to comment