

8vFanI
(This article was co-produced with Hoya Capital Real Estate)
Introduction
Some investors have turned to Real Estate Investment Trusts, or REITs, for their yields and hopefully, inflation protection via the underlying assets held by the individual REITs, or by a fund that invests in a set of REITs; useful for investors without the time/experience to do the proper due diligence on their own. While I own some individual REITs, most of my exposure to that asset class is via funds. Two of my Seeking Alpha sources are High Yield Landlord by Jussi Askola (who prefers individual REITs), and Hoya Capital Income Builder, for whom I contribute. In a recent posting for HCIB, they included the following chart.
HCIB article: Weekly Review: Betting On ‘Goldilocks’ (Hoya)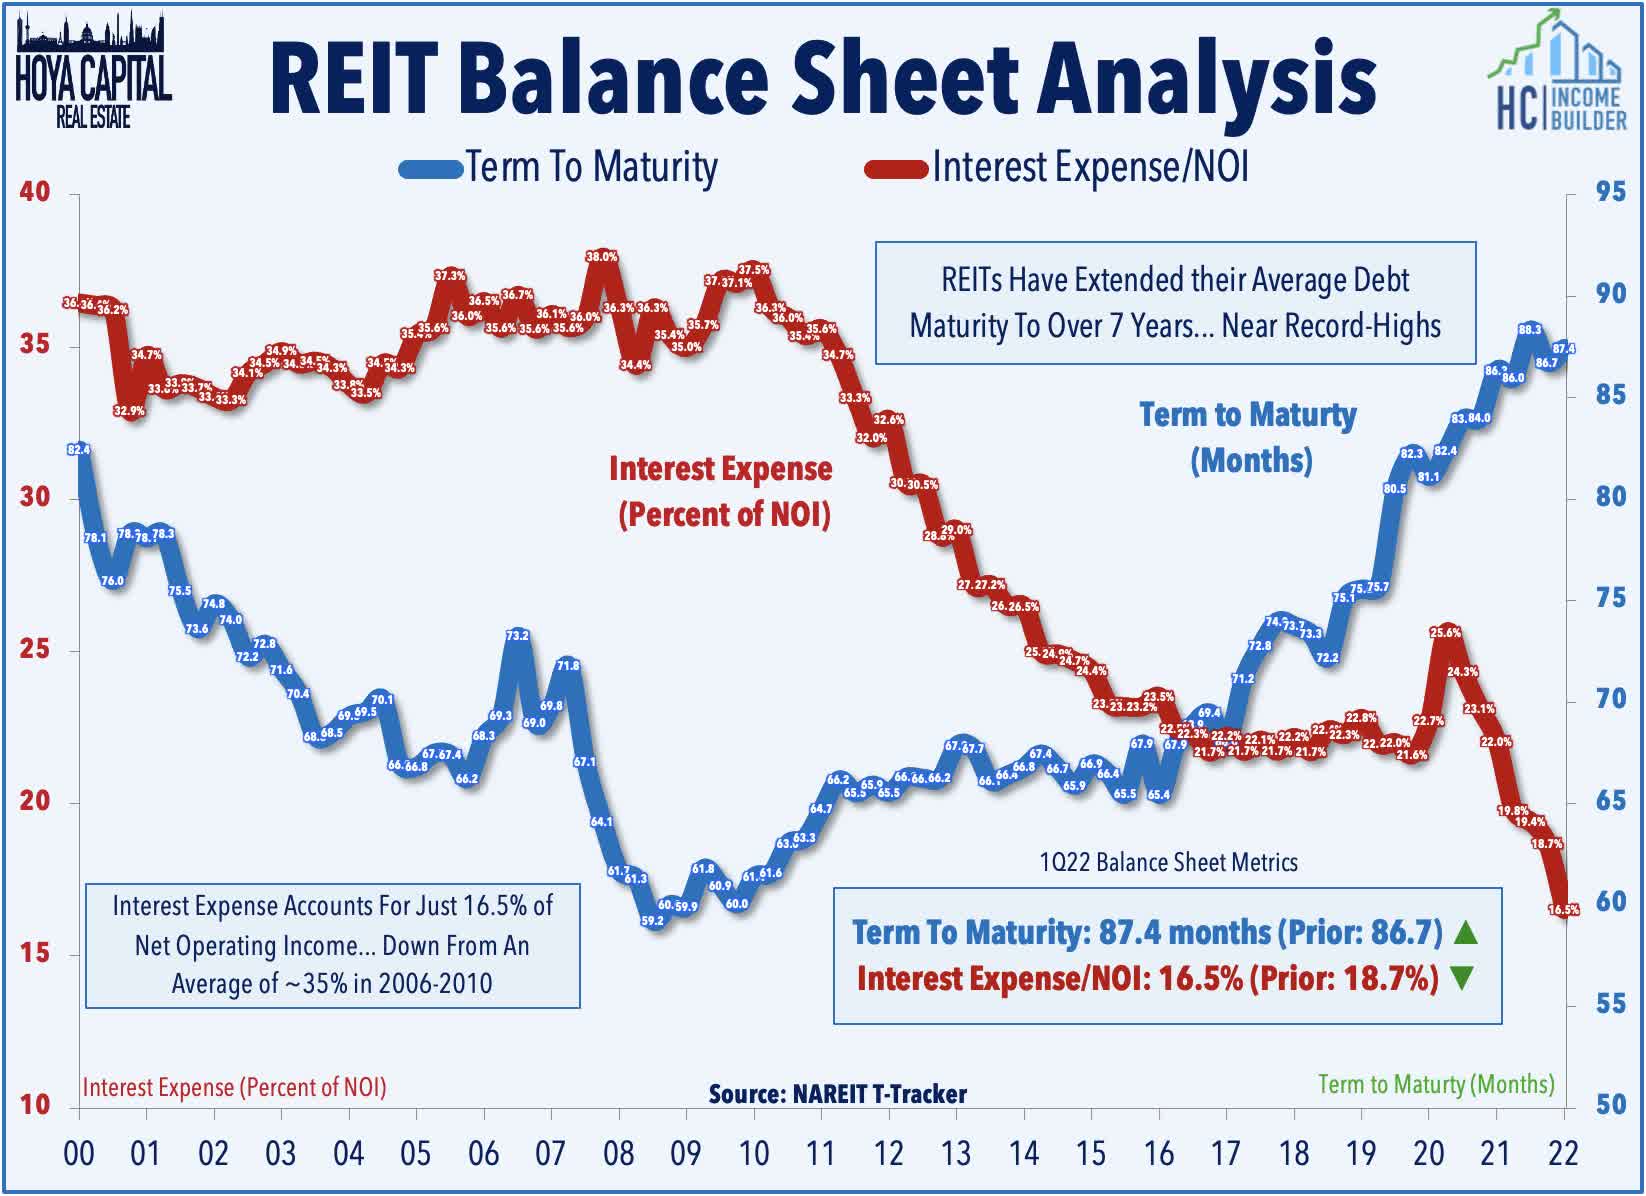
Unlike the past, when fighting inflation led to poor REIT returns, today, they are in a much stronger financial position. That fact is also shown in multiple charts used by Jussi (Important Warning For REIT Investors) that shows REITs improved debt positions since 2000.
SA article: Important Warning For REIT Investors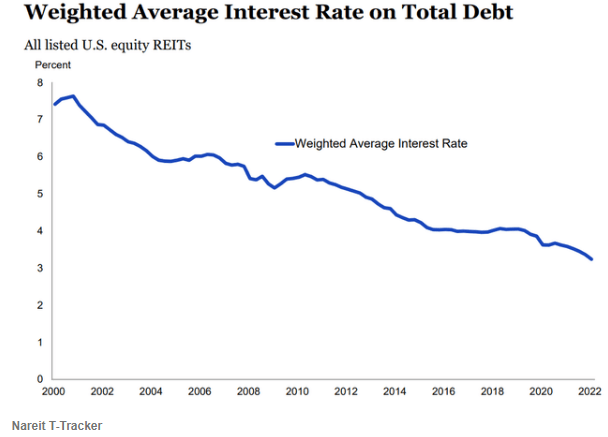
Jussi’s article goes into depth why HYL believes a recession will likely benefit REITs while doing minimal damage. For those looking long term, REITs as an asset class have provided similar returns as US stocks since 1994, but they can provide a performance offset as their correlation is only 61%.
PortfolioVisualizer.com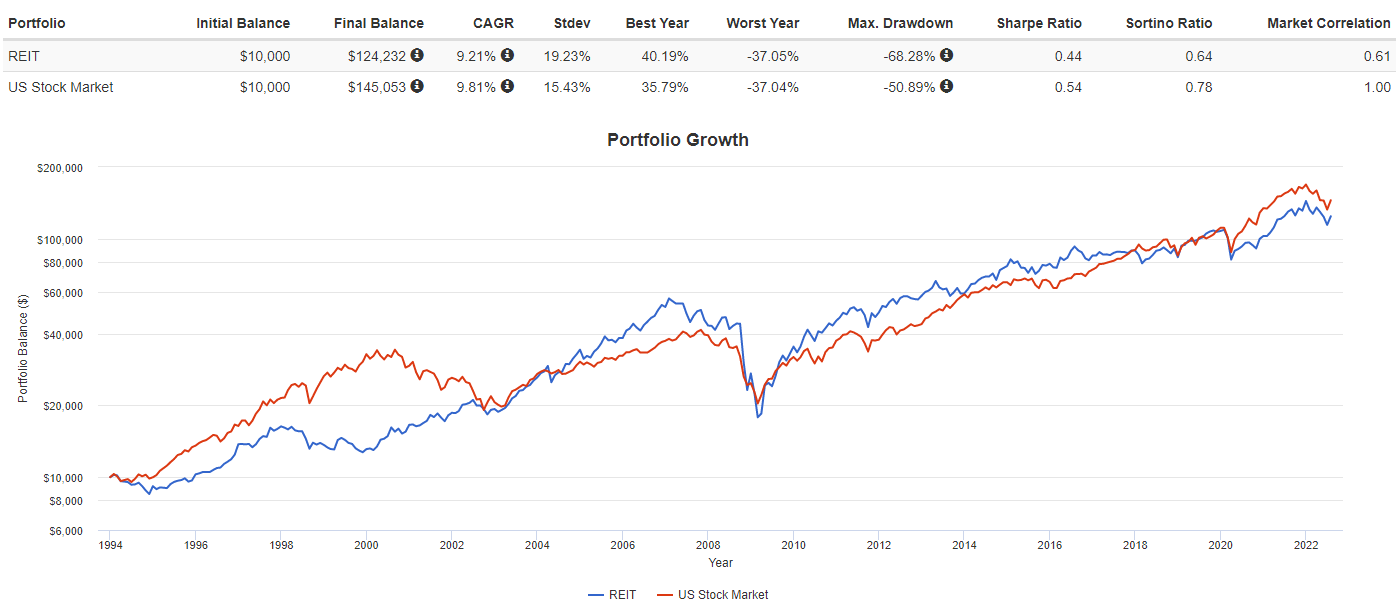
I picked these two REIT ETFs as they have one big difference that will appeal to different investors, most likely based on their investing risk level or manager preference. That difference is in the Index used, thus the number of assets owned. One is the iShares Cohen & Steers REIT ETF (BATS:ICF) which invests based on an in-house index, the Cohen & Steers Realty Majors Index that includes just 30 REITs. The other is the Vanguard Real Estate ETF (NYSEARCA:VNQ) based on the MSCI US Investable Market Real Estate 25/50 Index, and consists of 165 REITs.
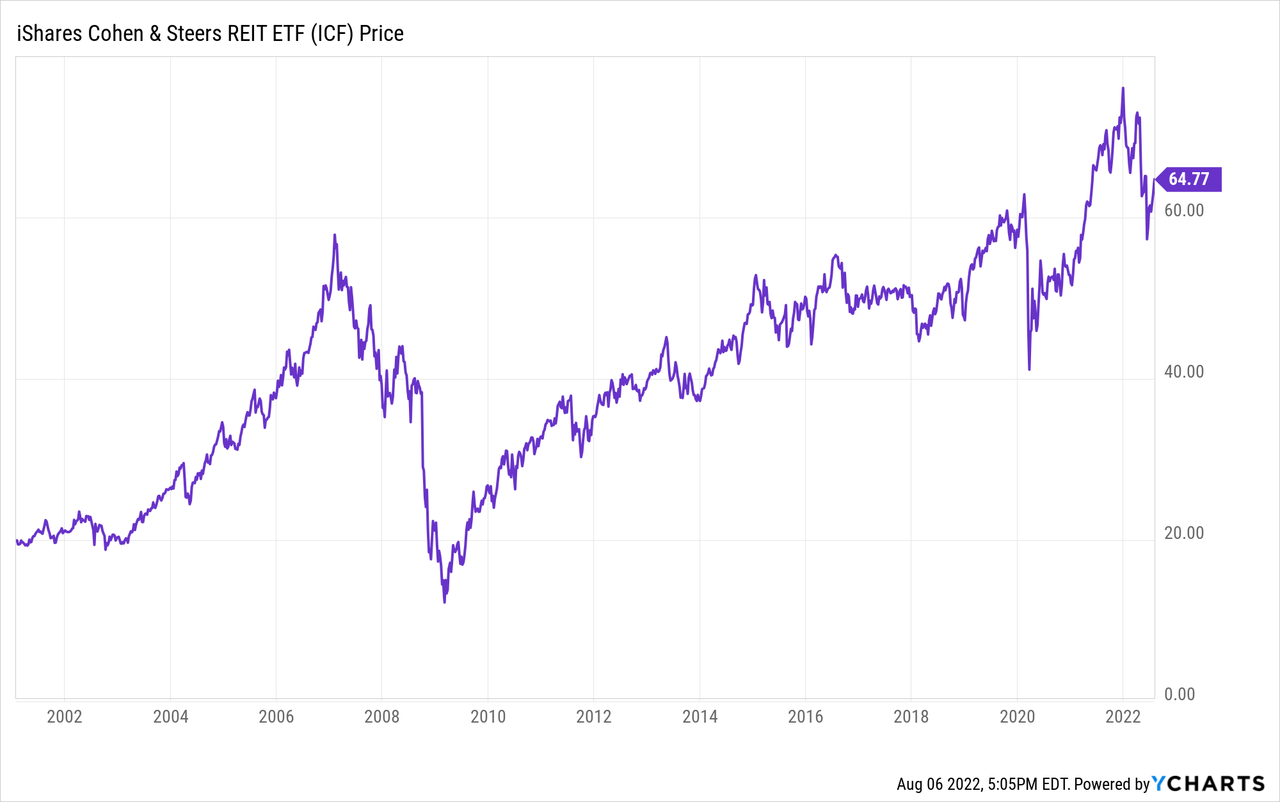
iShares Cohen & Steers REIT ETF review
Seeking Alpha describes this ETF as:
The ICF ETF is managed by BlackRock Fund Advisors. The fund invests in US stocks of companies operating across mortgage real estate investment trusts (reits), financials, diversified financials, equity real estate investment trusts (reits) sectors. It invests in growth and value stocks of companies across diversified market capitalization. The fund seeks to track the performance of the Cohen & Steers Realty Majors Index. ICF started in 2001.
Source: seekingalpha.com ICF
ICF has $2.7b in AUM and provides investors with a 1.87% yield. The managers charge 33bps in fees, putting them at a disadvantage to the Vanguard ETF by 21bps annually.
Index review
The Index manager provides this description of their Index:
The Cohen & Steers Realty Majors Portfolio Index offers what we believe is a superior approach to capturing the U.S. REIT market, providing a liquid, diverse representation of companies leading the real estate industry.
Composed of REITs that we believe are dominant in their respective property sectors, RMP is a unique, modified cap-weighted (Min $500m MC; 8% max weight) total return index of companies that is designed to mirror the dynamic changes taking place in the REIT market.
We believe the selected REITs are best positioned to lead or benefit the most from the securitization of the U.S. real estate industry. Stocks included in the index are also significantly more liquid than those in other REIT indexes.
Constituent weights are rebalanced quarterly to compensate for changes in shares outstanding and to adhere to the 8% weighting limit. This is performed as of the close of trading on the third Friday of February, May, August, and November. The same modified capitalization weighting method described earlier is used to calculate the weights of each component stock.
Source: assets.cohenandsteers.com RMP Index
ICF holdings review
iShares provides some relevant portfolio characteristics.
ishares.com ICF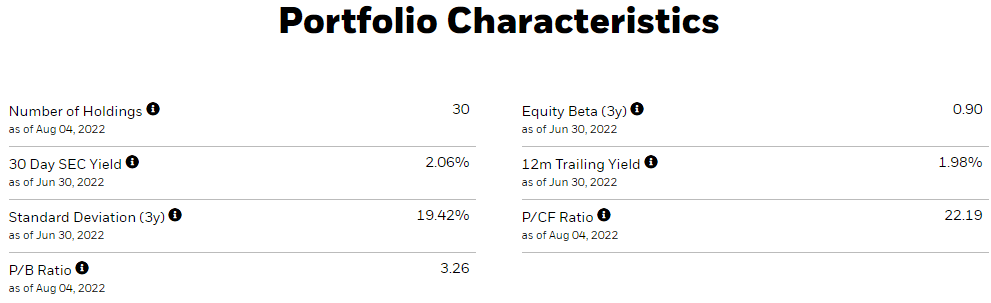
As the next chart demonstrates, REITs come in many flavors, just like stocks.
ishares.com ICF sectors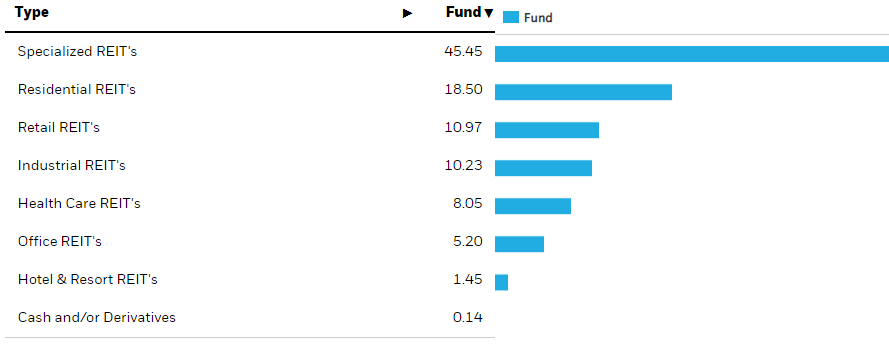
As the next table will show, Specialized REITs are mostly Cell Towers and Storage Unit assets.
Complete holdings list
ishares.com; compiled by Author (ishares.com; compiled by Author)
The Top 10 are 59% of the portfolio; the Top 20 covers 87%.
ICF distribution review
seekingalpha.com ICF DVDs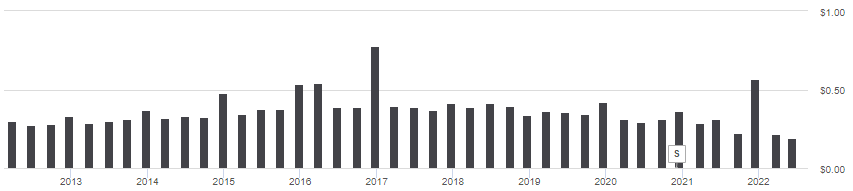
Dividends are paid quarterly, and with a few exceptions, have been trending downward in recent years. Seeking Alpha gives ICF’s payout history a “C+” rating.
seekingalpha.com ICF scorecard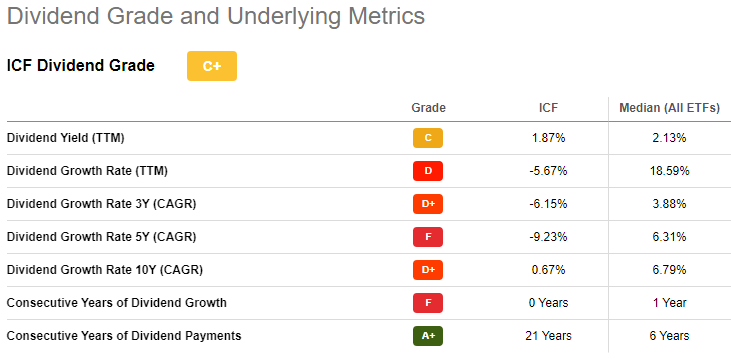
Vanguard Real Estate ETF review
Seeking Alpha describes this ETF as:
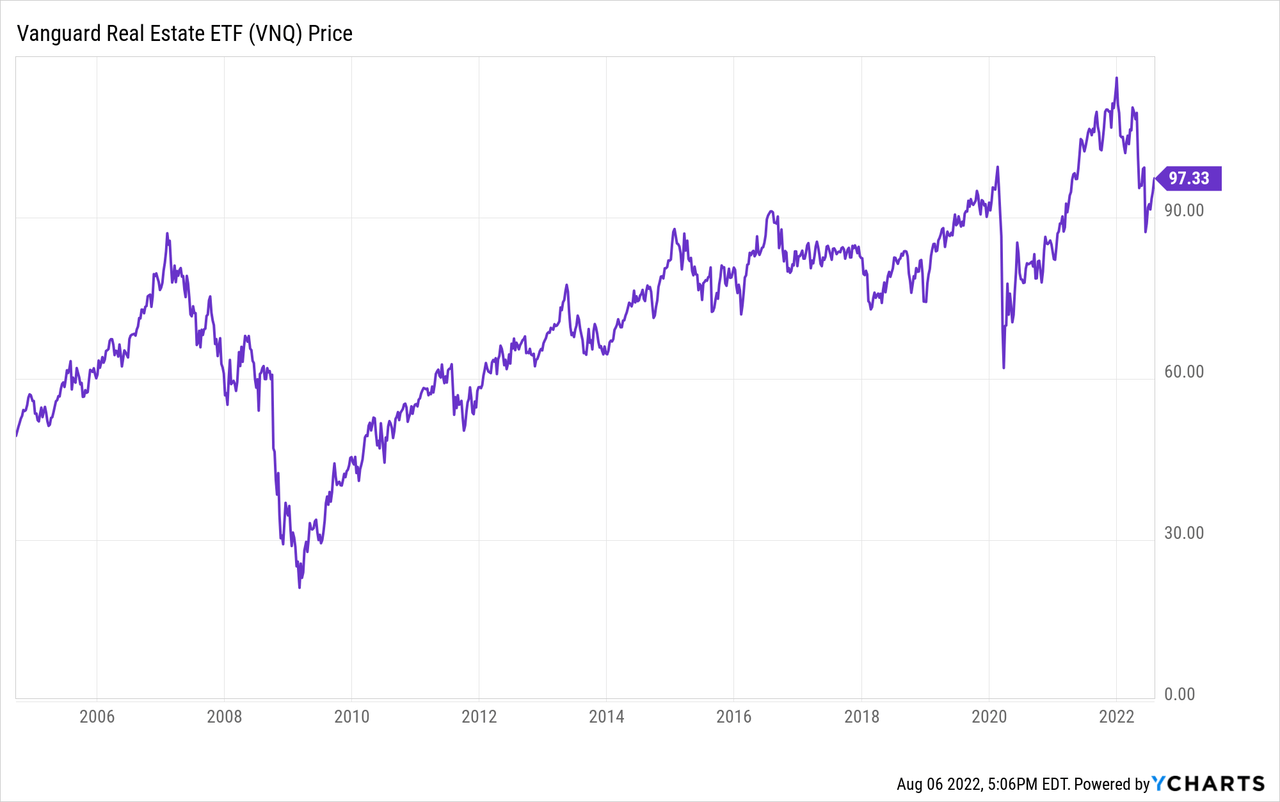
The Vanguard Real Estate ETF invests in stocks of companies operating across real estate sectors. It invests in growth and value stocks of companies across diversified market capitalization. It seeks to track the performance of the MSCI US Investable Market Real Estate 25/50 Index. VNQ started in 1996.
Source: seekingalpha.com VNQ
VNQ is large at $77b in AUM. The current yield is 2.95% and Vanguard charges only 12bps in fees.
Index review
The Index manager provides this description of their Index:
The MSCI US IMI Real Estate 25/50 Index is designed to capture the large, mid and small cap segments of the U.S. equity universe. All securities in the index are classified in the Real Estate sector as per the Global Industry Classification Standard (GICS®). The index also applies certain investment limits to help ensure diversification–limits that are imposed on regulated investment companies, or RICs, under the current US Internal Revenue Code.
Source: msci.com Index
The MSCI 25/50 Index has the following constraints:
• No group entity exceeds 25% of index weight.
• All group entities with weight above 5% cannot exceed 50% of the index weight.
They also provided how their Index rates on six important factors.
msci.com Index
Biggest overweights are the tilt toward Small-Cap REITs and higher yields, whereas the big underweight is in the Quality factor. For more on the index methodology, here is a link.
VNQ holdings review
Vanguard provides the following portfolio statistics.
investor.vanguard.com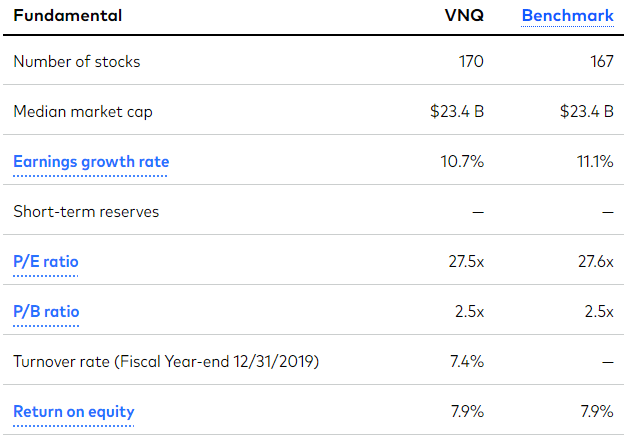
Not surprising iShares and Vanguard use different sector descriptions.
investor.vanguard.com; compiled by Author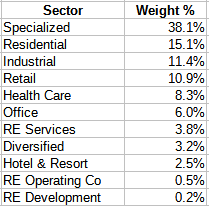
That said, the major sectors are named consistently and the weights for those show little differences between ICF and VNQ.
advisor.vanguard.com; compiled by Author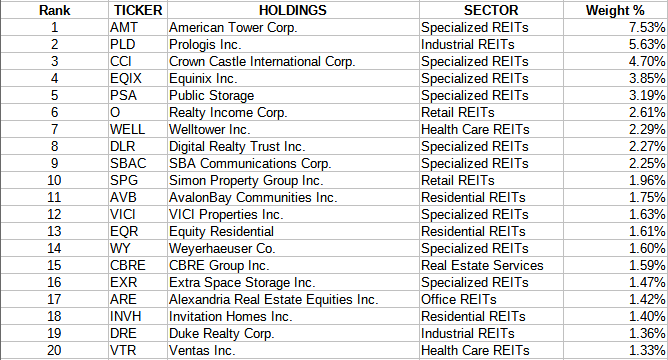
The actual largest holding is a Vanguard Real Estate Index fund at 12%. Ignoring that holding, the Top 10 is 36% of the portfolio, with the Top 20 representing 51%.
VNQ distribution review
seekingalpha.com VNQ DVDs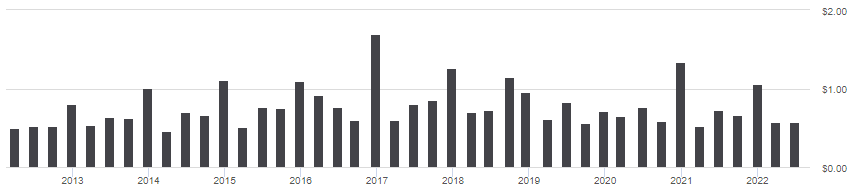
Dividends are also paid quarterly, and show the same downward trend as ICF but at a slower rate over the past five years. Seeking Alpha also gives VNQ’s payout history a “C+” rating.
seekigalpha.com VNQ scorecard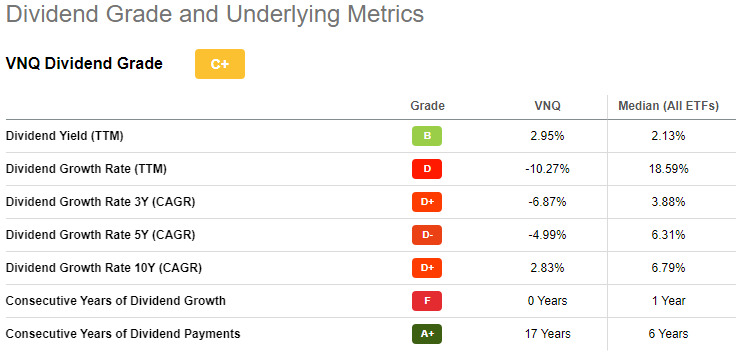
Comparing ETFs
So far, we have seen that the asset count varies by a factor over 5X, but the sector allocations not that wide apart. The Price ratios point to VNQ being a better value than ICF at this time. The growth percents, mostly, point to VNQ owning a better set of REITs for the future if the past continues. It is rare to see one ETF having better Value and Growth data over another ETF!
Fidelity.com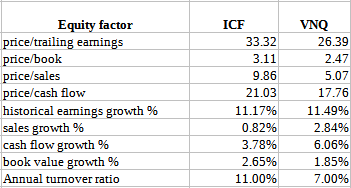
Every REIT held by ICF is also held by VNQ, only the weightings differ. Amongst the 5 largest holdings, these differences are:
ETFRC.com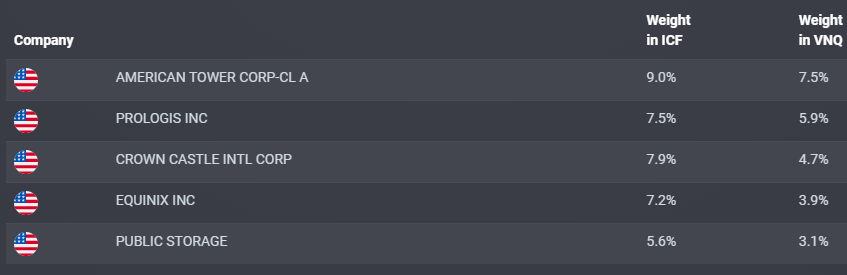
The next table shows the biggest weight differences that first favor ICF, then those that favor VNQ.
ETFRC.com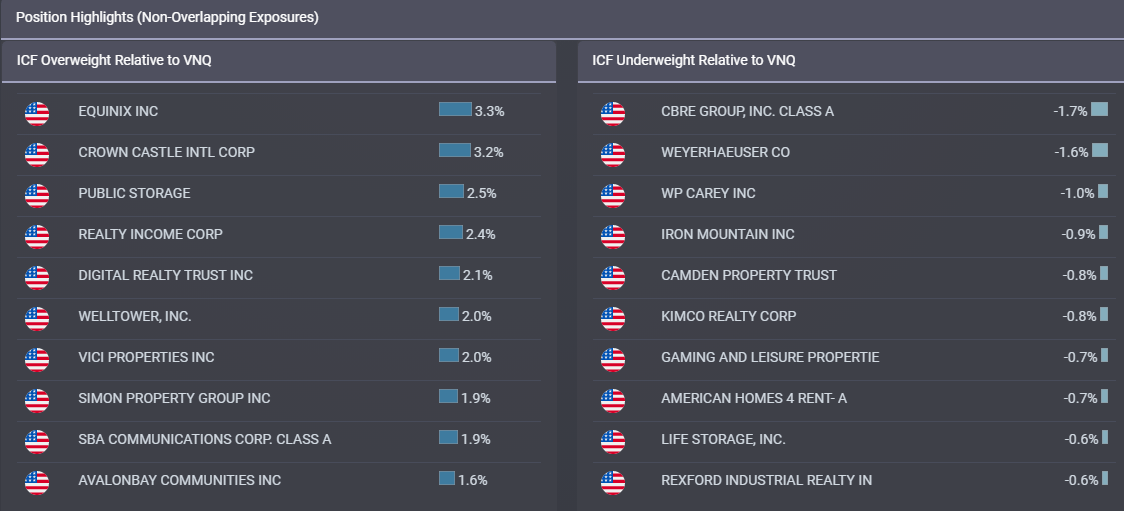
This comes into play if an investor likes certain REITs but is not ready to buy those REITs directly. Remember, like me, an investor can use REIT ETFs and add individual REITs to adjust their overall REITs exposure.
Another allocation difference is the market-size of the REITs held. VNQ holds a more diverse set of market-cap REITs than ICF, with the later almost exclusively in Large-Cap (>$13b) REITs.
| Large-Cap | Mid-Cap | Small-Cap | |
| ICF ETF | 96.6% | 3.4% | 0.0% |
| VNQ ETF | 71.6% | 22.8% | 5.7% |
Return and risk analysis
PortfolioVisualizer.com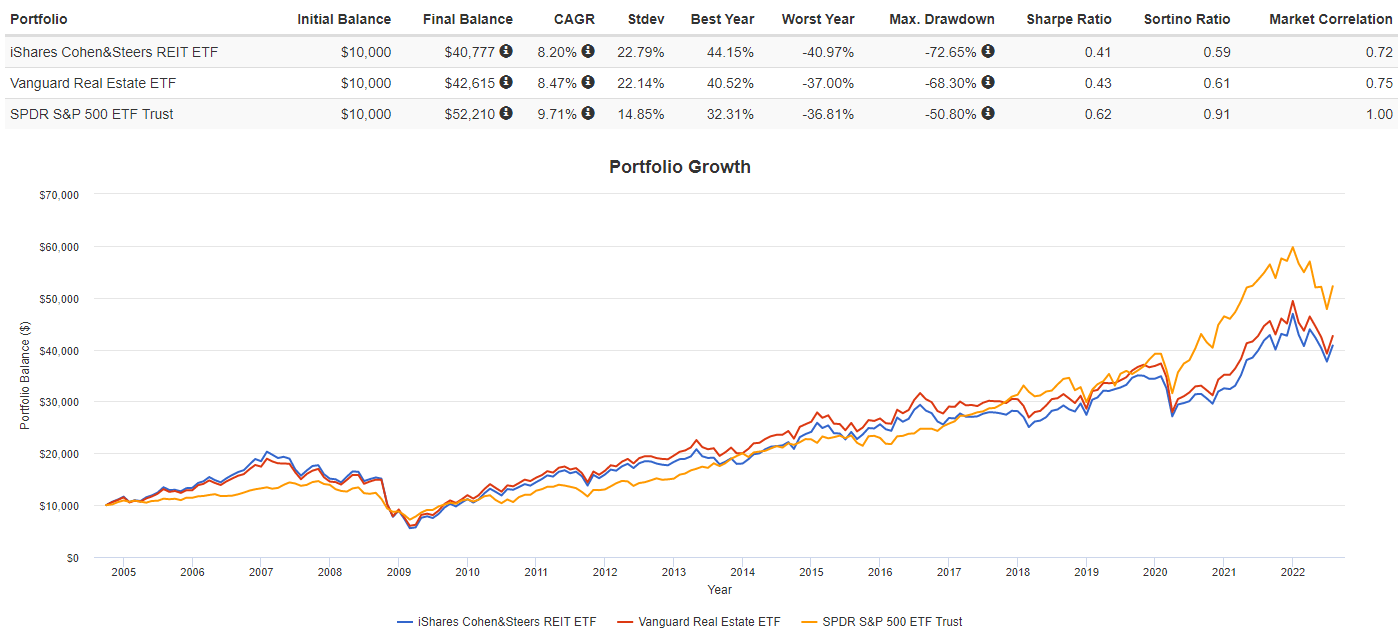
Both in terms of CAGR or StdDev, VNQ comes out slightly ahead of ICF; not enough for me to pick one over the other. I included the SPDR S&P 500 ETF (SPY) for comparison purposes. Investors might want to take a closer look at both Index rules as part of their due diligence between these REIT ETFs.
Portfolio strategy
As I mentioned earlier, there are other Contributors on Seeking Alpha I look to as REIT experts and highly recommend you check out their articles. These can be found by typing “REITs article” in the Seeking Alpha Search window. That said, data back to 1994 seems to indicate that when REITs outperformed, it lasts for 3-5 years.
PortfolioVisualizer.com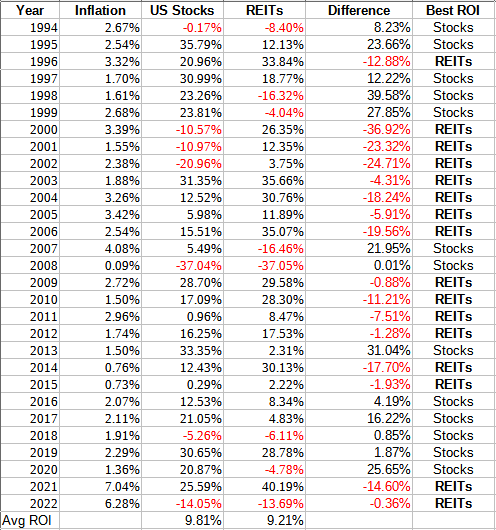
While there are short periods of outperformance by REITs over stocks, there are two that lasted much longer; both coming after a major financial crisis depressed REITs. Does COVID equate to the same scenario?
Final thoughts
Despite a strategy difference resulting in a large asset count disparity, both ETFs reviewed generated similar results and risk levels, one’s choice could come down to whether they prefer iShares or Vanguard ETFs. As is usually the case, the Vanguard ETF has lower fees and better execution statistics (volume, Bid/Ask spread). VNQ holders also own every REIT in ICF so they won’t miss out if any ICF held REIT has a major move.
Be the first to comment