

USD/MXN Price Outlook:
- Recent US Dollar strength has seen USD/MXN move off yearly lows near 19.50
- The reversal higher has propelled the pair toward formidable resistance around the 21.00 mark
- With resistance overhead and a modest uptick in risk aversion to start the week, USD/MXN could undergo consolidation
USD/MXN Price Forecast: US Dollar Takes Aim at Major Resistance
The US Dollar enjoyed a bout of strength to begin the year as a number of USD pairs reversed their trajectory from months prior. Unwilling to be left out, USD/MXN bounced off its yearly lows near 19.50 in mid-January and rebounded higher, taking aim at the 21.00 mark most recently. While the fundamental landscape continues to evolve, recent price action has seen the pair approach a key technical barrier that could give rise to consolidation in the shorter-term.
Top 8 Forex Trading Strategies and their Pros and Cons
To that end, USD/MXN trades narrowly beneath its 200-day moving average that stands around 21.00. Together with the round number the zone holds significant technical influence and could spark a period of consolidation or even a deeper reversal depending on broader USD behavior. Either way, 21.00 stands in the way of further gains and might present attractive risk-reward setups for traders possessing bearish biases.
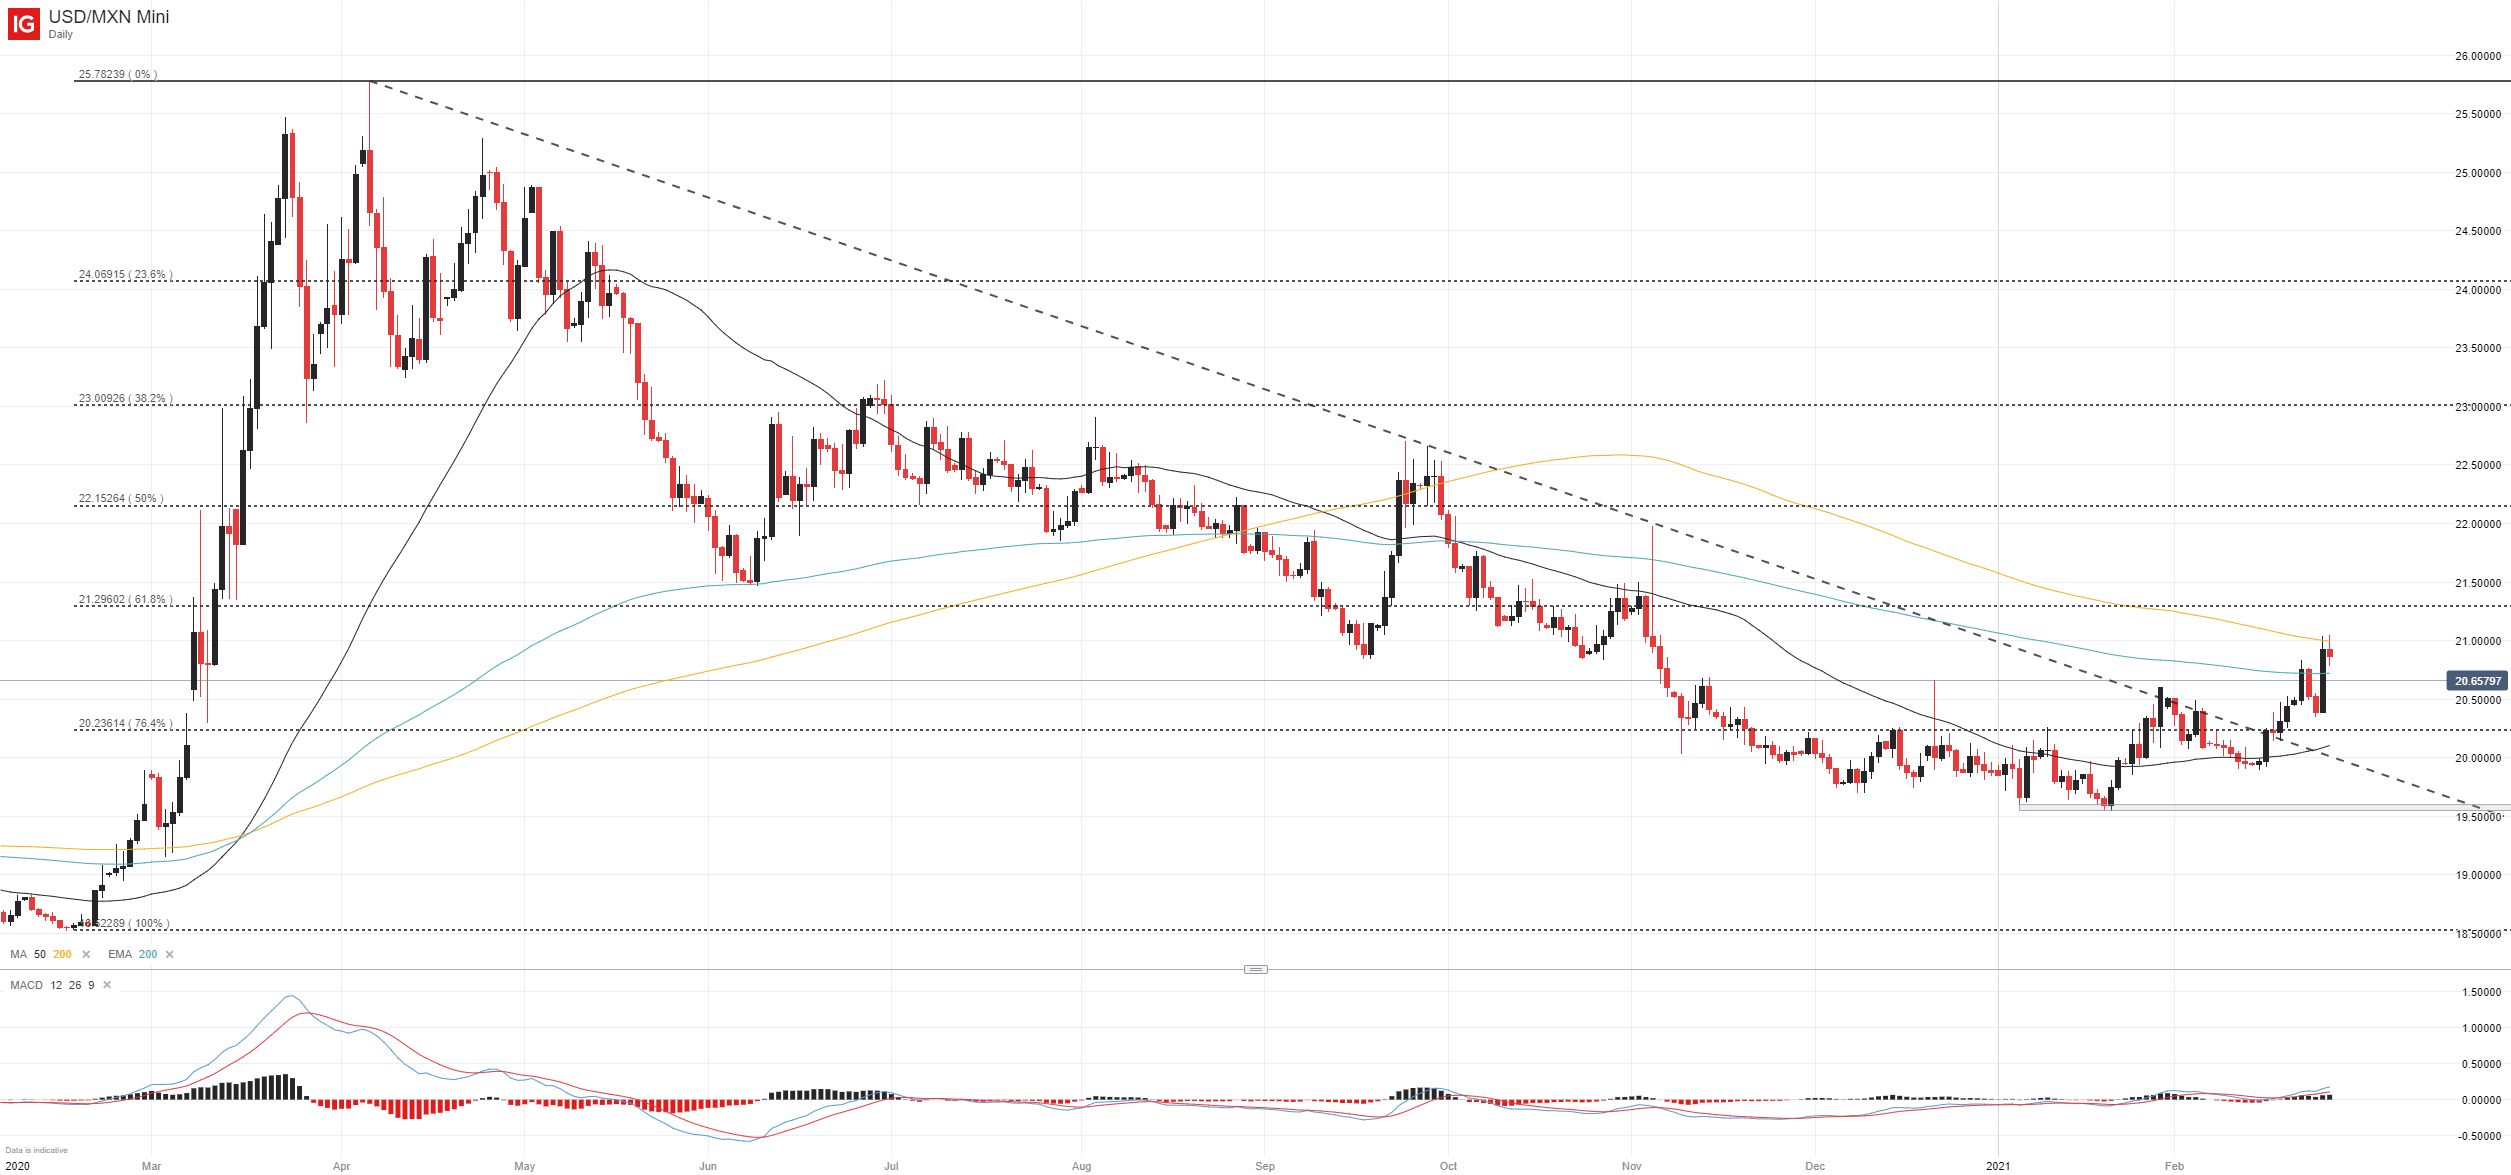
USD/MXN Price Chart: Daily Time Frame (February 2020 – March 2021)
With that in mind, shorter-term traders might look to employ the area slightly above the 200-day moving average as an invalidation zone while awaiting a potential retracement lower. Initial support in the event of bearishness likely stands around the 20.6046 to 20.6502 area marked by recent swing highs in November, December and January. Subsequent support might exist near the 50-day moving average, descending trendline from March and the Fibonacci level near 20.2361. Together, the barriers could offer considerable assistance.
USD/MXN Price Chart: 4 – Hour Time Frame (August 2020 – March 2021)

That said, the initial break above the descending trendline from March may have opened a longer-term trend in USD strength. Still, the break higher is directly opposite the EUR/USD bullish breakout posted in July – which could give way to broader USD weakness – so it is difficult to ascertain the wider strength of the Greenback.

Recommended by Peter Hanks
Get Your Free Top Trading Opportunities Forecast
Suffice it to say, the USD may be at a turning point and might require consolidation before continuing in either direction. Since the 200-day moving average is a substantial technical barrier, a brief pullback in USD/MXN might be likely at this time. Follow @PeterHanksFX on Twitter for updates on this pair.
–Written by Peter Hanks, Strategist for DailyFX.com
Contact and follow Peter on Twitter @PeterHanksFX
Be the first to comment