

US Dollar, S&P 500 Price Analysis:
- It’s been a brutal two week stretch for the risk trade.
- The G7 Group of Finance Ministers hosted a conference call this morning.
- Will recovery continue to show across global markets after a two-day bright spot?
S&P Holds on to Gains as US Dollar Stabilizes
It’s been a busy past two weeks in global markets and the potential for drama remains as the world wrestles with a potential pandemic that continues to spread. Information at this point still seems to be at a premium as coronavirus cases outside of China are still of a relatively small sample size; and for those in China, it may be difficult to project based on the veracity of that data. This provides considerable uncertainty across markets and that’s something that market participants generally abhor.
That uncertainty rang loudly last week as pretty much every stock market on Planet Earth fell, with varying stages of plummet seen depending on the bourse being looked at. The S&P 500 fell by 16% from the high on February 20th to the low seen on last Friday’s open. And it wasn’t just stocks that were on the move, as US Treasuries surged as yields plummeted deep into all-time-low territory, with the 10-year setting a low yield of 1.06%, with the previous low being 1.325%; and the 30-year falling to 1.61%.
These are gargantuan moves in a very short period of time; so alarming that the G7 Group of Finance Ministers have already started to attempt an address at coordinated action, taking place in a conference call this morning. Will this help to stave off further selling? Or will markets only continue to growl until a more cohesive strategy or approach is produced by the world’s largest economic entities?
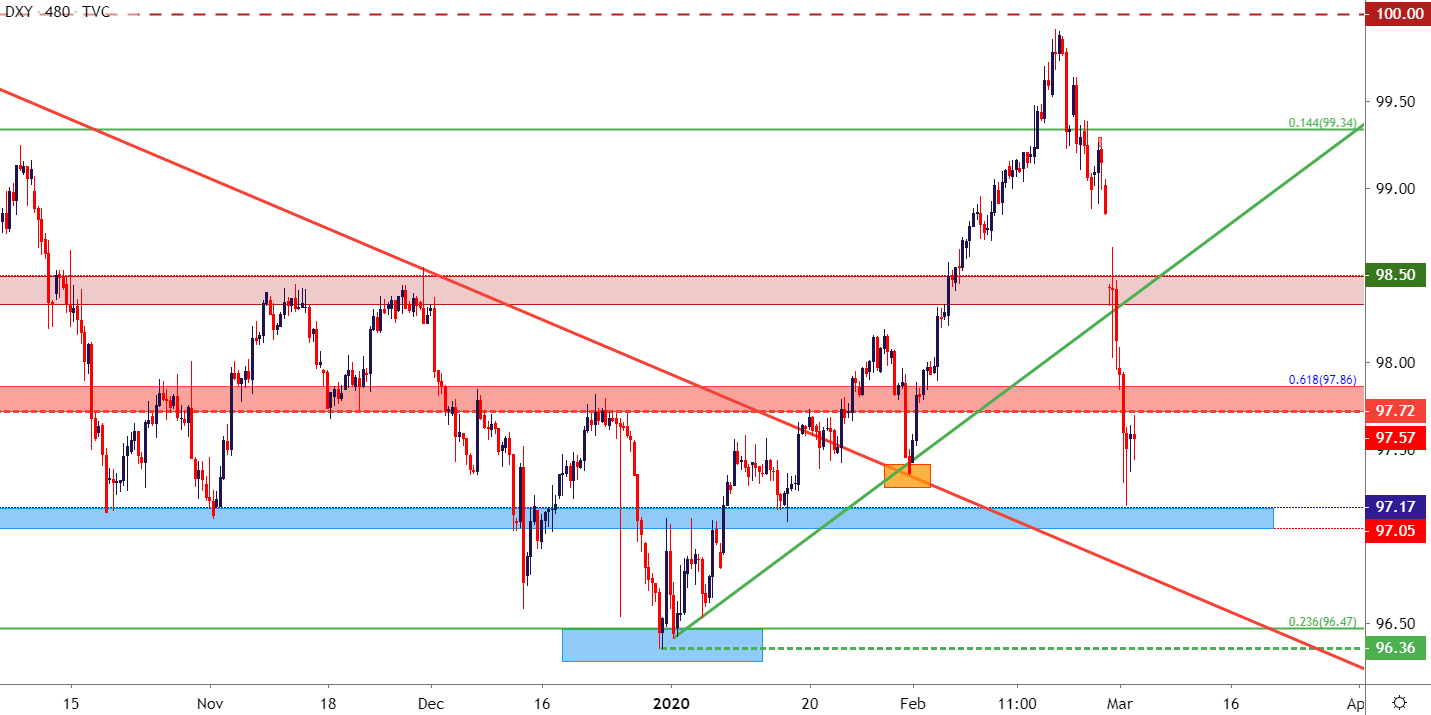
In the US Dollar, the currencies February rally has now been completely erased, with a bit of support coming in at a prior area of resistance spanning from 97.05-97.20 on DXY. This was the same resistance looked at a couple of months ago for bullish breakout scenarios; and after a brutal two-week-stretch, is now back in play as short-term support. On the resistance side of the coin, the same familiar 97.70 zone is back in-play, as this area helped to hold yearly highs in November and December of 2018; followed by another iteration in March of 2019.
Recommended by James Stanley
Download our Q1 USD Forecast
US Dollar Eight-hour Price Chart
US Stocks Cling to Gains; but is The Worst Over?
The primary focal point at the moment is on global equity after almost a fifth of value was erased from indices over the past few weeks. While the jump in US equities over the past two trading days is attractive, the fact that the brute portion of those moves came in during the final five minutes of Friday and then Monday trade is a bit disconcerting; perhaps pointing to the fact that there was some quick short-cover ahead of the close.
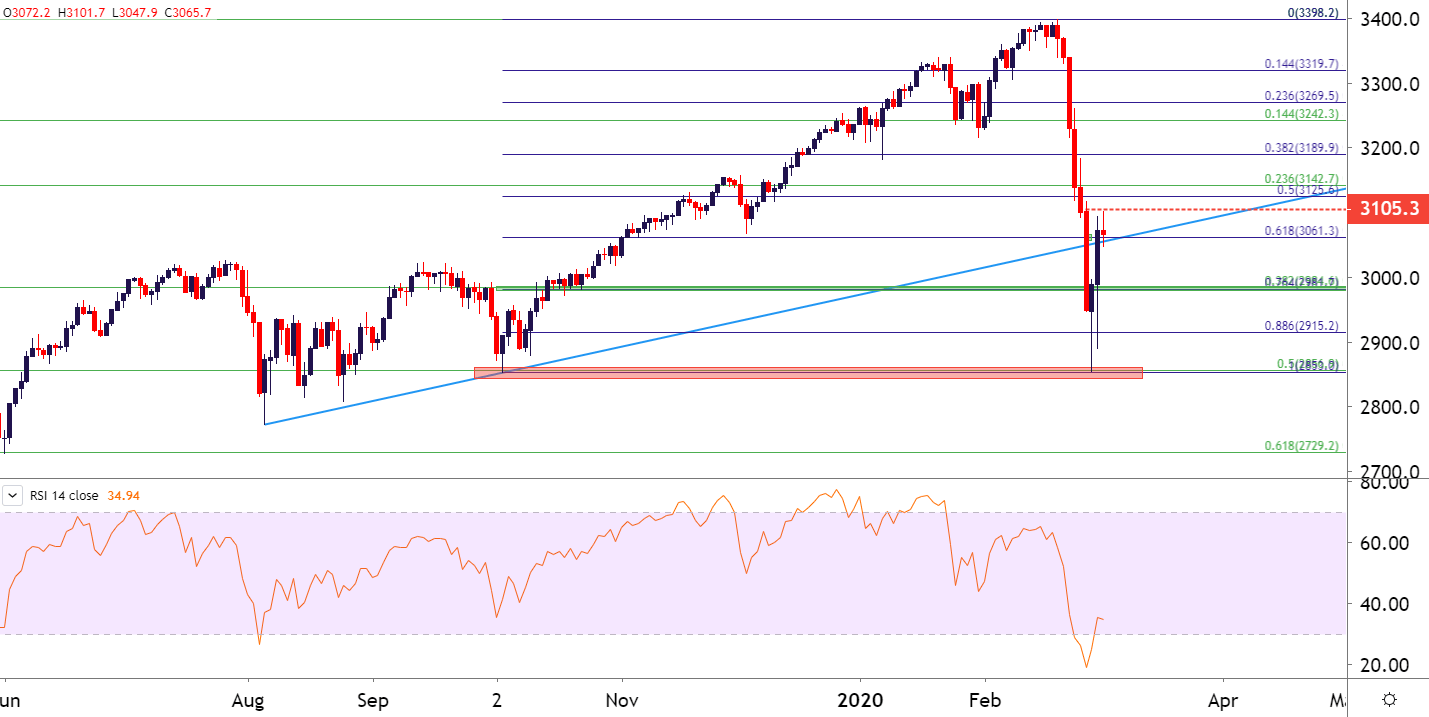
At this point, the S&P 500 has held the low from the Q4 open, showing around the 2850 area.
S&P 500 Daily Price Chart
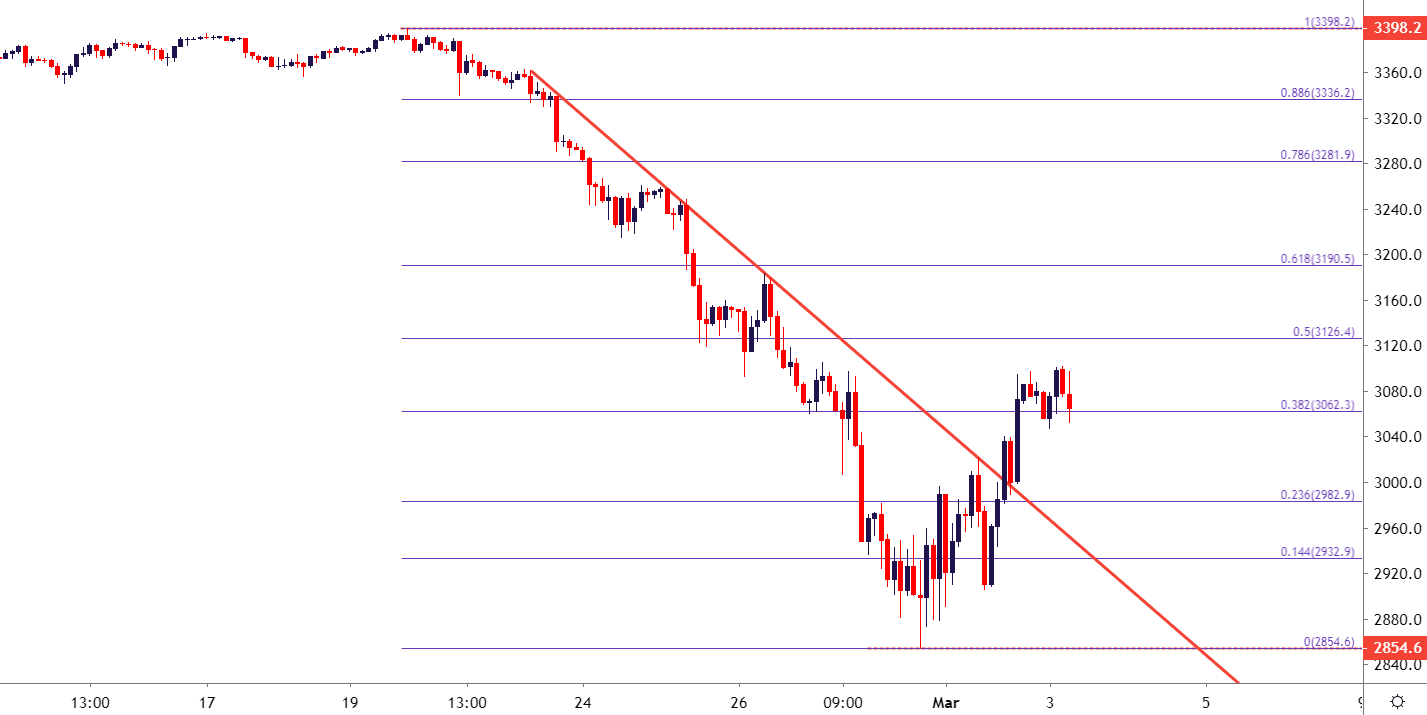
On a shorter-term basis, the potential for recovery remains as price action has started a build of higher-highs and higher-lows after last week’s vicious sell-off. Just a little over an hour ahead of the US equity open and the S&P 500 is holding on the 38.2% Fibonacci retracement of the recent sell-off, keeping the door open for further recovery towards the 50% marker at 3126 or, perhaps even the 61.8% marker just inside of the 3200 spot.
S&P 500 Two-Hour Price Chart
SPX500 on Tradingview
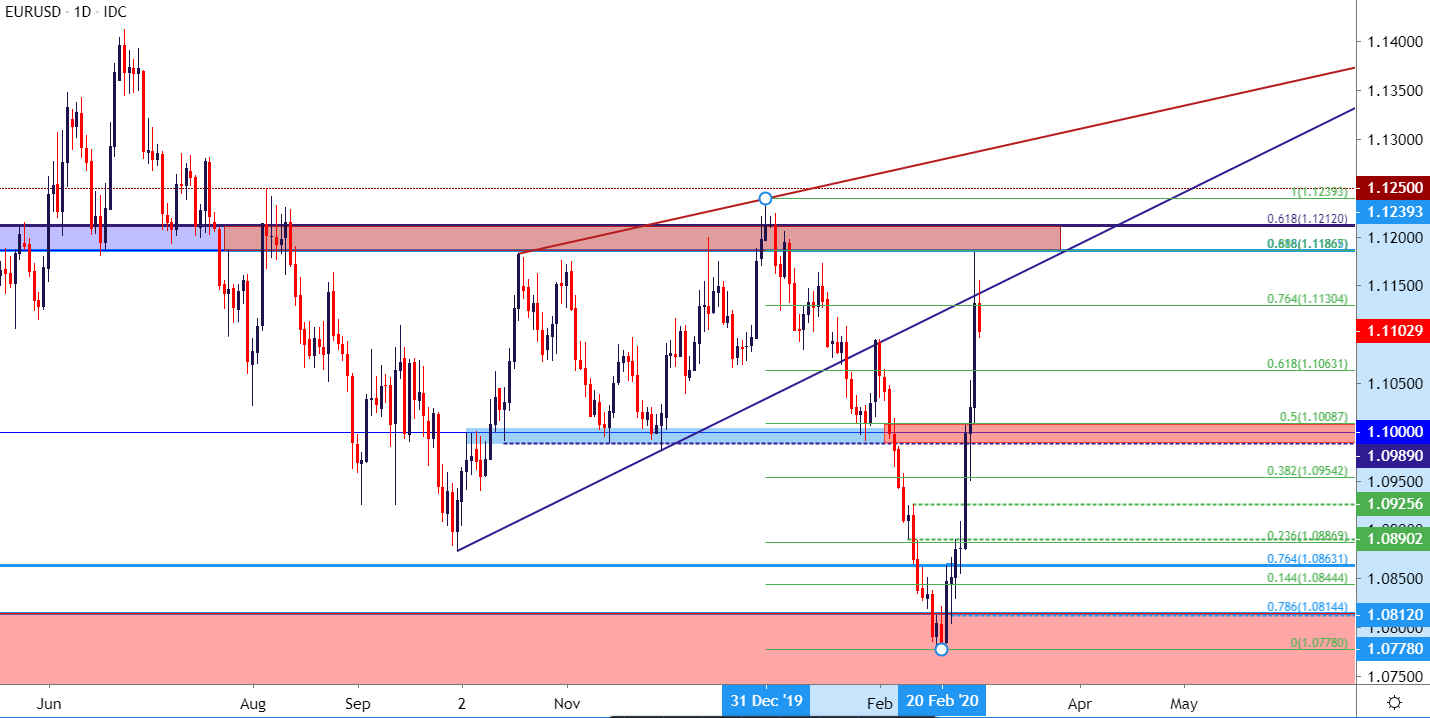
EUR/USD Spikes to Key Resistance Zone
It wasn’t even a month ago when EUR/USD re-testing the 1.1200 zone of resistance seemed almost unfathomable. But, that’s financial markets for you, where reversals come at you very fast.
I had looked into bullish breakout potential in EUR/USD a couple of weeks ago; and price action has continued to jump-higher, thrashing through the 1.1000 zone on the way to a big area of longer-term interest. Resistance has shown around the 1.1187 marker, and this can open the door for bearish swing strategies, particularly for those looking to buy the US Dollar at the moment.
| Change in | Longs | Shorts | OI |
| Daily | -6% | 16% | 7% |
| Weekly | -62% | 79% | -24% |
EUR/USD Daily Price Chart
— Written by James Stanley, Strategist for DailyFX.com
Contact and follow James on Twitter: @JStanleyFX
Be the first to comment