

US Dollar, EUR/USD, GBP/USD, USD/CAD, USD/JPY Price Analysis
- Noticeable reversals have developed in a number of markets.
- EUR/USD is pushing higher from a bullish short-term formation.
- GBP/USD, USD/CAD and USD/JPY may all have bullish USD-backdrops to work with for those looking to fade this recent Dollar-weakness.
Risk Aversion Continues to Rumble
US equities have continued their descent as a potent cocktail of risk has come into the equation. And while the Coronavirus fears seem an obvious driver, another scenario has popped up of recent that may be assisting with the sell-off, and that’s the prospect of a Bernie Sanders nomination ahead of this year’s US Presidential election. From a deductive perspective, it would be difficult to rule it out given the performance at last week’s debates; and tonight brings another debate which will provide ample opportunity to test that theory.
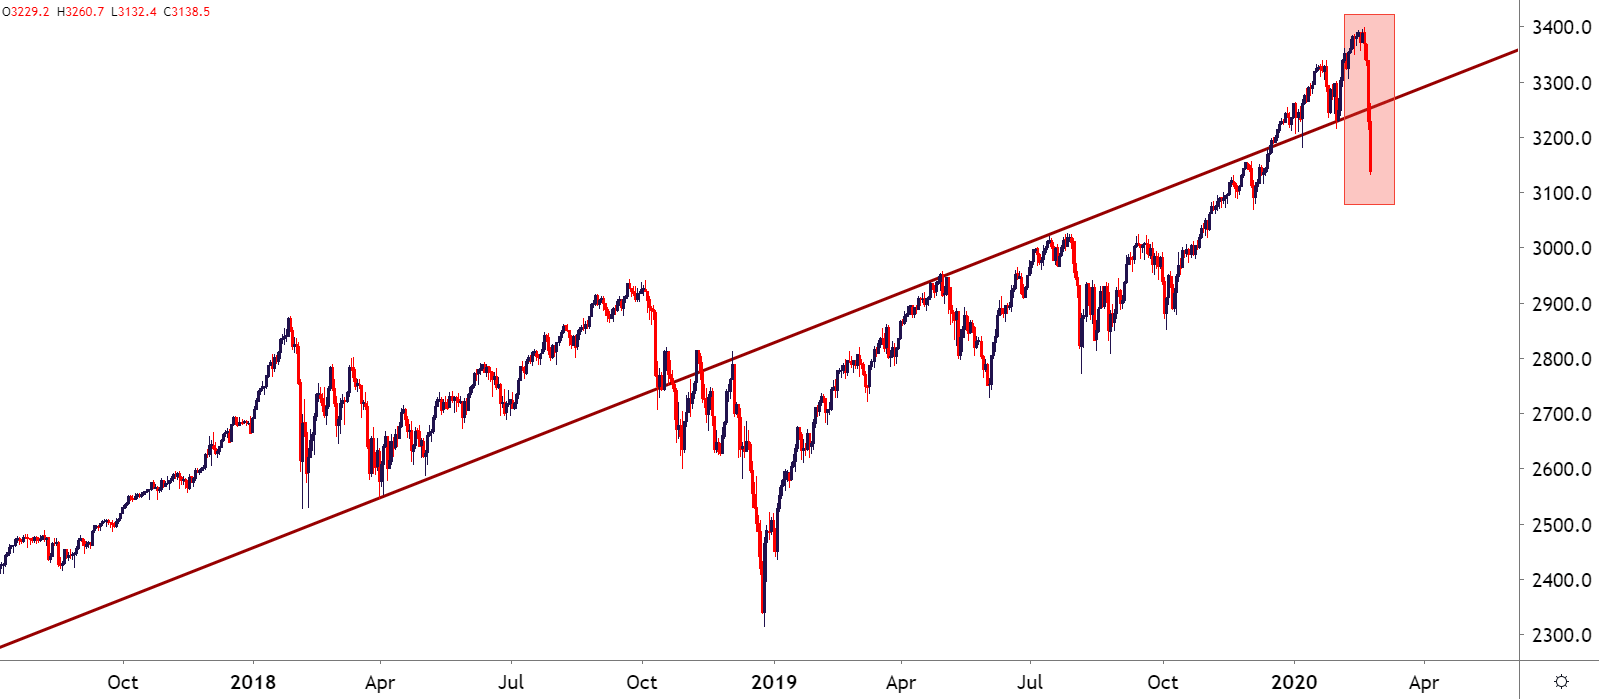
Prices in the S&P 500 have pushed down to a fresh 2020 low and sellers remain in-control of short-term price action.
SPX500 Daily Price Chart
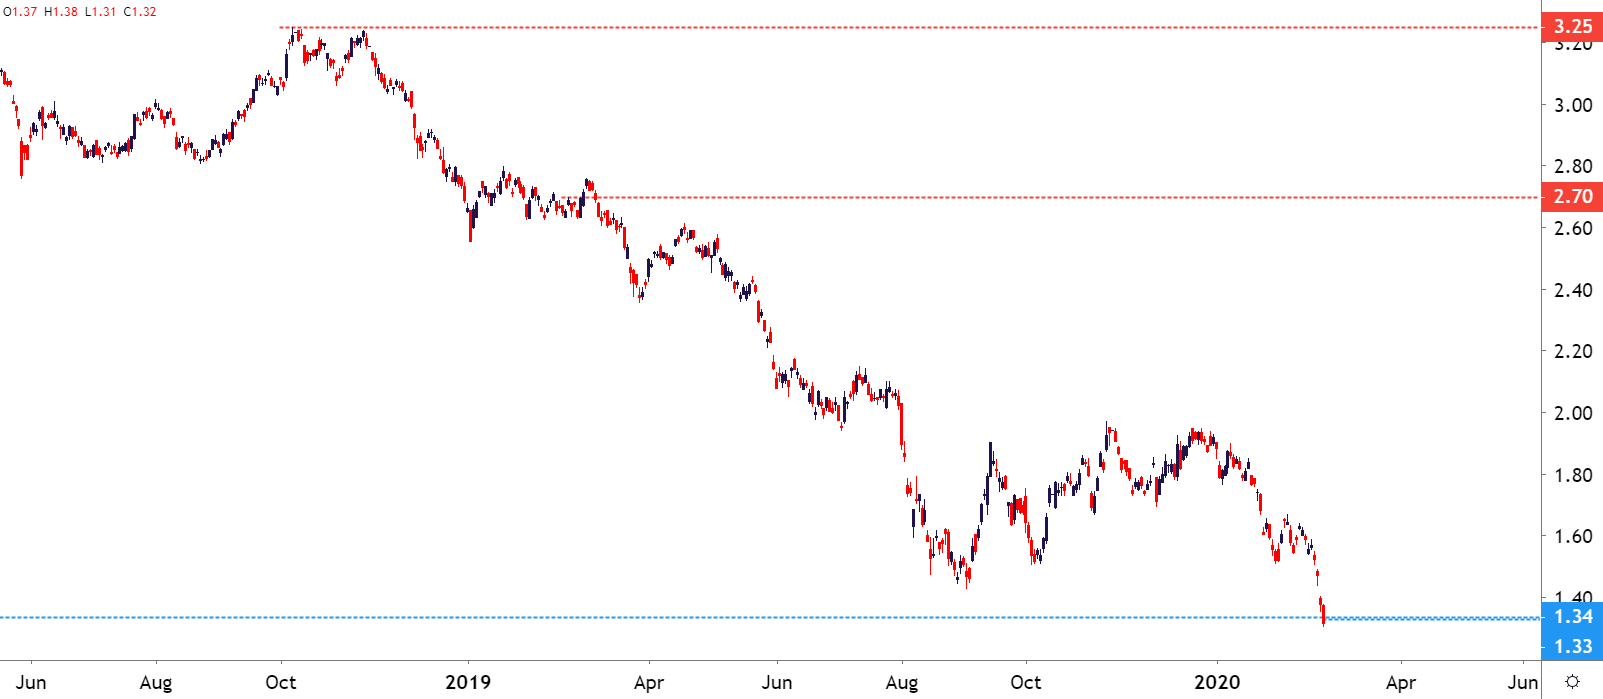
One of the big items from today is a fresh all-time-low in the US Treasury 10-year-note; falling below any crisis levels from the Financial Collapse. A far cry from the 3.25% in October of 2018 or the 2.7% from just a year ago in February of 2019.
US Ten Year Note Yield: Fresh All-Time-Lows
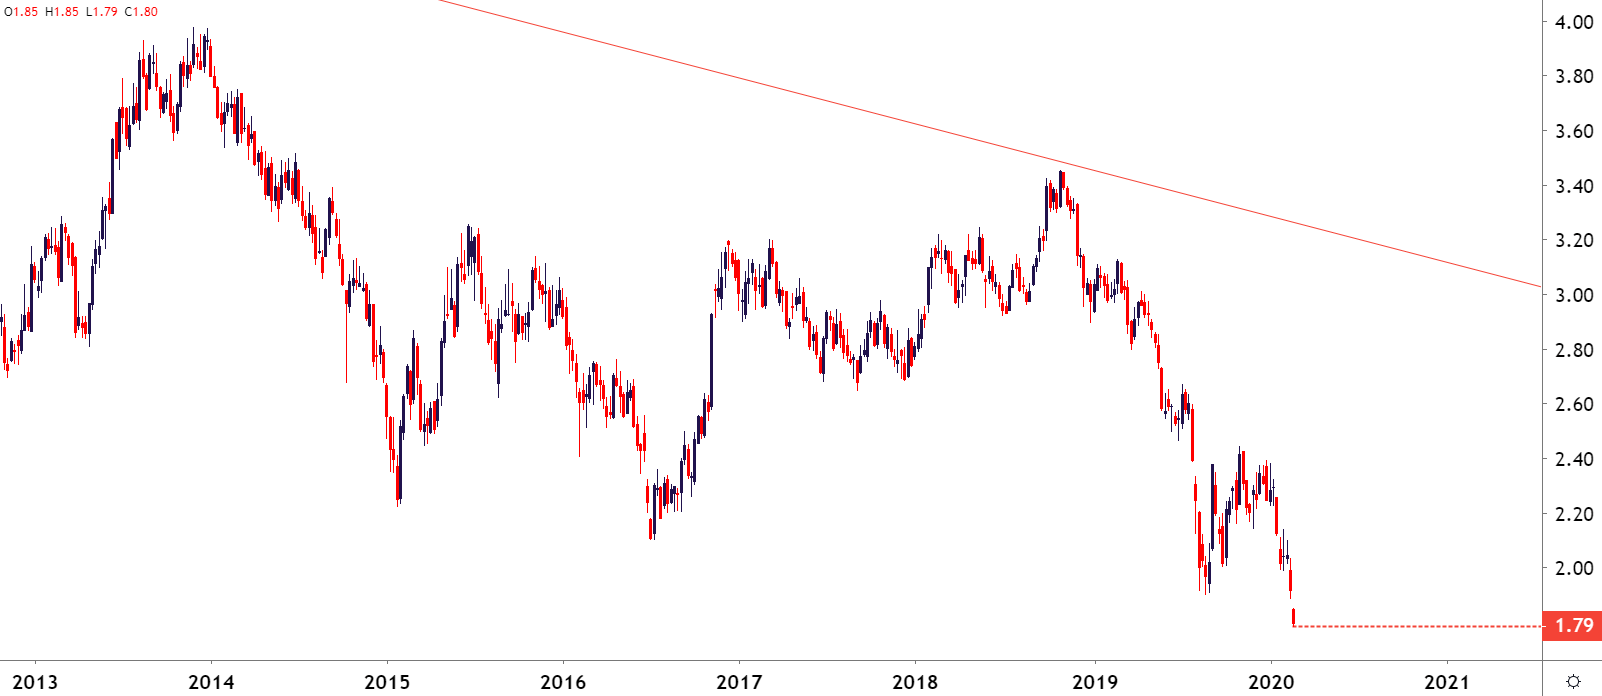
This follows yesterday’s observation of the same thing taking place in the 30-year Treasury bond, pushing down to a fresh all-time-low, ticking inside of 1.8%.
30-Year Treasury Bond Yield: Fresh All-Time-Lows
US Dollar Snaps Back
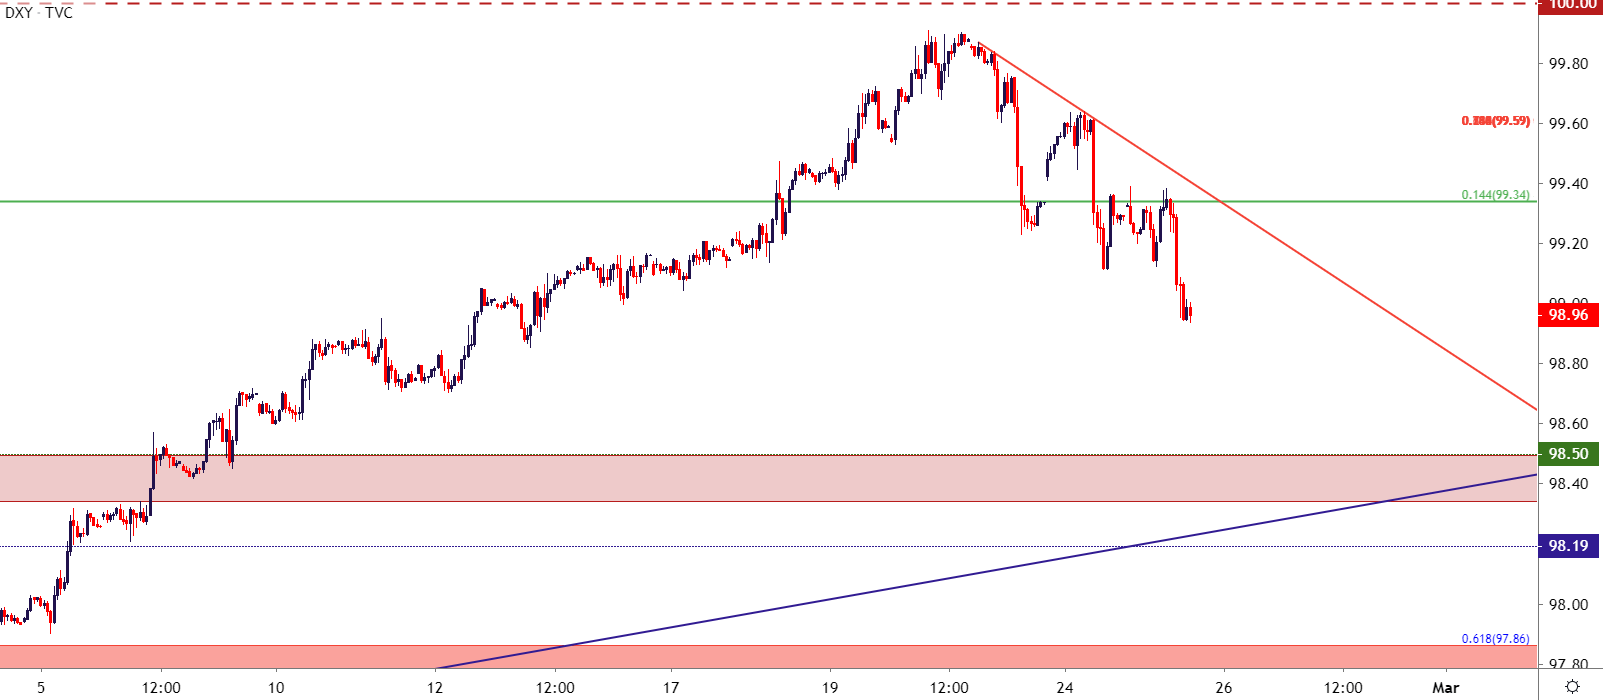
Going along with that risk aversion theme over the past few trading days has been a reversal in USD. It was just a week ago that the Greenback made a strong topside run towards the 100.00 figure in DXY. But that faltered and since then bears have come back into the picture.
US Dollar Hourly Price Chart
EUR/USD Breaks Out to Fresh High
I had written about this one earlier this morning as EUR/USD was beginning to show tendencies of reversal. The pair had put in an ascending triangle formation on a short-term basis, very similar to what had shown in the USD in early-January. EUR/USD has since broken out, and forward resistance exists at 1.0890 and 1.0925; after which the big zone of prior support comes into play around the 1.1000 psychological level.
| Change in | Longs | Shorts | OI |
| Daily | -6% | 12% | -2% |
| Weekly | -7% | 10% | -2% |
EUR/USD Hourly Price Chart

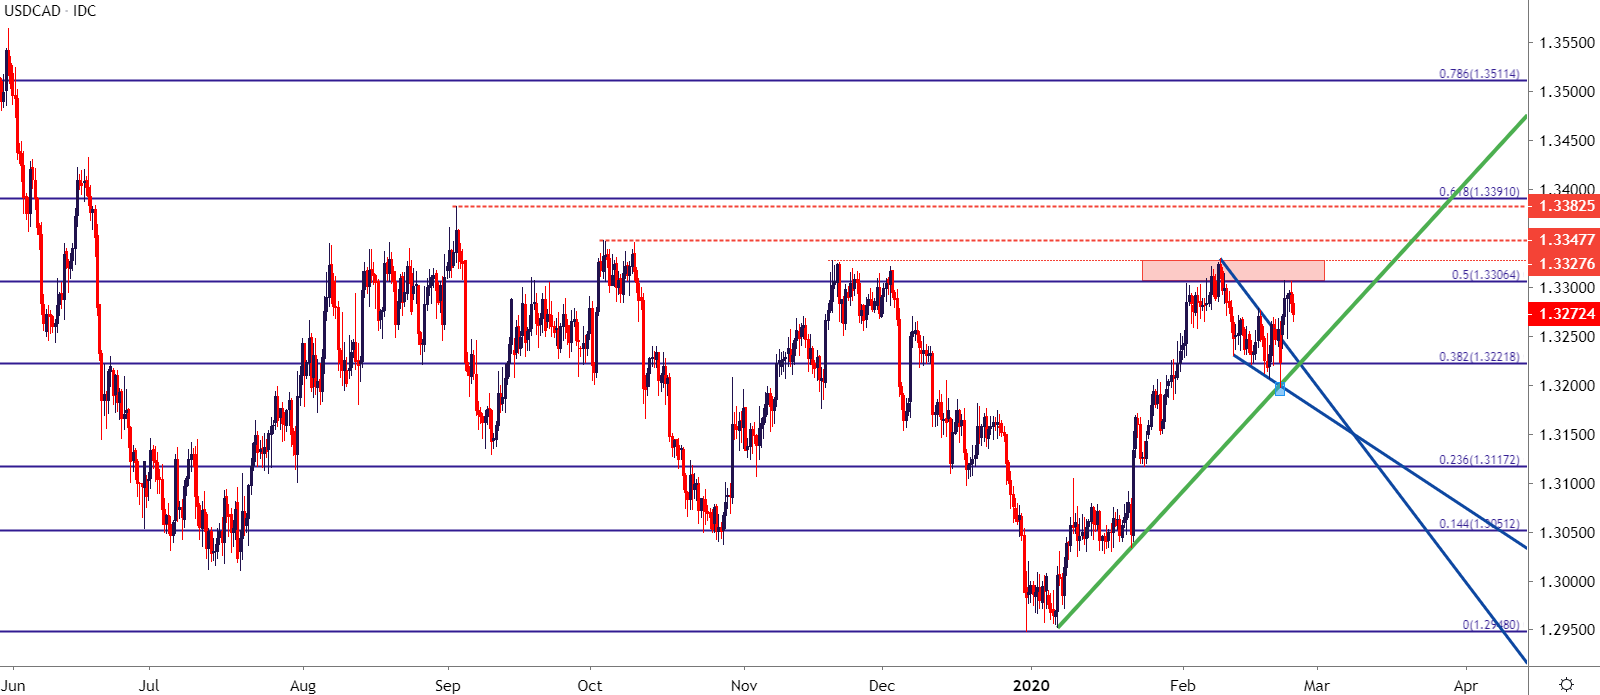
USD/CAD Potential for USD-Strength Scenarios
On the long side of the US Dollar, USD/CAD remains of interest. I had looked into this setup last week and again this morning; as the January-February bullish run ran into a key level of resistance. After that, an orderly pullback showed in the form of a falling wedge, which takes on the tone or temper of a bull flag formation.
| Change in | Longs | Shorts | OI |
| Daily | 14% | 9% | 11% |
| Weekly | 3% | -23% | -17% |
This, especially given the recent rash of USD-weakness, highlights just how weak the Canadian Dollar has been. This also keeps the door open for bullish potential in the pair should USD-strength return.
USD/CAD Eight-Hour Price Chart
GBP/USD Resistance Test
GBP/USD is testing potential resistance at a key area on the chart, running from 1.3000-1.3013.
| Change in | Longs | Shorts | OI |
| Daily | -11% | 9% | -4% |
| Weekly | -8% | -14% | -10% |
GBP/USD Four-Hour Price Chart

USD/JPY Support Test
Last week’s massive breakout in USD/JPY has been mostly unwound at this point. Price action is now testing a key area of potential support, taken from a prior resistance zone that’s confluent with the 110.00 psychological level.
| Change in | Longs | Shorts | OI |
| Daily | 22% | -14% | 1% |
| Weekly | 7% | -27% | -14% |
USD/JPY Daily Price Chart

— Written by James Stanley, Strategist for DailyFX.com
Contact and follow James on Twitter: @JStanleyFX
Be the first to comment