

The prices of most of the agricultural commodities were not immune to the risk-off action in markets across all asset classes over the past weeks. Meanwhile, it is the wrong time of the world for market participants to become overly bearish when it comes to the products that feed and clothe the world. Each year is a new adventure in agricultural markets as the weather conditions in the United States, and other producing nations of the world are the chief determinate of the direction of prices. A drought or weather event that wreaks havoc with supplies can cause extreme upside volatility in agricultural markets, as we witnessed in 2012 when drought conditions took corn and soybeans to all-time highs and wheat to a lofty level. Uncertainty over the annual crop tends to peak during the spring and early summer months.
On Tuesday, March 10, at noon EST, the US Department of Agriculture will release its March World Agricultural Supply and Demand Estimates report. The WASDE is the gold-standard when it comes to market fundamentals. Farmers often use the monthly report as a guide that drives their choices at the beginning of the crop year.
The Invesco DB Agriculture Fund (DBA) holds futures contracts in many of the products covered by the USDA’s WASDE report.
Risk-off pushes prices lower
The final week of February was the most significant risk-off period since the 2008 global financial crisis. One thousand point moves in the Dow Jones Industrial Average have become the norm rather than the exception. The spread of Coronavirus around the world has caused fear and uncertainty to grip markets across all asset classes. At a time of the year when uncertainty over the 2020 crop year should be rising, agricultural futures markets have been sensitive to the increased price variance.
On March 3, the US central bank slashed the Fed Funds rate by fifty basis points, the first emergency cut in interest rates in over a decade. While the short-term rate sits at 1.00%-1.25%, the ten-year Treasury declined to below 1% for the first time in history. Many market participants expect short rates to head back to zero percent in the US. The potential of significant disruptions in the global supply chain has been weighing on markets. When it comes to the agricultural products that meet nutritional requirements around the world, people will still need to eat even if fatalities and cases of Coronavirus continue to rise and spread across the globe. The US Department of Agriculture is not likely to account for the impact of the virus in the March WASDE report. During the height of the trade war between the US and China, the USDA did not address the impact of trade in the monthly report, which is likely a precedent for how they will handle the effect of Coronavirus on agricultural commodity prices in the March 10 report.
Soybeans and corn under pressure into the WASDE report
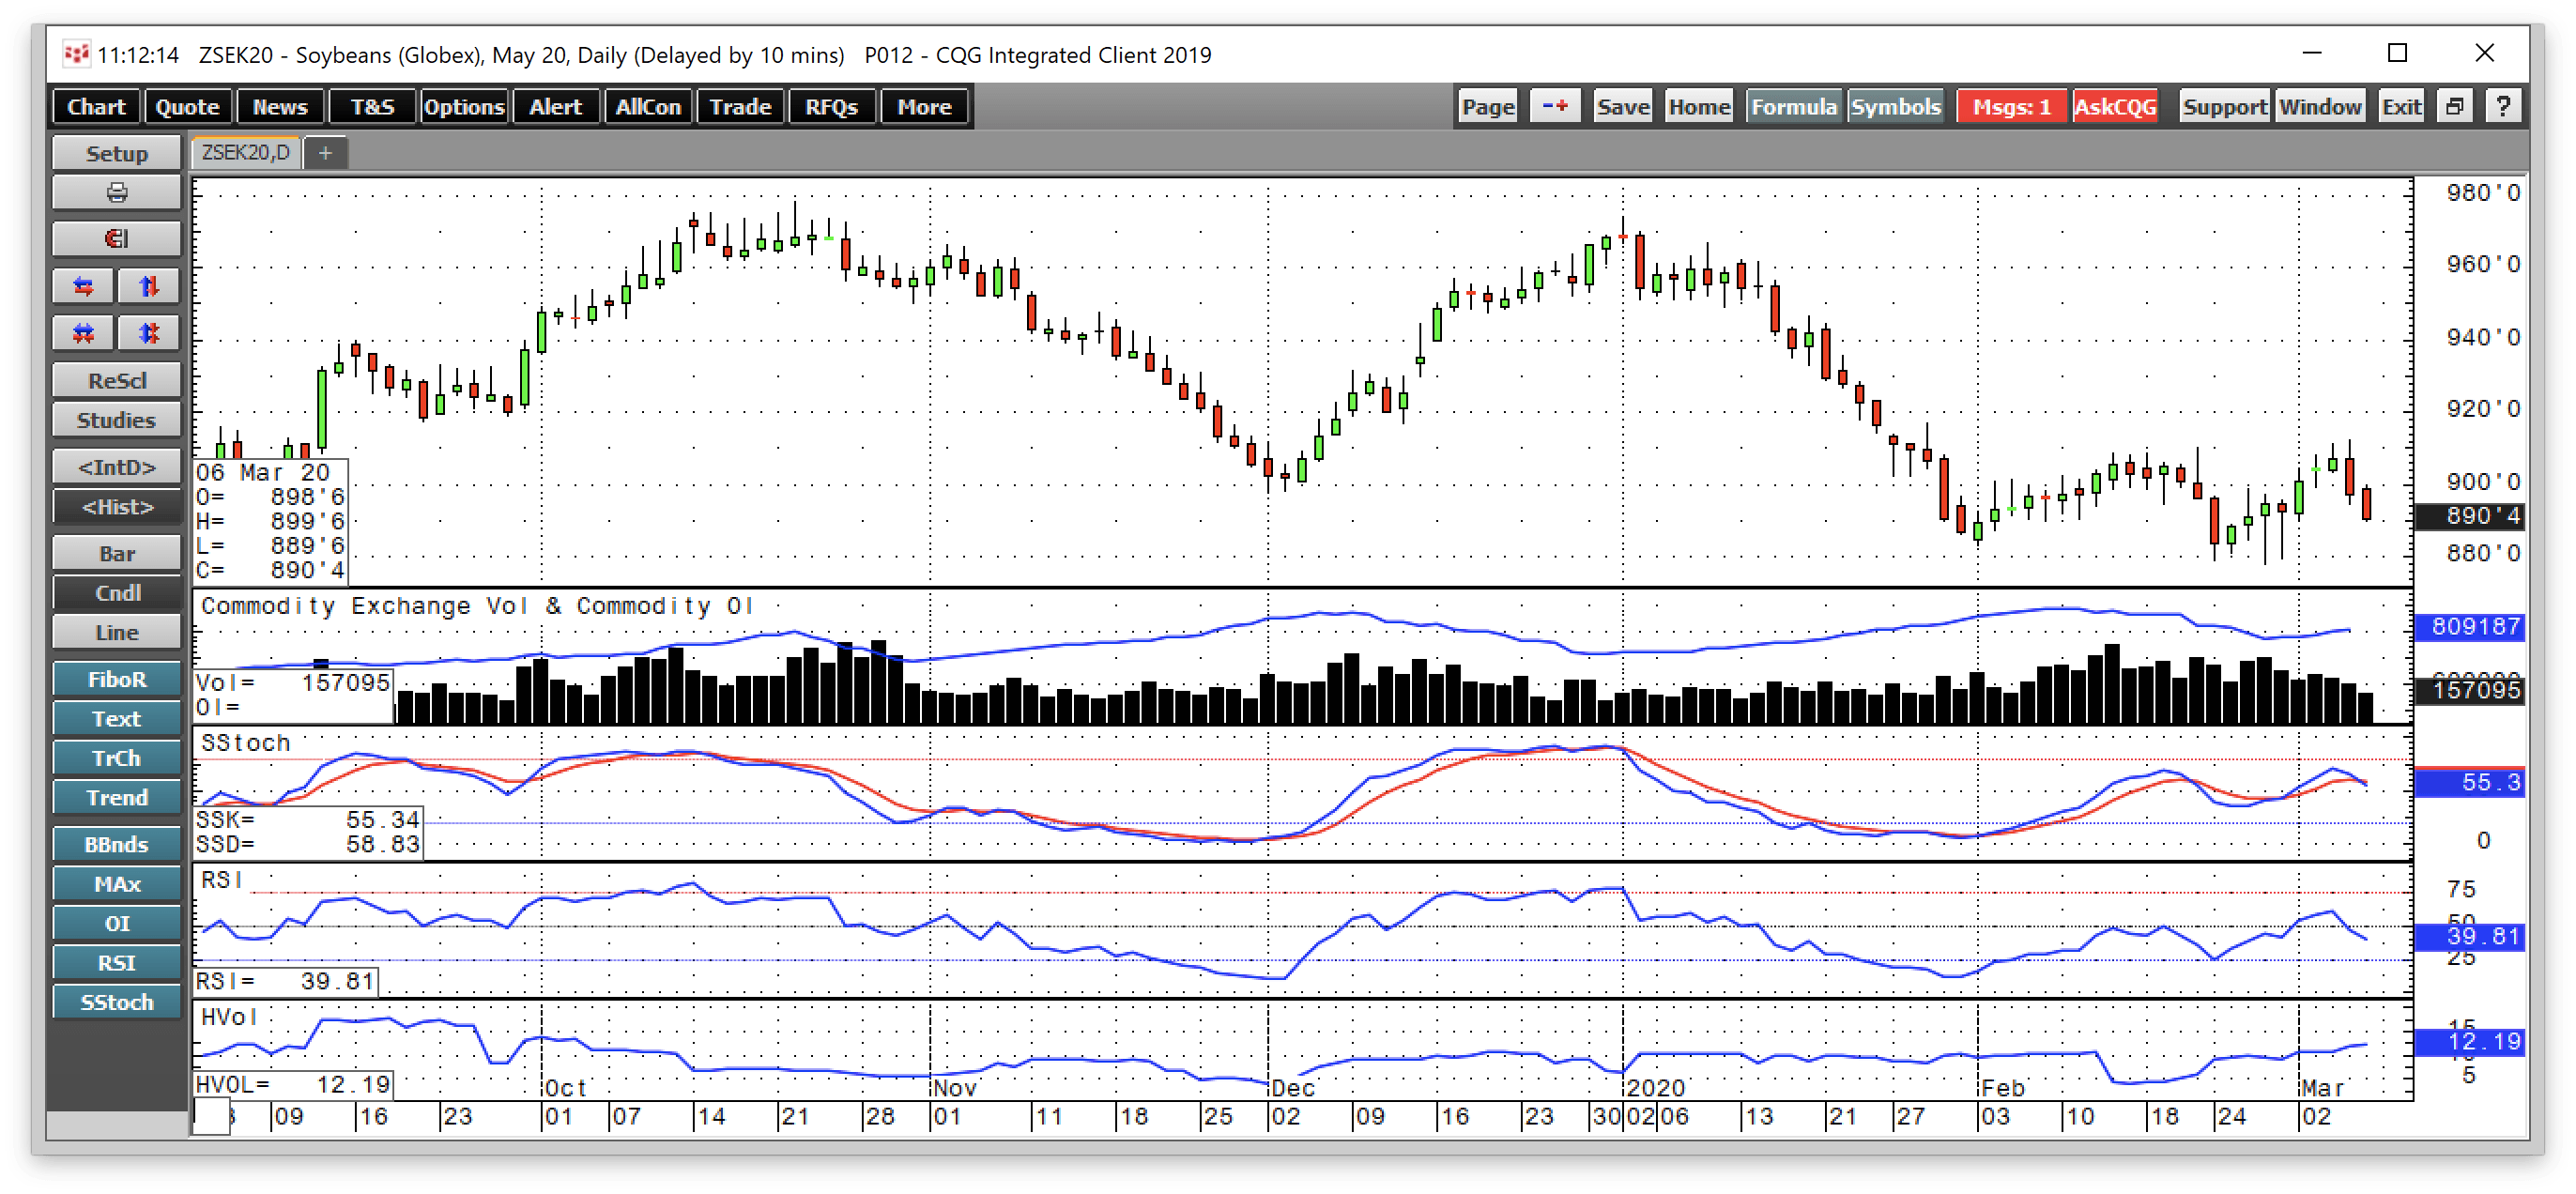
After reaching a low of $8.7825 per bushel on February 27 as risk-off conditions gripped markets, May soybean futures on the CBOT division of the CME recovered, a bit.
Source: CQG
As the daily chart of May soybean futures shows, the price recovered and was just above the $8.90 per bushel level at the end of last week. Price momentum and relative strength indicators were on either side of neutral readings going into the monthly report. Daily historical volatility in the soybean market rose from just over 4% in mid-February to over 12% as of March 6. Open interest, the total number of open long and short positions in the soybean futures market, fell from 883,324 contracts on February 10 to 809,187 contracts as of March 5. The decline came as March futures rolled to May, but at this time of the year, an increase in hedging should be pushing the metric higher. The soybean futures arena is not seeing the same level of speculative interest because of risk-off conditions.
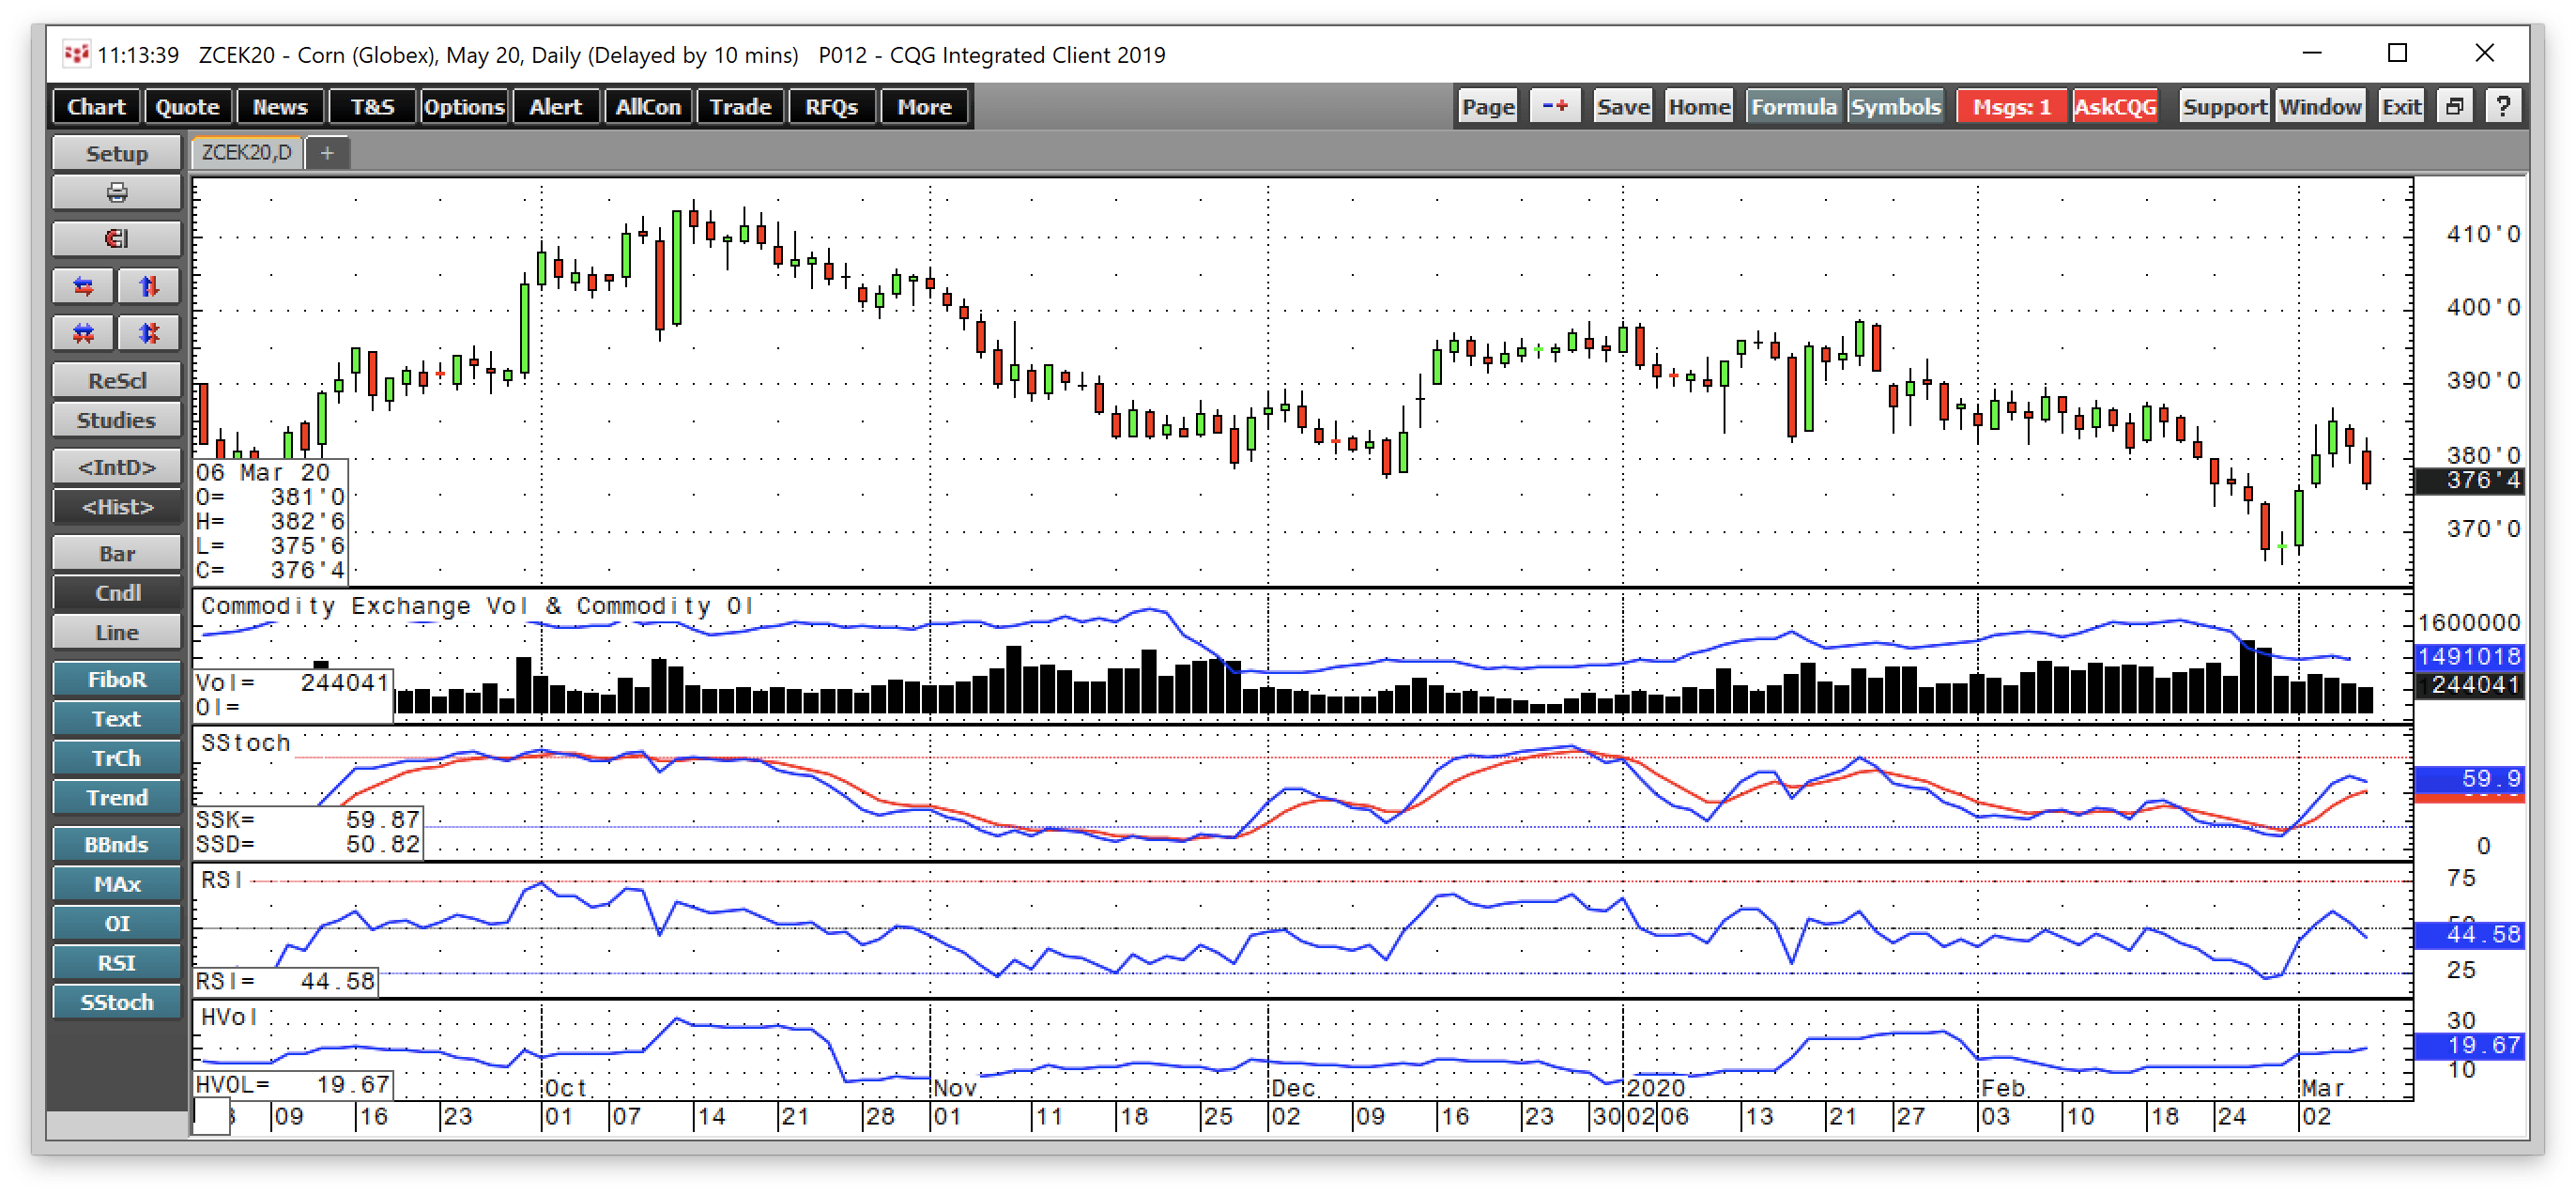
Source: CQG
The daily chart of May corn futures highlights the decline to a low of $3.6575 per bushel on Friday, February 28, the day when panic descended on many markets. Corn recovered to a high of $3.8675 on March 4 and was trading at around the $3.7625 per bushel level at the end of last week. Price momentum and relative strength metrics were also on either side of neutral territory on March 6, with daily historical volatility moving from just over 10% in mid-February to almost 19.7% last Friday. Open interest declined from 1.62 million contracts on February 20 to 1.491 million on March 5. Like in soybeans, the metric fell as March futures rolled to May, but the lack of speculative interest in the corn market in a risk-off landscape likely reduced participation in the market.
The prices of soybeans and corn are likely to be more sensitive to events surrounding the impact of Coronavirus on the market’s psyche than the March WASDE report, which is likely to ignore the ramifications on the global supply chain for agricultural products.
When it comes to the corn-bean ratio, which is a barometer for farmer’s behavior during the planting season, corn remains marginally expensive compared to soybeans on a historical basis going into the WASDE report.
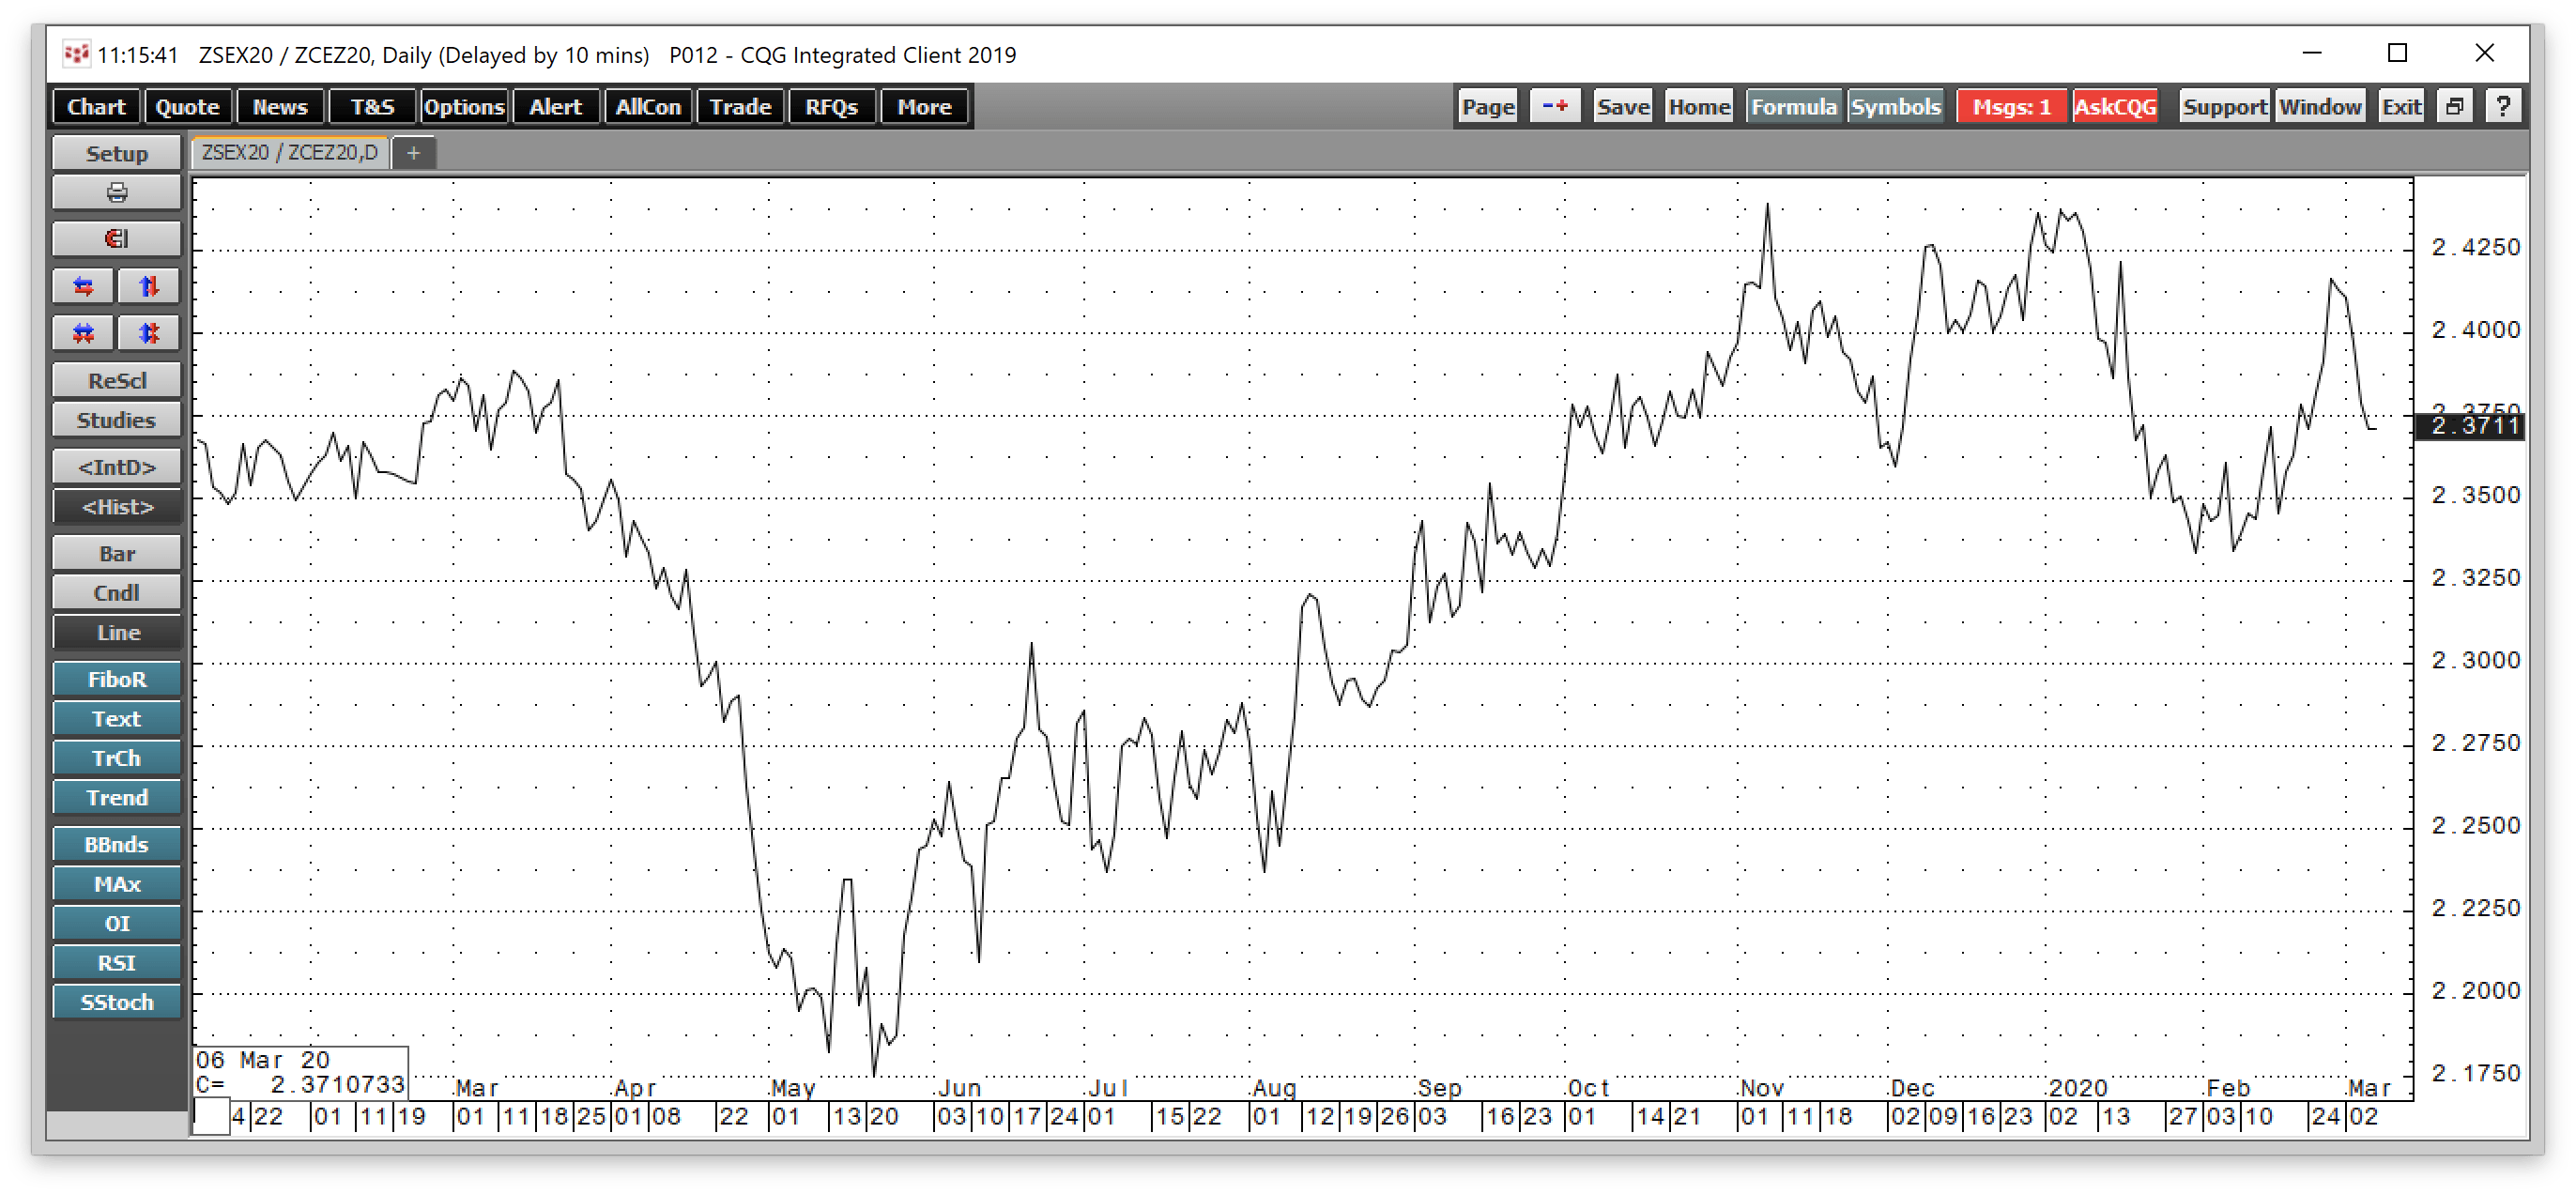
Source: CQG
The chart of new-crop November soybean futures divided by new-crop December corn futures illustrates at below the long-term average of 2.4:1, farmers are likely to plant more corn than beans on their land over the coming weeks.
Wheat moves lower from the recent high
On January 22, the price of wheat rose to a high of $5.9250, which was only one-half cent below the 2018 peak of $5.93 per bushel. The high on the May contract was $5.9075 per bushel.

Source: CQG
The chart shows that the price of CBOT soft red winter wheat futures fell to a low of $5.1000 on March 6, at the end of last week. Price momentum and relative strength were in oversold territory. While volatility increased in the corn and bean futures markets, it went the other way in wheat as it declined from over 29% when the price was higher to just above 17.10% as of March 6. Open interest followed the same pattern as in the corn and oilseed futures arenas. In wheat, the metric dropped from 526,921 contracts on February 5 to 431,367 contracts at the end of last week. The decline in open interest is a sign that speculators have limited their risk exposures.
As of March 6, the KCBT hard red winter wheat versus CBOT soft red winter wheat spread in May was trading at around a 73 cents discount for the KCBT wheat futures. The long-term norm for the spread is a 20-30 cents per bushel premium for the KCBT wheat. However, the KCBT wheat has not been at a premium for an extended period, which tends to be a bearish sign for the wheat market. Since many bread manufacturers in the US price requirements using the KCBT price, the weakness in the hard red winter wheat is a sign that consumers continue to purchase requirements on a hand-to-mouth basis rather than hedging price risk. Wheat goes into the WASDE report suffering from the risk-off environment facing most other markets.
Cotton remains weak from Coronavirus-related selling
Cotton is a soft commodity that tends to reach seasonal peaks during the spring and early summer months. In 2011, cotton futures rose to an all-time high of $2.27 per pound in March. In 2013, the high for the year was 93.93 cents was in March, and in 2017 and 2018, the peak came in May and June.
The trade war between the US and China weighed on the price of cotton futures. Optimism over the “phase one” trade deal lifted the price of the continuous contract to a high of 71.96 cents in mid-January 2020, but Coronavirus has been a bearish factor as China, one of the world’s leading cotton consumers and producers, is ground zero for the fiber.
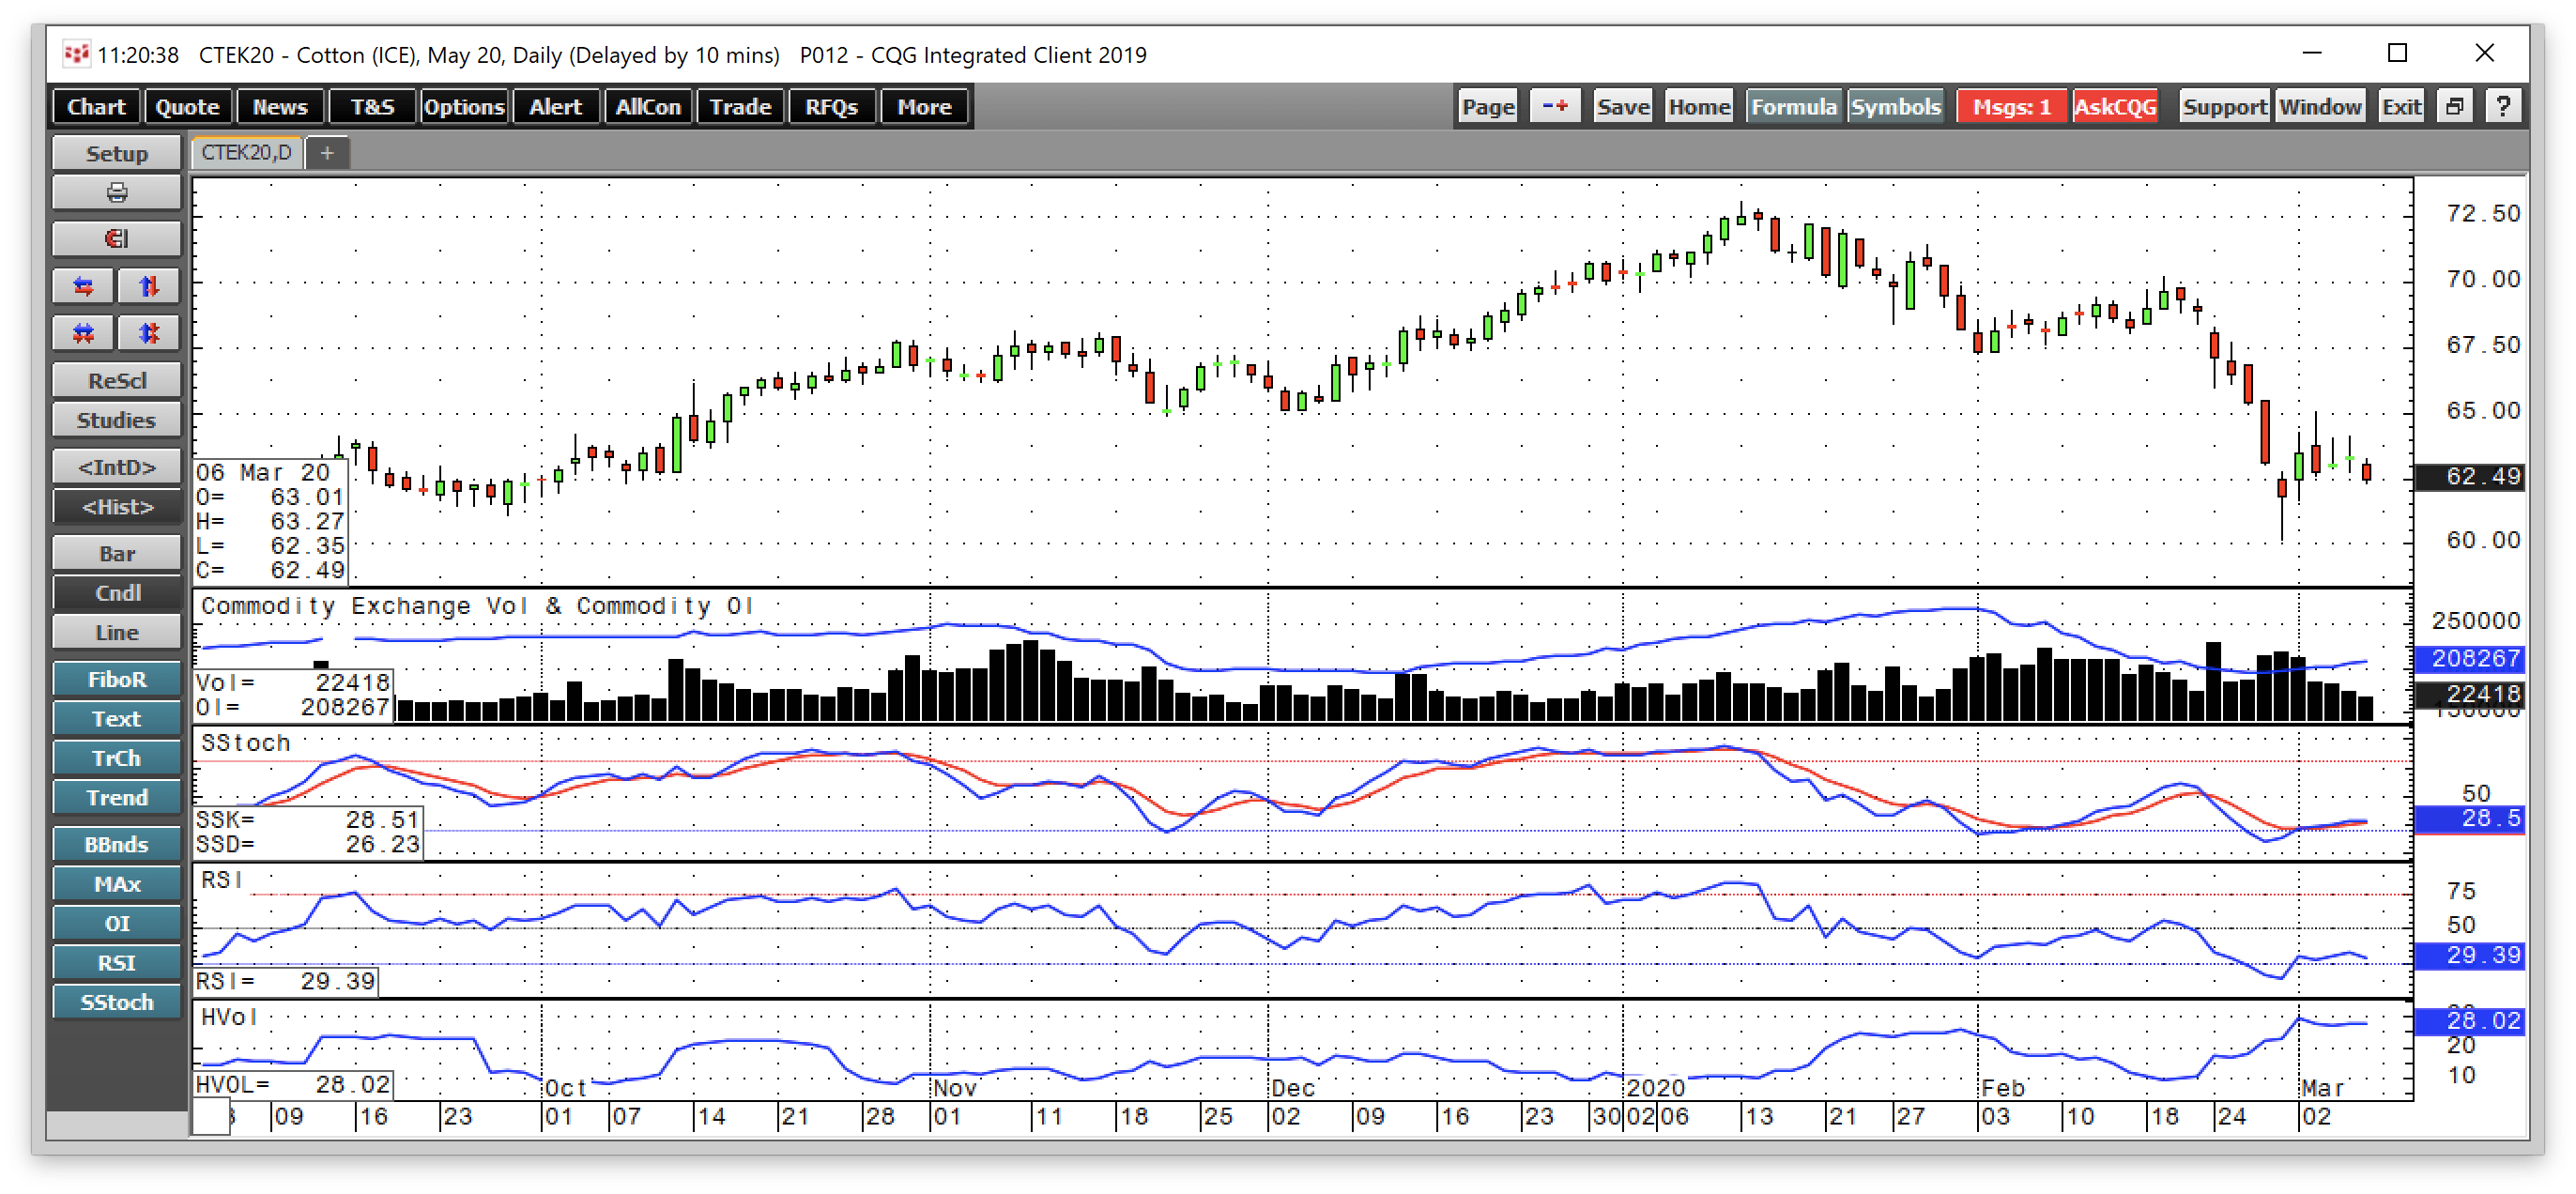
Source: CQG
The chart of May cotton futures shows that the price dropped from 73.08 cents on January 13 to a low of 60.18 cents on February 28. Cotton recovered to 65.07 cents on March 3 and was trading around the 62.50 cents per pound level at the end of last week. Price momentum and relative strength indicators were below neutral readings on March 6, and daily historical volatility rose from under 10% on February 20 to over 28% as of the end of last week. Open interest fell from 267,548 contracts on February 3 to 208,267 on March 5. Like in the grains, the metric fell as March futures rolled to May, but the lack of speculative participation in a risk-off environment caused the metric to decline dramatically. Cotton will be sensitive to the Coronavirus and economic conditions in China, and the March WASDE is likely to be little more than a sideshow for the fiber.
Animal proteins near the bottom of trading ranges
Live cattle futures prices have suffered in the current risk-off environment.

Source: CQG
The chart of April live cattle futures highlights the significant decline from over $1.28 per pound at the beginning of 2020 to below $1.10 per pound. The April contract was at the $1.06750 level on March 6. Price momentum and relative strength indicators were in oversold territory, and daily volatility jumped from under 6% at the start of this year to over 28% at the end of last week. Open interest declined since January when the metric was over 400,000 contracts, and the price was over the $1.25 level to 351,596 contracts at the end of last week.

Source: CQG
The chart of April lean hog futures shows the drop from 78.825 cents at the start of 2020 to 65.800 cents as of March 6. April hogs dropped to a low of 61 cents at the beginning of February and remained a lot closer to the low than the high for 2020 at the end of last week. Price momentum and relative strength were just above neutral readings, and both were rising on March 6. Daily volatility declined from over 56% in early February to around the 33.6% level as of last Friday. Open interest has been flatlining around the 290,000-contract level since late January.
The meats will move into the peak season for demand in late May as the grilling season starts on the Memorial Day weekend. However, fears of Coronavirus could weigh on demand if it curtails gatherings over the coming months.
The last WASDE report was on February 11. Soybeans and hog prices were around the same levels they were trading at on February 12, while cotton, corn, wheat, and cattle prices moved lower as of Friday, March 6, going into the March report.
The Invesco DB Agriculture Fund holds futures contracts of many of the agricultural products covered by the USDA’s WASDE report. The most recent top holdings include:
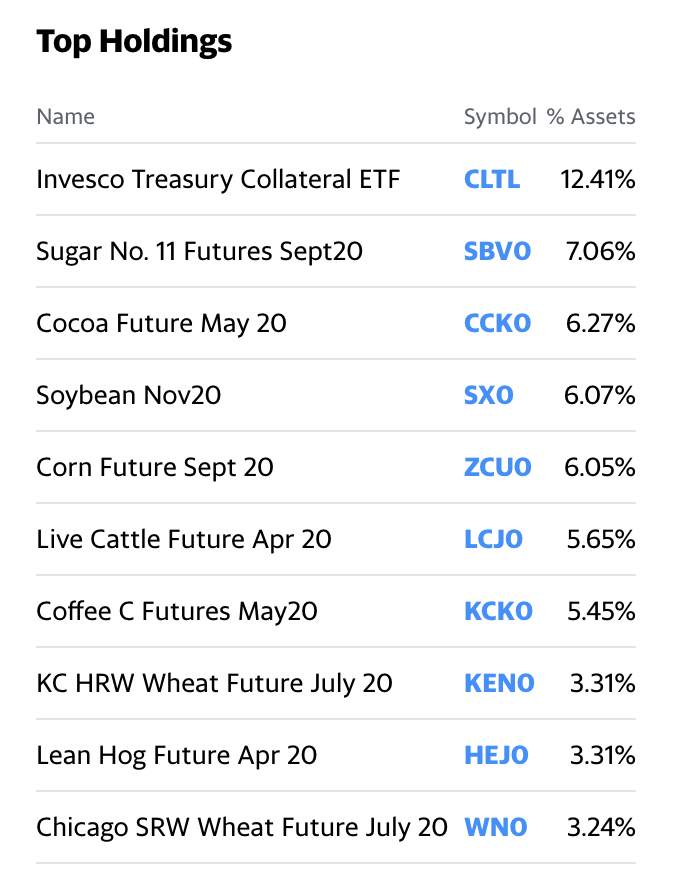
Source: Yahoo Finance
DBA has net assets of $314.44 million, trades an average of 249,009 contracts each day, and charges an expense ratio of 0.85%.
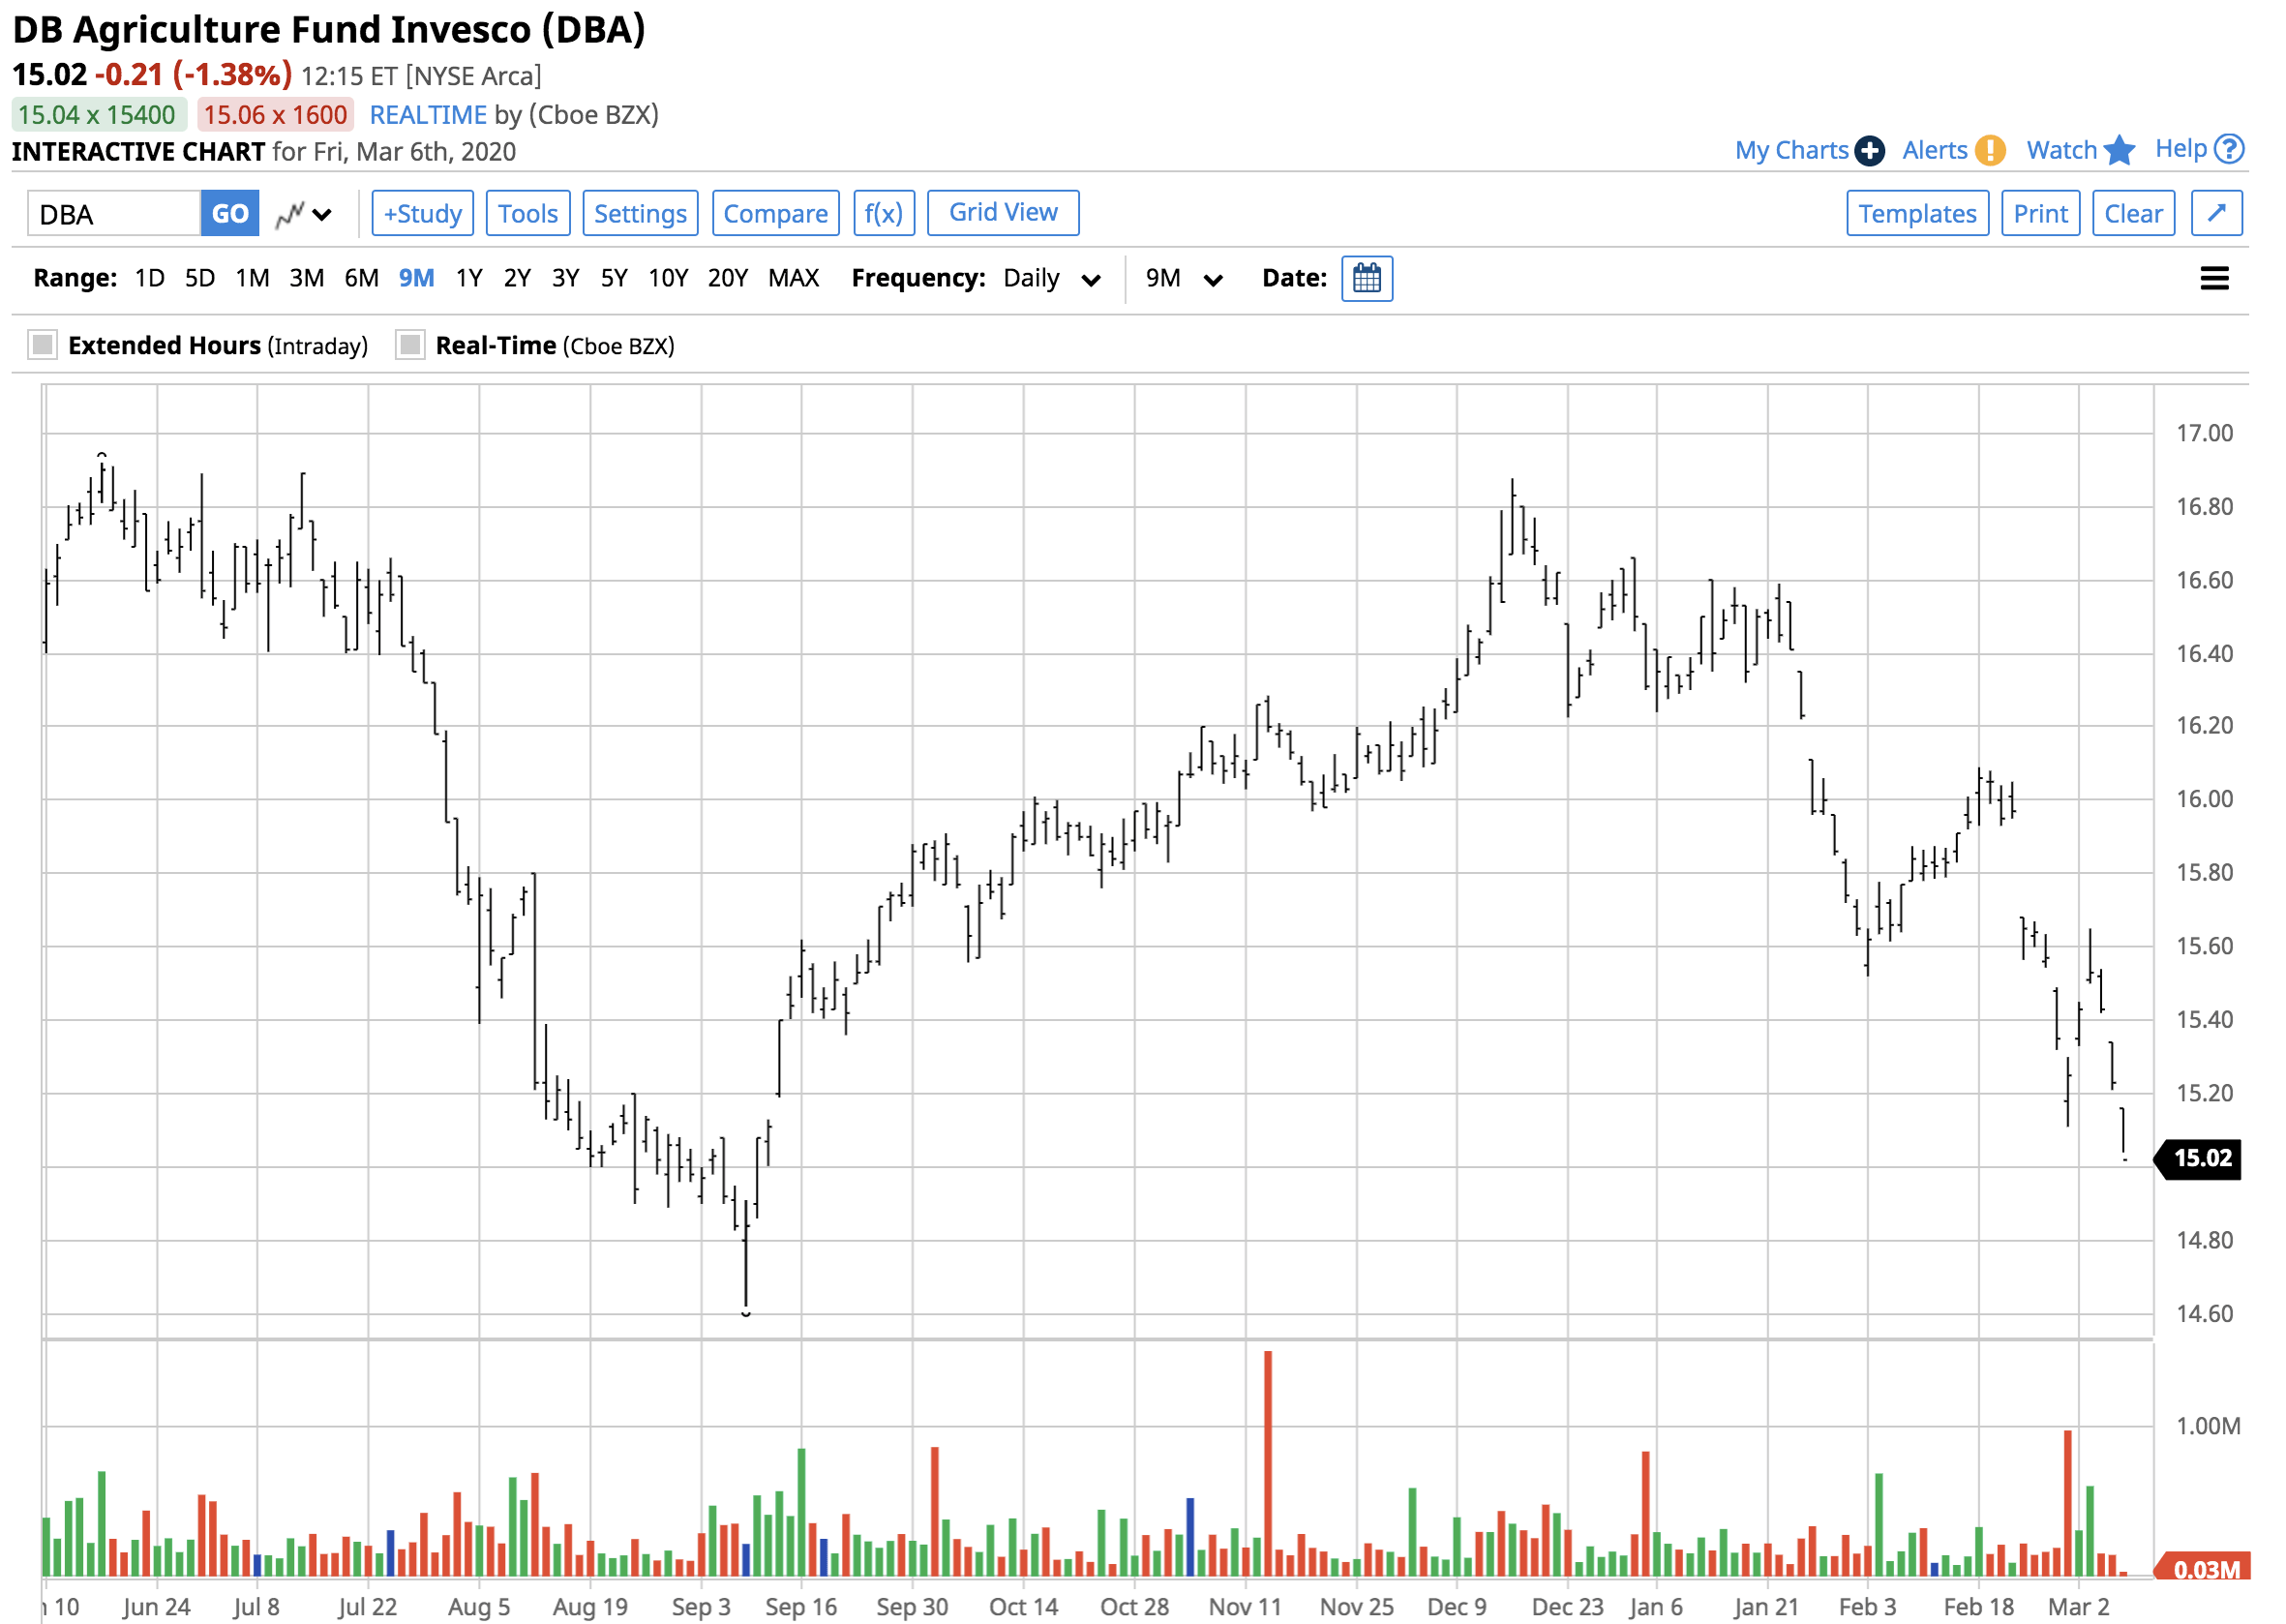
Source: Barchart
DBA closed at $15.82 on February 11, the day of the most recent WASDE report. At $15.02 on March 6, the price was 5.1% lower as agricultural commodities were not immune to the risk-off environment.
I will return with a summary of the March report and its impact on markets in the coming days.
The Hecht Commodity Report is one of the most comprehensive commodities reports available today from the #2 ranked author in both commodities and precious metals. My weekly report covers the market movements of 20 different commodities and provides bullish, bearish and neutral calls; directional trading recommendations, and actionable ideas for traders. I just reworked the report to make it very actionable!
Disclosure: I/we have no positions in any stocks mentioned, and no plans to initiate any positions within the next 72 hours. I wrote this article myself, and it expresses my own opinions. I am not receiving compensation for it (other than from Seeking Alpha). I have no business relationship with any company whose stock is mentioned in this article.
Additional disclosure: The author always has positions in commodities markets in futures, options, ETF/ETN products, and commodity equities. These long and short positions tend to change on an intraday basis.
Be the first to comment