

US Dollar Talking Points:
Recommended by James Stanley
Get Your Free USD Forecast
The US Dollar has opened the week with a support test.
While last week closed with the Thanksgiving holiday in the United States, the Greenback remained weak through the finish of last week’s trade. That weakness continued into this week with price trickling down to re-test the same low that was in-place two weeks ago. That’s when markets showed a knee-jerk reaction to a missile landing in Poland, with stocks pulling back and the US Dollar jumping from that prior low. But, cooler heads soon prevailed after that ordeal and equities quickly continued their ramp. In the US Dollar, however, the reversion back to weakness seemed to be a little slower. But, nonetheless, the relationship remains – the USD has already tested the low from that Tuesday while stocks still remain below those prior 11/15 swing-highs after they were tested last week.
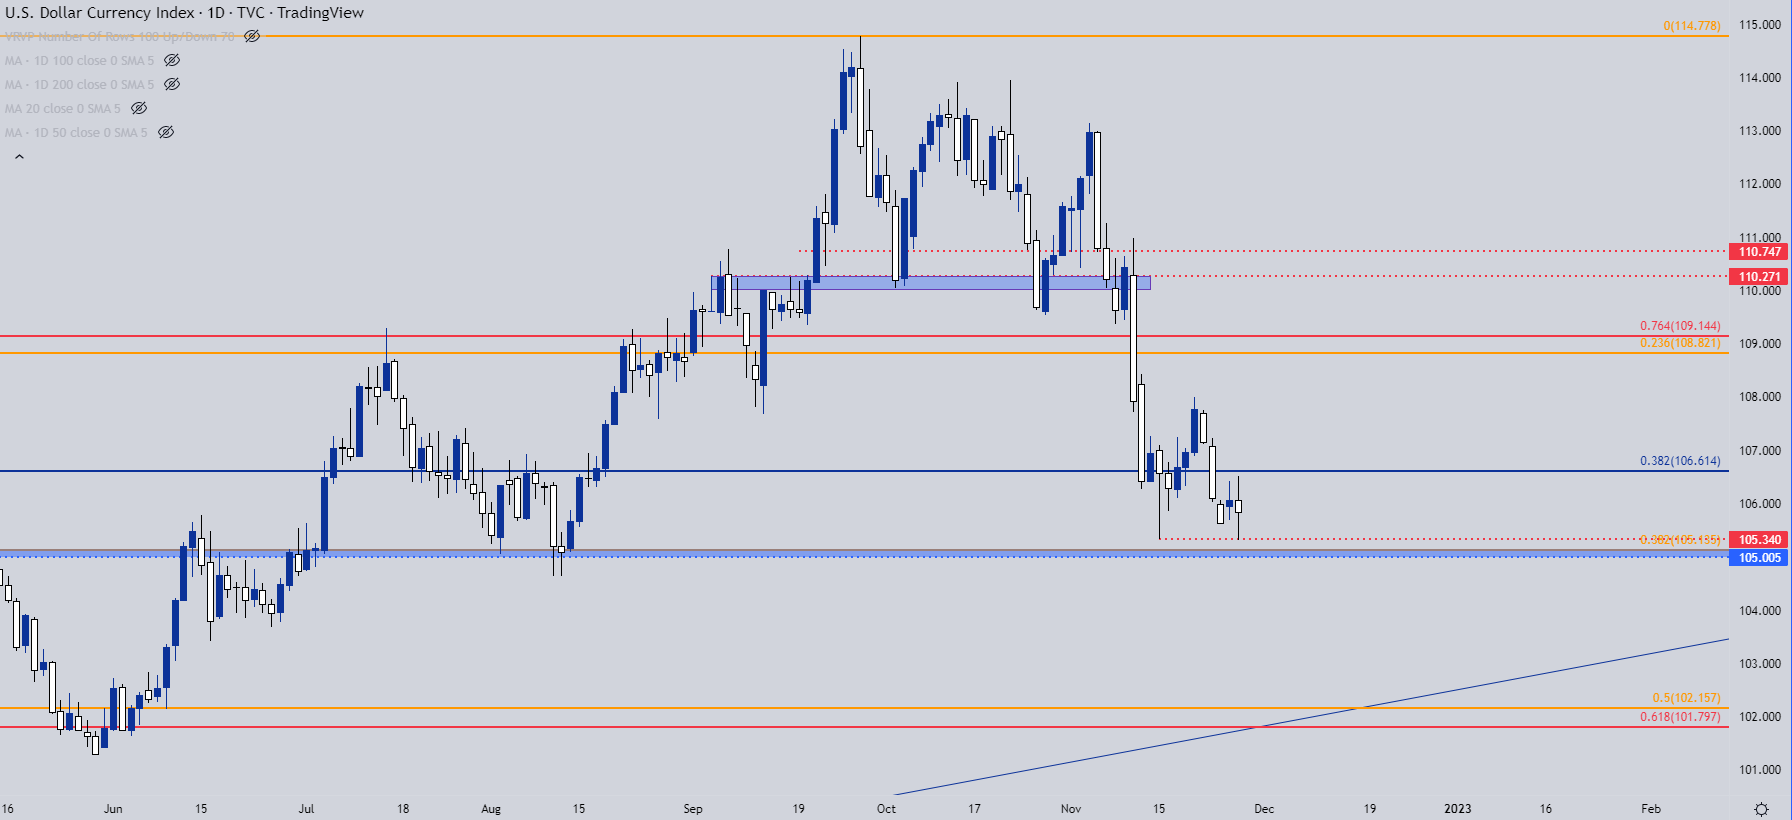
US Dollar Daily Price Chart
Chart prepared by James Stanley; USD, DXY on Tradingview
USD Support Zone
That low from a couple weeks ago showed up just above a big zone of confluent support. The 105 level in DXY started to come into play in May. It was support in August, just before the Greenback launched higher in a move that saw the currency craft a fresh 20-year-high.
But, given the swath of support in that proximity, with the 105 psychological level meshed up with a series of prior price action swings, on top of the 38.2% Fibonacci retracement of the recent bullish move in the USD, and there’s a lot of motivation for bulls should the current lows get tested through. This can raise the prospect of reversal setups if price can push below the current lows to test that confluent zone of support around the 105.00 handle on DXY.
US Dollar Weekly Price Chart
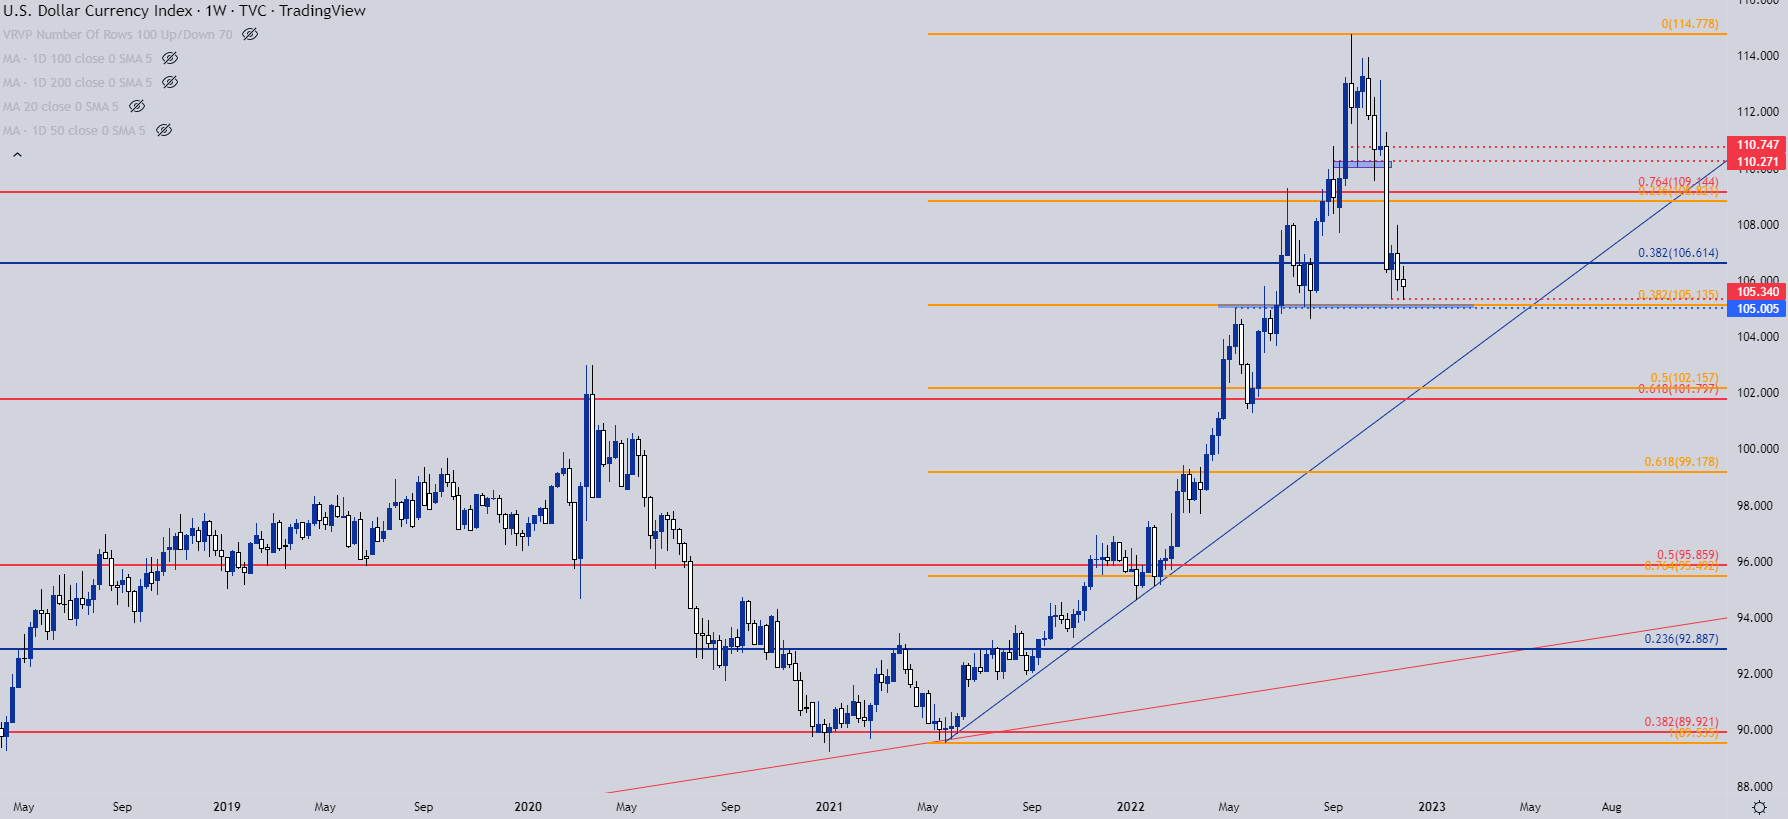
Chart prepared by James Stanley; USD, DXY on Tradingview
EUR/USD
As the USD/DXY gets closer to the 105.00 handle, EUR/USD has a similar backdrop with the 1.0500 level just sitting overhead. This does come with some differing context, however, as that price was almost in-play already with a current high of 1.0497.
When price shies away from a psychological level of that nature with little change in the headlines, it can be rational to assume that the round level has had some impact without actually coming into play. This can also be justification for looking for continuation, as there wasn’t necessarily a game-changing piece of information that helped to elicit the pullback. This isn’t to say that psychological levels can’t provide lasting highs or lows; but more information would be needed before we can say that a reversal is ready to work.
In EUR/USD, that big decision points appears to be around the same 1.0350 level that’s been in-play for the past few months. This price was the low in 2017 and it came back into play as support in May and June of this year, before showing resistance in August.
More recently, this level came in as resistance a couple weeks ago. Bulls have continued to grind through that price with 1.0350 showing as support after this week’s open. If bears can evoke a push below that level, we could be seeing the early stages of a change of control.
At this stage, bulls have control and EUR/USD has breakout potential at that 1.0500 handle after a v-shaped reversal has flung price right back up to a key point of resistance. Beyond 1.0500, the next major resistance zone runs from 1.0580-1.0638.
EUR/USD Daily Price Chart
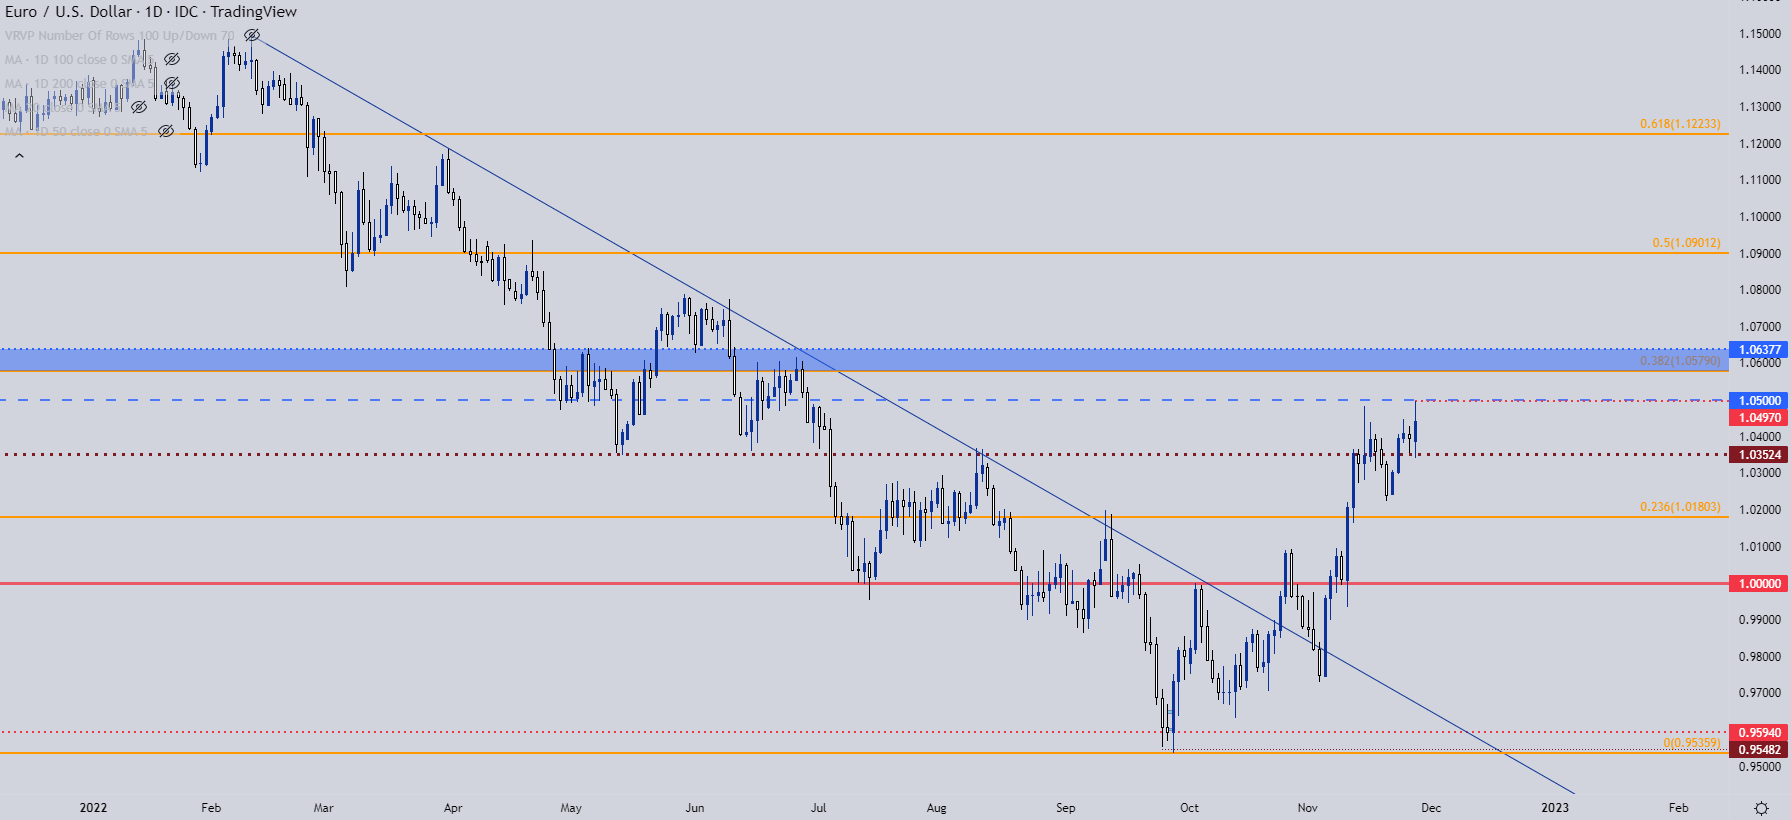
Chart prepared by James Stanley; EURUSD on Tradingview
GBP/USD Resistance
I had looked into the breakout in GBP/USD last Wednesday when price was working back to the 1.2000 psychological level, highlighting a resistance level at 1.2156 that remained of interest for bullish continuation scenarios.
I discussed that resistance level in this week’s technical forecast on the US Dollar. This price came into play last Thursday and price has been tilting-lower since, with another 1.2000 re-test looking likely but this time as support.
That level can function as higher-low support potential but this would very much be meshed with looking for another low in the USD. For those that are looking to play reversal themes in the US Dollar, there could be bearish potential in GBP/USD, namely from a rising wedge formation that has developed.
A break of 1.2000 and then further, 1.1951-1.1968 would open the door for that theme.
GBP/USD Daily Price Chart
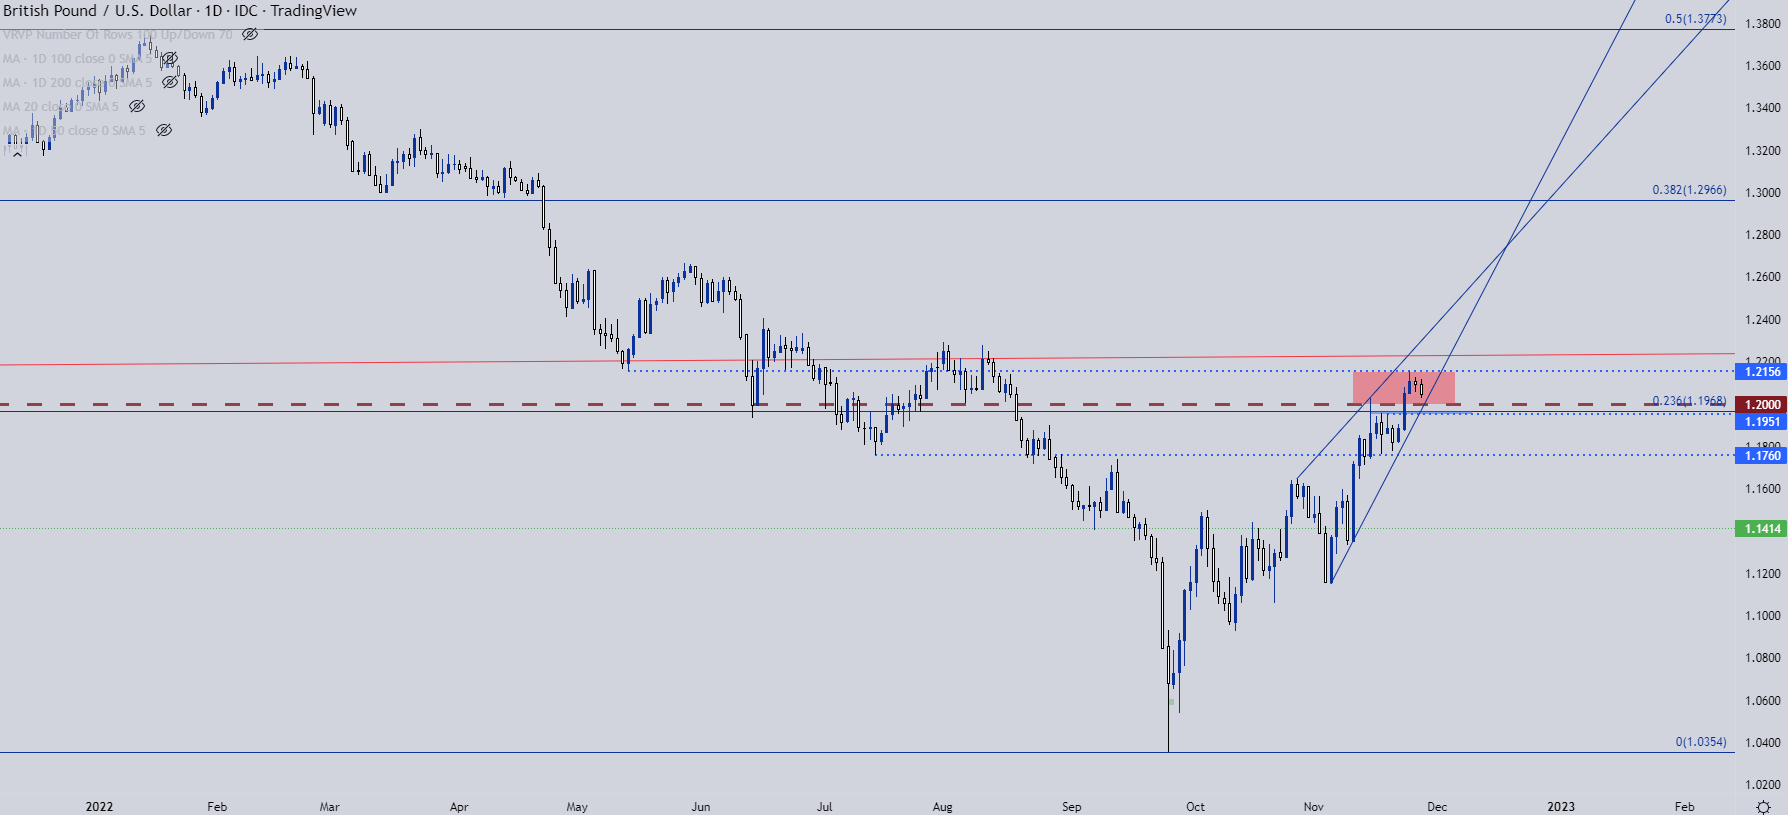
Chart prepared by James Stanley; GBPUSD on Tradingview
USD/CAD Back to Resistance
A couple of weeks ago I had looked at USD/CAD as one of the more attractive venues for USD-weakness. At the time, the pair was angling up for a resistance test at an area of prior support, plotted from around 1.3465 up to the 1.3500 big figure.
That resistance zone soon came into play – and price put in a strong reaction. But, sellers weren’t able to make much ground below support around 1.3350 and already price is back up to test resistance.
At this stage, the quick return to resistance gives the appearance of bullish breakout potential into the 1.3500 handle – and if price can get over that level, bulls face the big test as to whether they can continue the move. And if they can’t, fade scenarios come back into the equation, looking for a false breakout.
Given that USD/CAD is testing resistance even as USD is testing support highlights just how much CAD-weakness has been in the mix of recent. As looked at a couple of weeks ago, there may be more optimal venues for working with that theme, such as CAD/JPY.
USD/CAD Four-Hour Price Chart
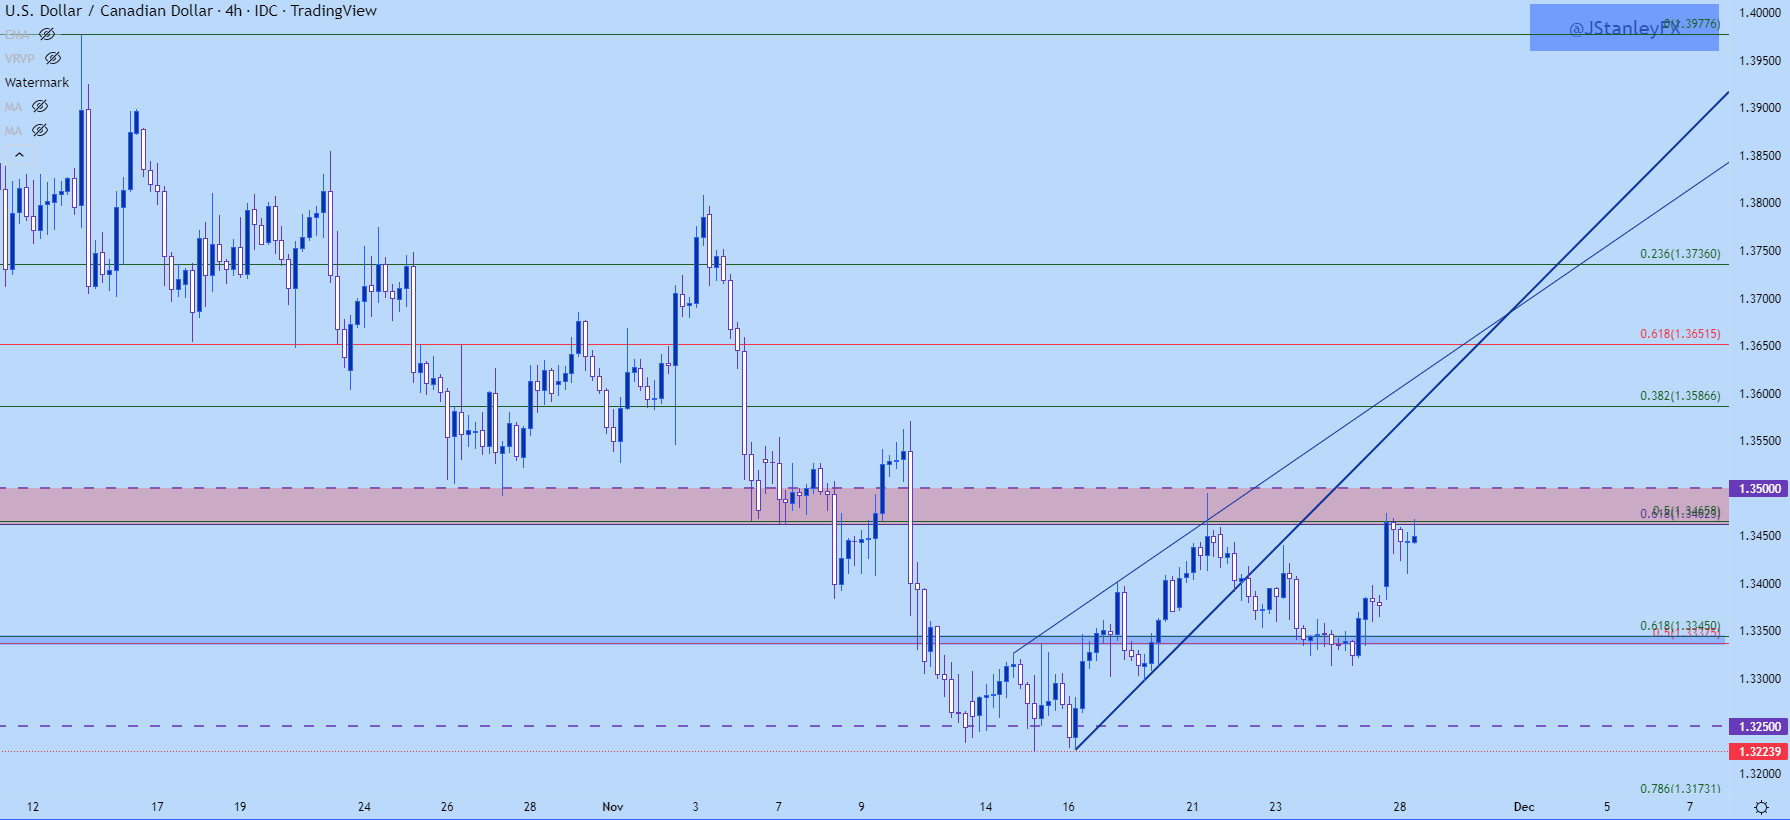
Chart prepared by James Stanley; USDCAD on Tradingview
USD/JPY v/s DXY
The US Dollar and the USD/JPY chart share some very similar characteristics at the moment, standing in contrast to the above scenario with USD/CAD and DXY.
In both the US Dollar and USD/JPY the big question is whether the low is in yet. While the USD has held support at that prior low, USD/JPY technically budged below its prior swing low to start this week’s trade, so there’s been a touch of additional weakness here versus the DXY index.
From the daily chart below, we can see a bit of bounce developing off of that low; but this still has a bearish look to it with breakdown potential until some greater signs of recovery begin to show.
USD/JPY Daily Price Chart
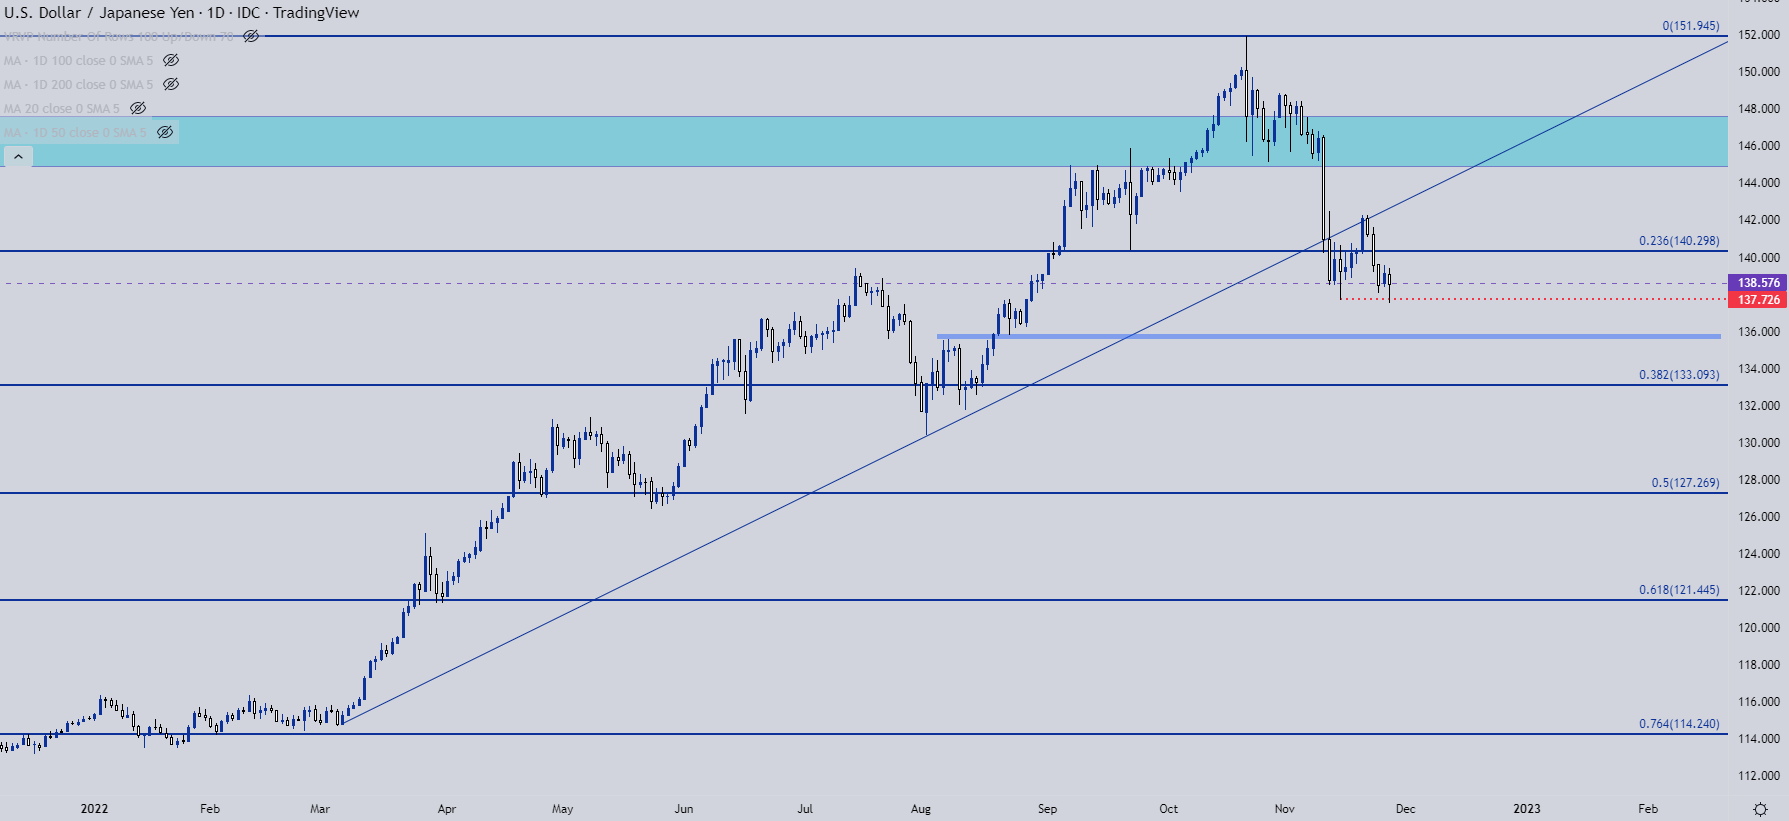
Chart prepared by James Stanley; USDJPY on Tradingview
USD/JPY Shorter-Term
From the four-hour chart below, there’s breakdown potential. The formation isn’t quite an inverse head and shoulders formation but there’s similar characteristics. With a failed test at the neckline already this morning, bears are likely going to want to be patient. If bulls can evoke a move back above the swing at 139.62, the door could start to re-open to bullish themes but likely, they’re going to want to see buyers reclaim ground above the 140.00 handle before pushing for longer-term reversal themes.
Recommended by James Stanley
Building Confidence in Trading
USD/JPY Four-Hour Chart
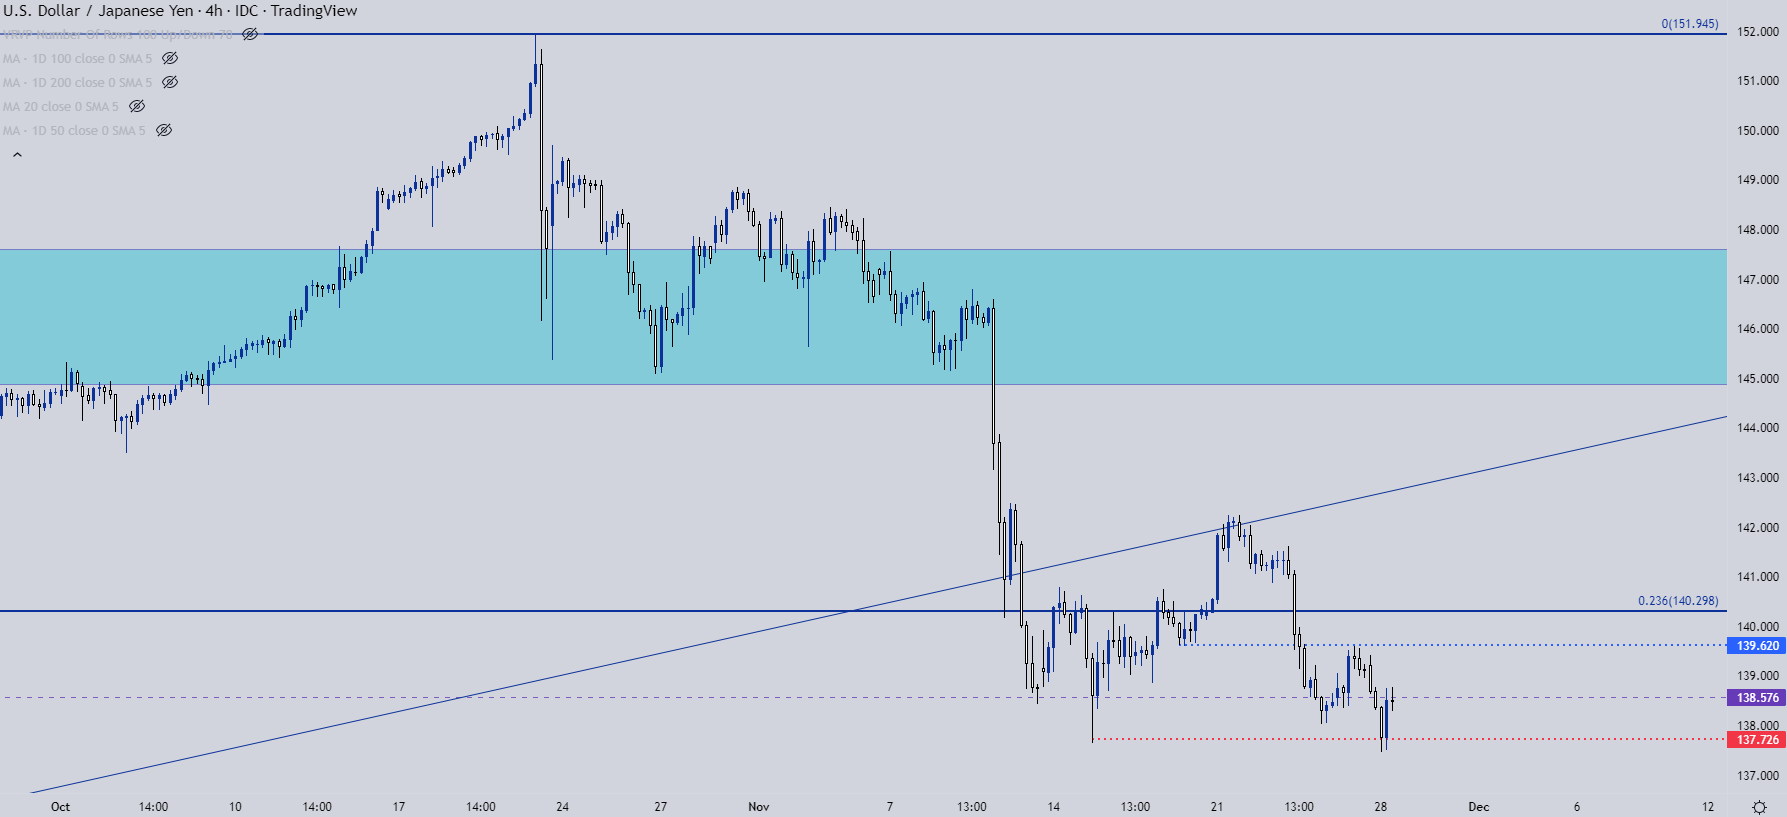
Chart prepared by James Stanley; USDJPY on Tradingview
— Written by James Stanley, Senior Strategist, DailyFX.com & Head of DailyFX Education
Contact and follow James on Twitter: @JStanleyFX
Be the first to comment