

US Dollar Talking Points:
- The US Dollar hit a fresh 23-month high yesterday, driving on the back of higher Treasury yields as Lael Brainard of the FOMC remarked that May would be appropriate to begin Quantitative Tightening.
- While markets were initially geared for a 50 basis point hike plus an announcement around QT in March, the Fed only did a 25 basis point move and punted on the topic of QT. A massive rally showed in stocks shortly after and that’s driven into Q2 trade. But, now that QT is back on the cards to go along with some massive expectations for rate hikes, stocks are starting to show pressure again.
- This was the rationale for my top trade for Q2, looking at bearish U.S. equities scenarios; and that goes along with the expectation for continued USD strength as the Fed moves closer to ‘normalization’ of policy.
- The analysis contained in article relies on price action and chart formations. To learn more about price action or chart patterns, check out our DailyFX Education section.
The US Dollar set a fresh 23-month high yesterday, riding on the heels of some comments from Lael Brainard of the FOMC. She pointedly remarked that she felt it would be appropriate to address Quantitative Tightening at the May rate decision and this is something that stocks took notice of very quickly, starting to pullback shortly after those comments hit the wires. Equities remained under a small bit of pressure through the session and another wave of selling came in overnight, bringing the prospect of pullback into the equation after an extremely aggressive bullish run showed after the March rate hike at the FOMC.
This brings to the forefront the main quandary at the moment: Is the Fed going to hike the U.S. economy into a possible recession? While many banks and commentators are minimizing the risk of recession, we’ve heard directly from FOMC members saying that they’re trying to engineer a ‘soft landing.’ And even if holding the upmost in confidence in the FOMC, history would suggest that this would be a challenge for them. After all, it was the bank’s own reliance on their faulty inflation forecasts that created this situation in the first place, with the FOMC continually saying that surging inflation was ‘transitory’ throughout last year.
That allowed the Fed to neglect inflation management as stocks, cryptocurrencies, NFTs and pretty much anything not nailed down surged in value.
The pivot appeared around Powell’s re-nomination in November. During the hearing he moved to retire the word transitory from the Fed’s lingo, waving a white flag to the persistent inflation that, to this day, hasn’t yet begun to calm. And due to that one-two combo markets are now expecting the Fed to go into uber-hawk mode for the rest of this year and this is bringing a big impact to both stocks and the USD.
Markets are currently expecting the Fed to hike nine more times this year, for a total of 10 hikes in 2022. Couple this with the expected announcement on Quantitative Tightening, which Lael Brainard just warned could come as soon as May, and that would be a massive shift from the FOMC in a very short period of time. The kind of fast change that’s unlikely to allow for any ‘soft landings.’
US Dollar
Perhaps the primary beneficiary of this hastened stance is the US Dollar. I’ve been tracking the currency higher for almost a full year now, keeping the technical forecasts to bullish over the past few quarters as USD strength has remained as one of the cleanest themes across macro markets. I had even appointed this as my Top Trade for Q1, with a related shift into bearish stocks for Q2.
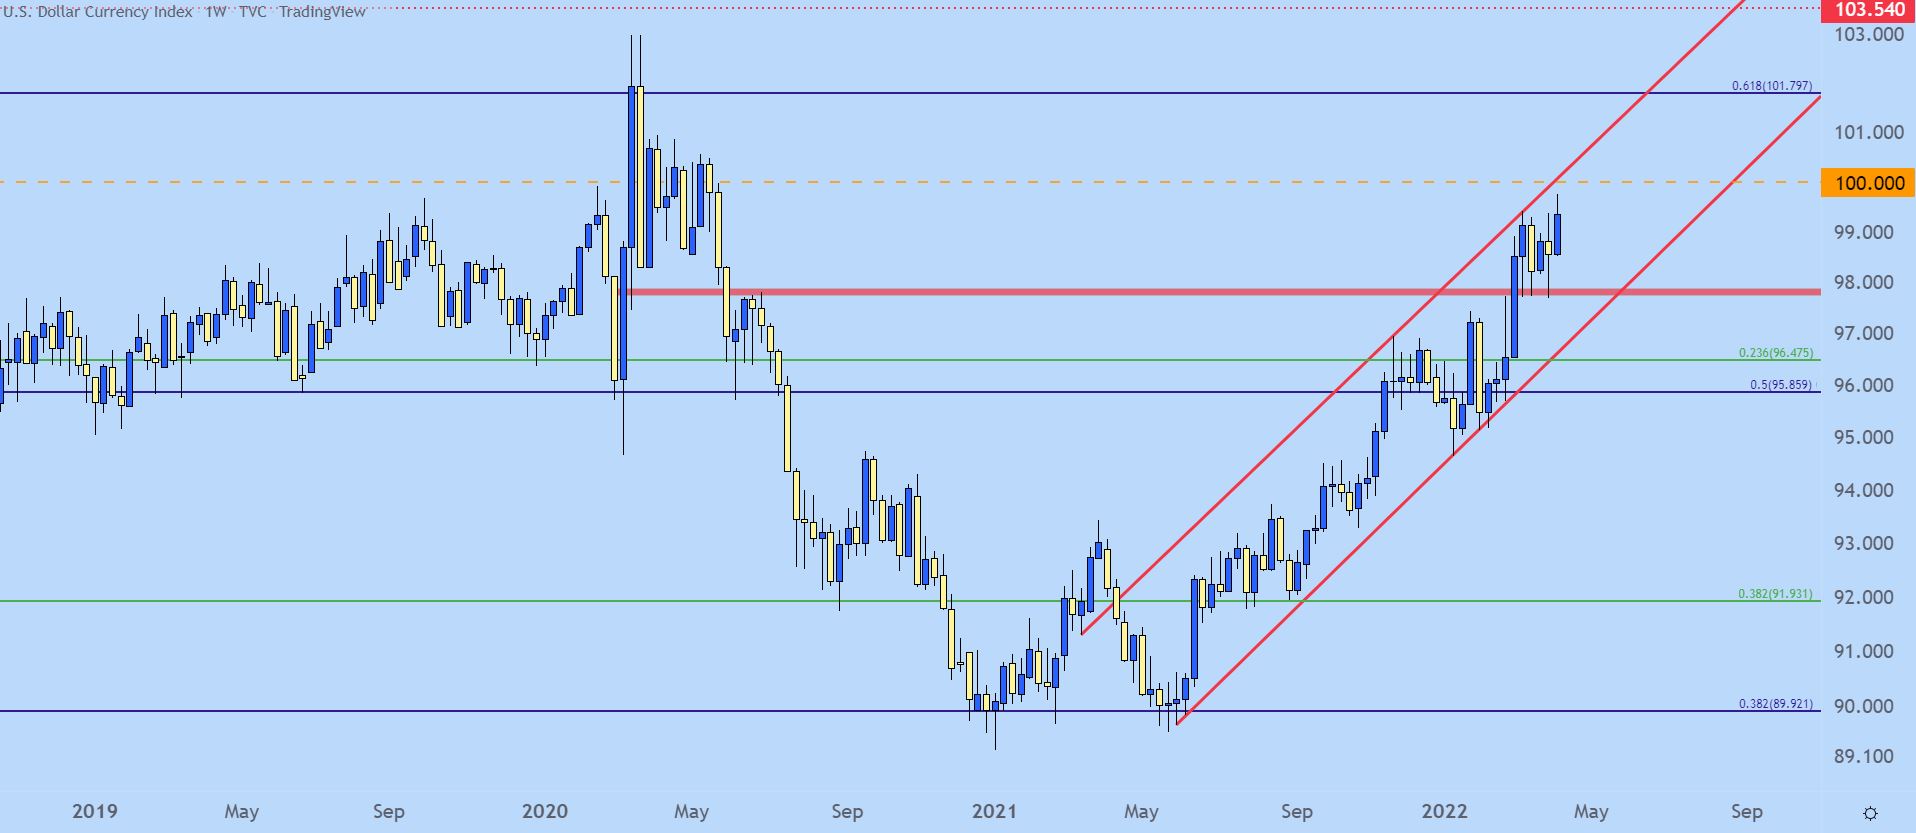
From the weekly chart below we can get a good idea for just how clean that run in the US Dollar has been, with price action spending much of that time holding within a bullish trend channel.
US Dollar Weekly Price Chart
Chart prepared by James Stanley; USD, DXY on Tradingview
USD Levels
That breakout has started to pull back on a shorter-term basis and there’s even a test of support at prior range resistance. The USD remained range-bound for pretty much all of March with buyers making a push for the topside breakout after the April open.
With that range holding for as long as it did, that means there’s multiple swing-points that can be re-purposed for support potential. Price action is currently sitting on the 14.4% Fibonacci retracement of a long-term major move, plotted at 99.34. Below that brings support potential to levels at 99 and 97.79, followed by a chunky spot of support near the middle of that prior range, spanning from 98.32-98.45.
US Dollar Four-Hour Price Chart
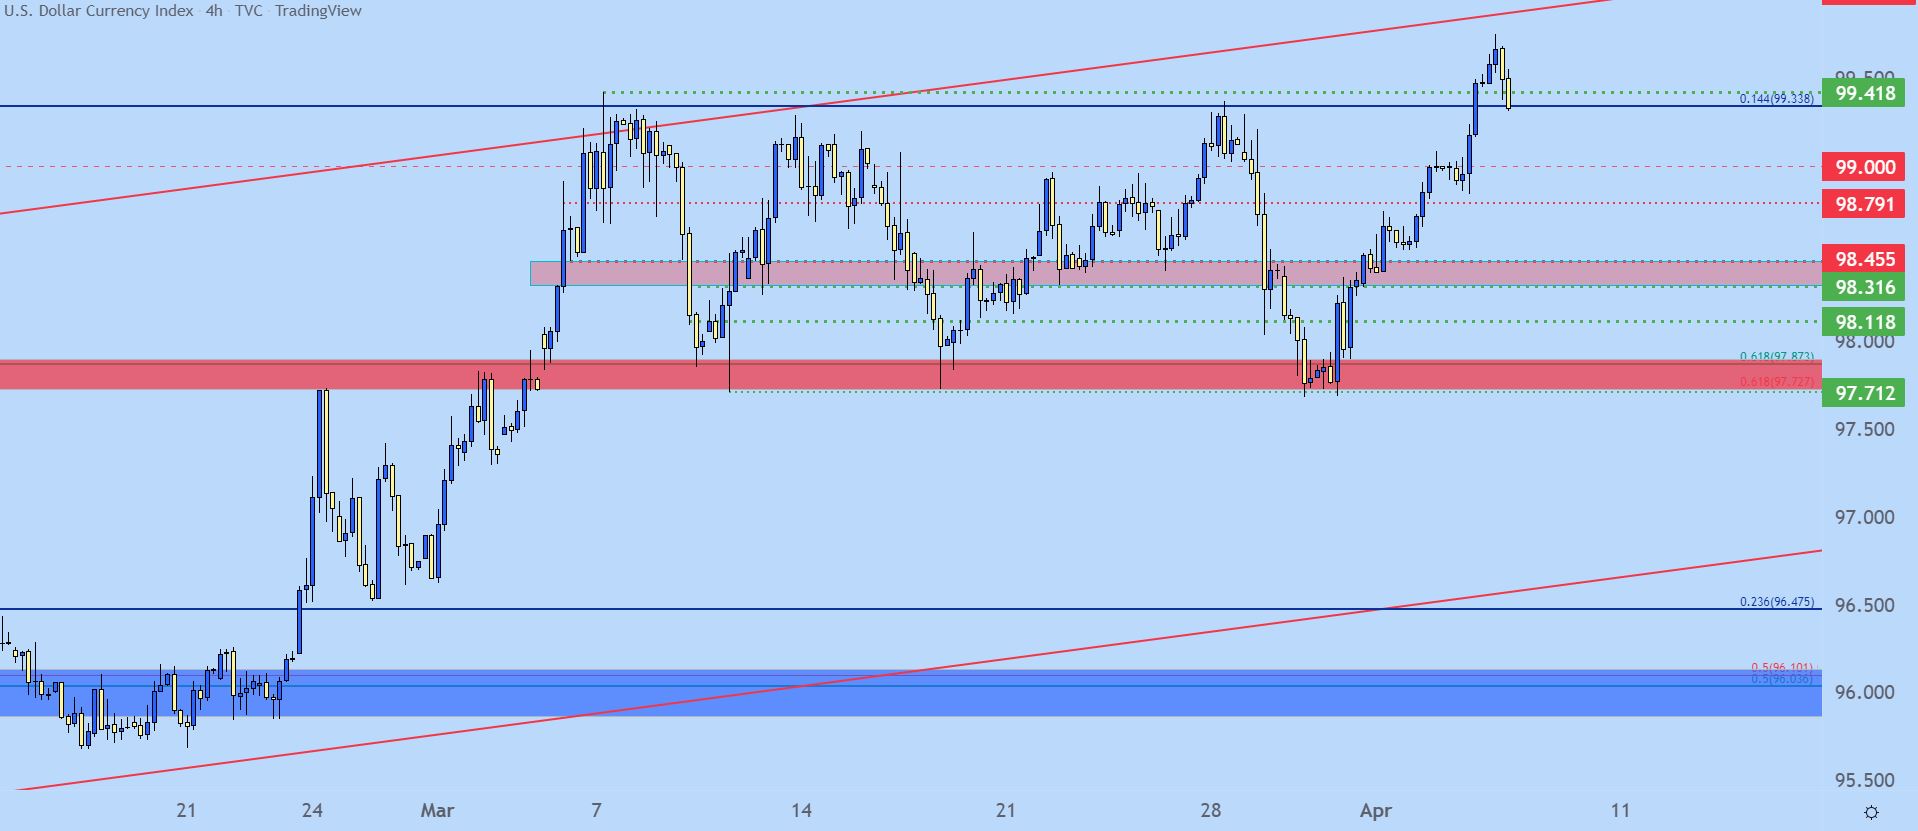
Chart prepared by James Stanley; USD, DXY on Tradingview
EUR/USD Tests Thicket of Long-Term Support
If the US Dollar is going to surge up to fresh multi-year highs, it’s likely going to need some help from the Euro to do it. The Euro is more than 57% of the value of DXY, the US Dollar index, and this means that the USD is going to often find difficulty in substantiating trends that aren’t being incorporated into the Euro.
And, to be sure, EUR/USD put in a harsh fall last year and in the early-portion of this year. But price plunged to a key level at 1.0814, which is the 78.6% retracement of the 2017-2018 major move, and that’s since stalled the declines.
From a longer-term basis we can see that EUR/USD is now trading in an area that has proven problematic for bears over the past seven years since coming back into play in March of 2016.
EUR/USD Monthly Price Chart
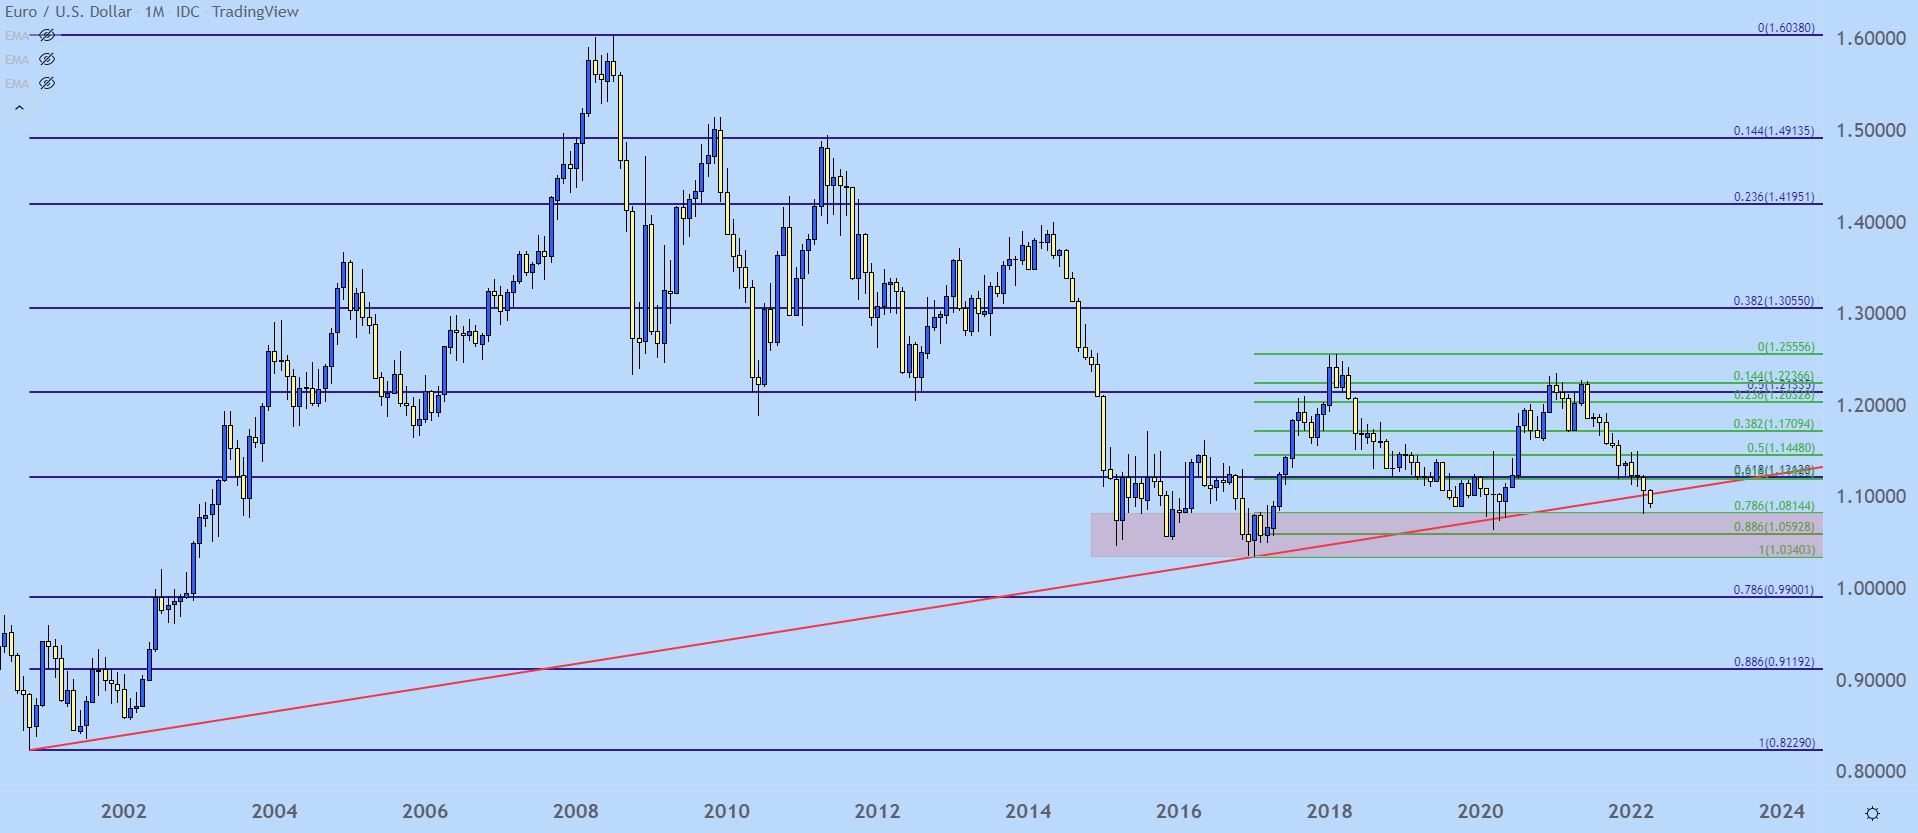
Chart prepared by James Stanley; EURUSD on Tradingview
EUR/USD Shorter-Term
EUR/USD bears have made a push over the past week but, notably, the pair has not yet set a fresh low even as the USD has set a fresh high. This could be alluding to pullback potential in both themes as EUR/USD nears that key spot of support on the chart around the longer-term Fibonacci retracement.
The trend, however, is fairly clear and the rationale for that trend remains. The only quandary sitting ahead is that long-term zone of support that sellers haven’t been able to reckon with yet; but what could create this is the Fed actually starting on those aggressive rate hike plans, which the ECB is unlikely to keep up with to any degree, and as markets become more accepting of the fact that the Fed put is going away, there could be additional USD-strength to price-in.
But, with a long-term zone of support such as what we’re seeing above, it often gets taken out with a bang as opposed to a whimper and given what’s going on in Europe with energy and the ongoing Russia-Ukraine scenario, that potential does exist unfortunately.
Pullback potential in EUR/USD remains at the same 1.0958 level I looked at last week, followed by the 1.1000 psychological level.
EUR/USD Four-Hour Price Chart
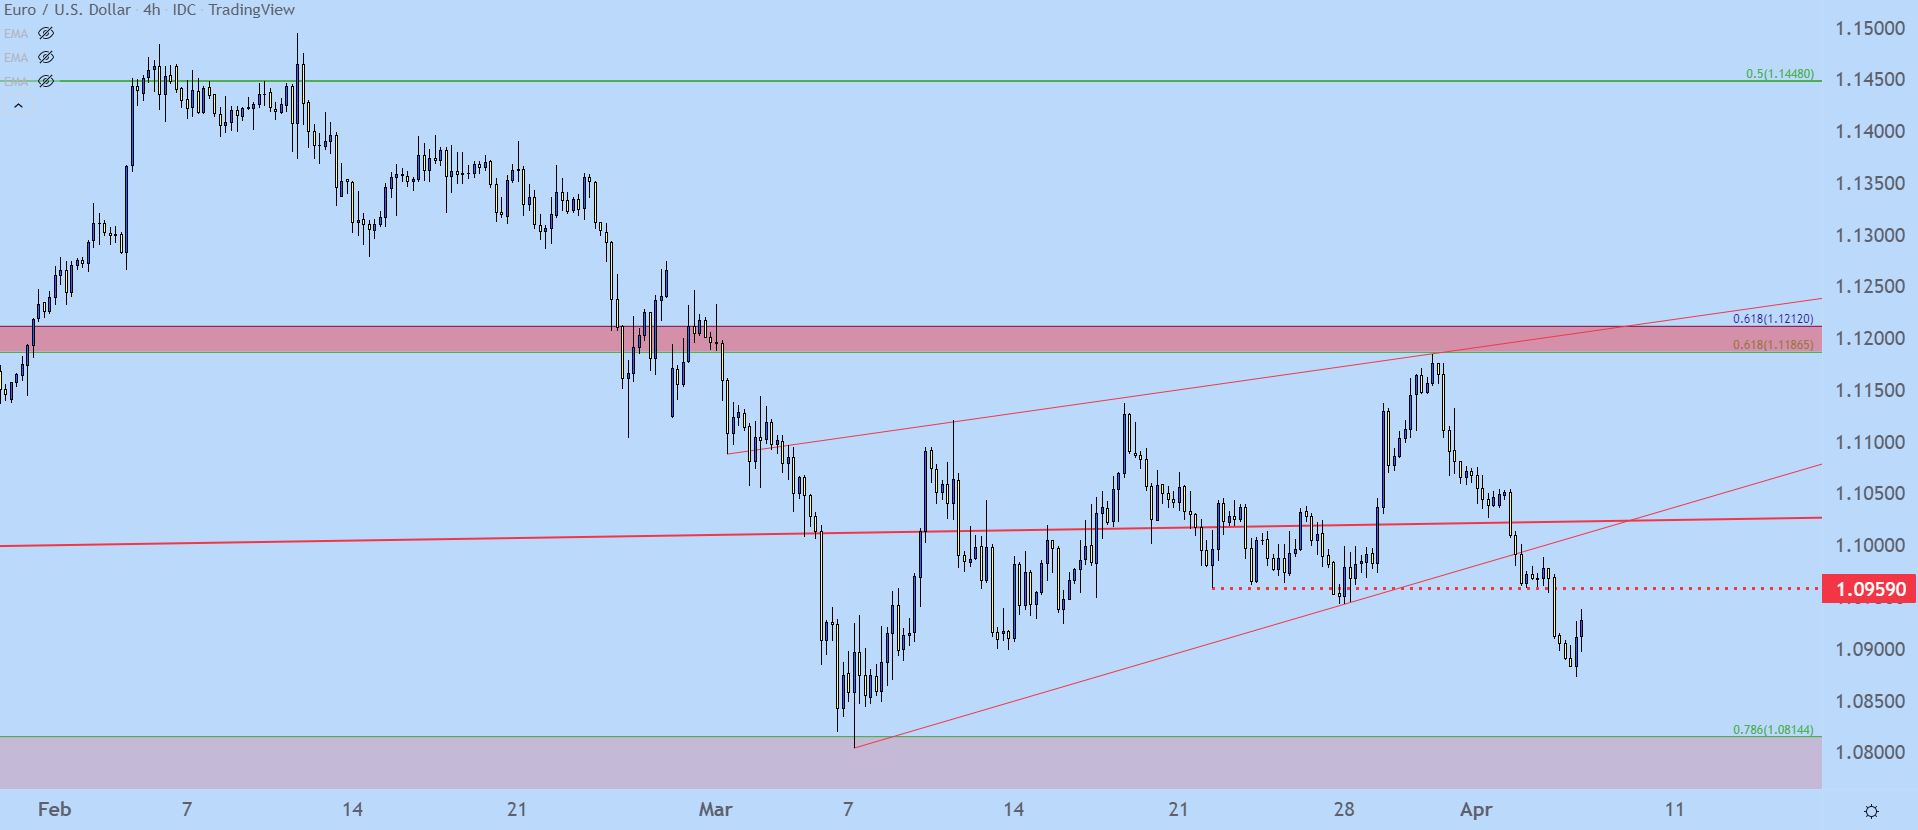
Chart prepared by James Stanley; EURUSD on Tradingview
GBP/USD Breakdown Potential
From the weekly chart below GBP/USD carries breakdown potential. Last week confirmed an evening star formation after a bounce showed up at the 1.3000 psychological level and sellers have pushed for a quick return back towards the lows. That support now looks vulnerable, although a major psych level like that may take a couple of swings before giving way, and the last bounce led to a 300 pip incline. So, logically there’s probably some sitting orders underneath that level, for now, and that could lead to another bounce before sellers are finally able to leave it behind.
GBP/USD Weekly Price Chart

Chart prepared by James Stanley; GBPUSD on Tradingview
GBP/USD Shorter-Term Range
Going down to the four-hour chart shows a range in GBP/USD, with resistance coming in at the 38.2% retracement of the 2020-2021 major move. Support has been holding around the 1.3050 area, but the psychological level is just below and it doesn’t appear that bears are yet willing to put in another test of this price although if they do, it could lead to a short-term bounce. The bigger question is where the next lower-high prints after that, which could keep the door open for a fresh bearish trend taking out that key spot of support looming ominously below GBP/USD price action.
GBP/USD Four-Hour Price Chart

Chart prepared by James Stanley; GBPUSD on Tradingview
AUD/USD Flies
Ok I’m going to get this out of the way, I don’t know that I entirely agree with the fundamental argument behind bullish AUD/USD plays, especially at current levels. But, as the old saying goes price leads and headlines lag.
I was very bearish in the pair coming into 2022, largely because of price action and the bear flag formation that had worked out so well in late-2021. But, early-February is when things began to shift as the pair was finding support at the .7000 psychological level, which allowed for a falling wedge to build.
Falling wedges are bullish reversal formations and even though I wasn’t a fan of the fundamental argument at the time, price is price and a bullish breach of that web opened the door for topside themes.
And then, it kind of just took on a life of it’s own.
The breakout hurried up to the .7400 level before pulling back, but even when doing so a bullish backdrop remained when a morning star formation printed on the daily chart in the middle of last month, just ahead of the FOMC. That led to further extension of the move that’s run all the way into Q2 trade, accounting for a +650 pip reversal from that .7000 test in early-Feb.
AUD/USD Daily Price Chart
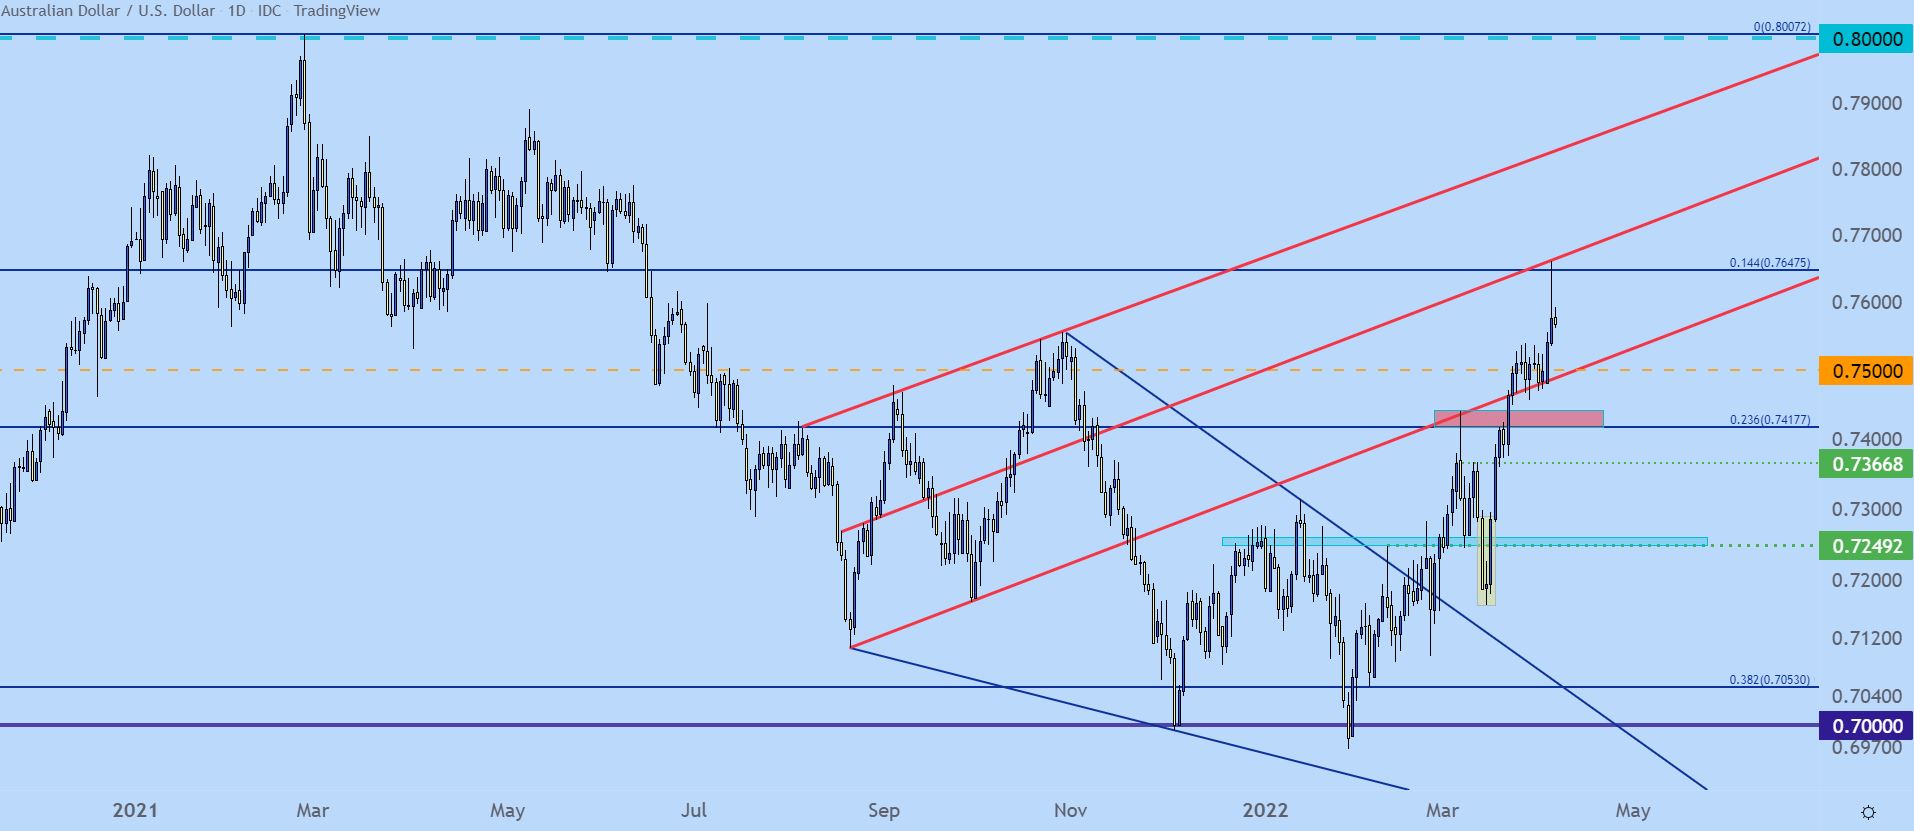
Chart prepared by James Stanley; AUDUSD on Tradingview
AUD/USD Shorter-Term
At this point, there’s pullback potential to the .7500 psychological level with a big zone lurking below that, spanning from .7417-.7442.
AUD/USD Four-Hour Price Chart

Chart prepared by James Stanley; AUDUSD on Tradingview
USD/JPY Gears Up for Round Two at Big Resistance
USD/JPY finally found some resistance.
The pair has been on a massive run so far in 2022 and really this could be extended into last year as expectations began to mount for a more-hawkish Fed. I started talking about this in September of last year, just after the FOMC started to forecast a single rate hike for 2022; and that theme has just continued to blossom ever since.
I looked into the matter last week after USD/JPY had run into a major spot of long-term resistance. This is around the 20-year highs in the pair around the 125.00 psychological level.
After that resistance inflection prices pulled back aggressively, and I wrote about it on the following day while pointing out a couple of spots of support on USD/JPY. There was a level at 121.41 and 122.41, each of which has since come in as pertinent to short-term price action.
The pair has since based off of each of those levels while launching back up to the longer-term resistance zone.
USD/JPY Four-Hour Price Chart

Chart prepared by James Stanley; USDJPY on Tradingview
USD/JPY Longer-Term
The bigger picture theme may not be ready yet and the fact that buyers are pulling up ahead of a test of the resistance zone indicates that this may not be the breakout scenario for the pair just yet, but the degree with which buyers come-in to defend support will highlight how quickly that might happen.
If a corresponding pullback doesn’t stall at the same 121.41 level, look for prices to push back towards the big figure at 120.00; and a show of support here could make an attractive case for short-term reversals in the direction of the longer-term trend.
USD/JPY Monthly Price Chart

Chart prepared by James Stanley; USDJPY on Tradingview
— Written by James Stanley, Senior Strategist for DailyFX.com
Contact and follow James on Twitter: @JStanleyFX
Be the first to comment