

US Dollar Price and Chart Analysis
- US Dollar takes a breather ahead of Jackson Hole.
- EUR/USD and GBP/USD look oversold by one technical indicator.
The US Dollar (DXY) is giving back early gains and looks likely to range trade ahead of a cluster of important economic releases and Fed chair Jerome Powell’s highly-anticipated speech at the Jackson Hole Symposium on Friday. Today’s US PMI readings for August are the first release of note. The Manufacturing PMI is forecast at 52 in August, compared to 52.2 in July, while the Services PMI is forecast at 49.2 vs. 47.3.
For all market moving data releases and economic events see the real-time DailyFX Calendar.
Ahead of chair Powell’s speech, the latest look at Q2 GDP and Core PCE will be released, giving the market a slightly better take on the current inflation vs recession narrative.
A look at the US dollar basket (DXY) chart shows the greenback touching and then falling back from the 109.02 two-decade high. The chart remains strong and the outlook for the US dollar is still positive but recent price action has pushed the CCI indicator – bottom of the chart – into heavily overbought territory. This needs to be cleaned before the DXY can move further ahead.
US Dollar (DXY) Daily Price Chart – August 23, 2022
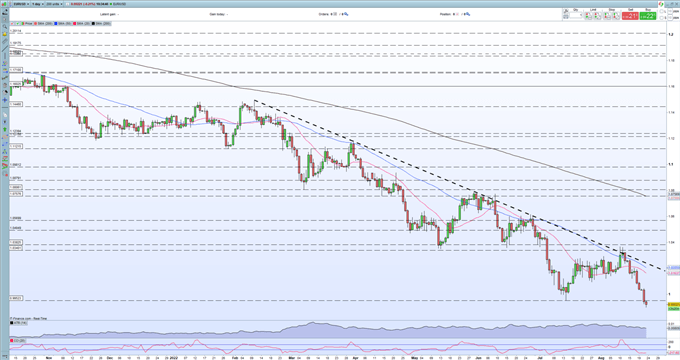
Yesterday, EUR/USD broke back below parity and now looks likely to turn this old support level into resistance. A combination of a strong US dollar and a weak Euro, ravaged by sky-high energy prices and recession fears, sent the pair to their lowest level in two decades. Earlier today, EUR/USD touched 0.9900 before moving back into the mid-0.9930s. The pair look heavily oversold, using the CCI indicator, and while a period of consolidation ahead of chair Powell’s speech on Friday may happen, fundamentally EUR/USD is set to go further lower. Support is seen at 0.9835 and then 0.9600.
EUR Breaking News: Lackluster Eurozone PMI adds Further Pain to EURUSD
EUR/USD Daily Price Chart – August 23, 2022
Retail trader data shows 73.72% of traders are net-long with the ratio of traders long to short at 2.80 to 1.
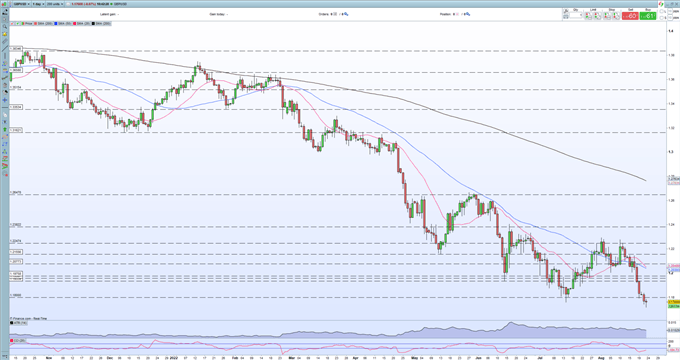
The British Pound is another currency in a mess with double-digit inflation, tepid growth, soaring energy bills, strikes, and a vacuum in government, all weighing heavily. Again the chart shows the pair to be oversold, suggesting a short-term period of consolidation before further losses are seen. The next level of support of note is around 1.1410.
GBP Breaking News: Mixed UK PMI Data, Pound Bid but Not Out of the Woods
GBP/USD Daily Price Chart – August 23, 2022
Retail trader data shows 80.57% of traders are net-long with the ratio of traders long to short at 4.15 to 1. The number of traders net-long is 2.83% higher than yesterday and 24.99% higher from last week, while the number of traders net-short is 12.08% higher than yesterday and 19.10% lower from last week.
We typically take a contrarian view to crowd sentiment, and the fact traders are net-long suggests GBP/USD prices may continue to fall. Positioning is less net-long than yesterday but more net-long from last week. The combination of current sentiment and recent changes gives us a further mixed GBP/USD trading bias.
What is your view on the US Dollar – bullish or bearish?? You can let us know via the form at the end of this piece or you can contact the author via Twitter @nickcawley1.
Be the first to comment