

buzbuzzer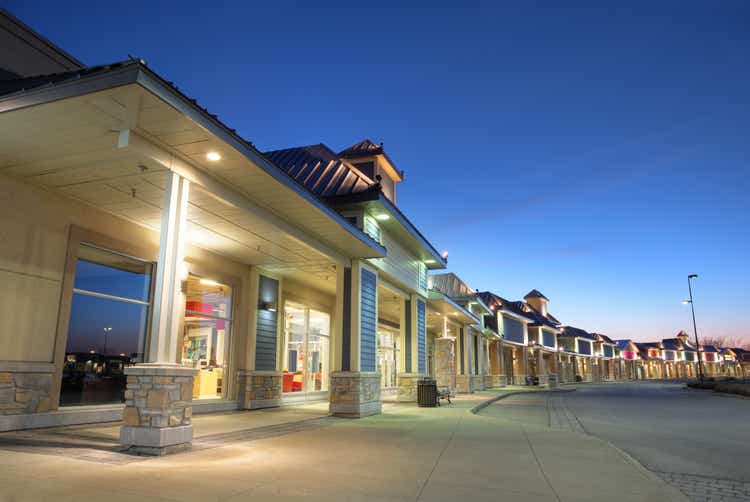
Urban Edge Properties (NYSE:UE) is a real estate investment trust (“REIT”) with interests in urban retail real estate located primarily in the Washington, D.C. to Boston corridor.
At the end of December 31, 2019, UE traded at a high of $21.68/share, which represented a multiple of 18.7x funds from operations (“FFO”). While shares have rebounded from their early pandemic lows, the stock has yet to fully recover.
UE’s Recent Share Price History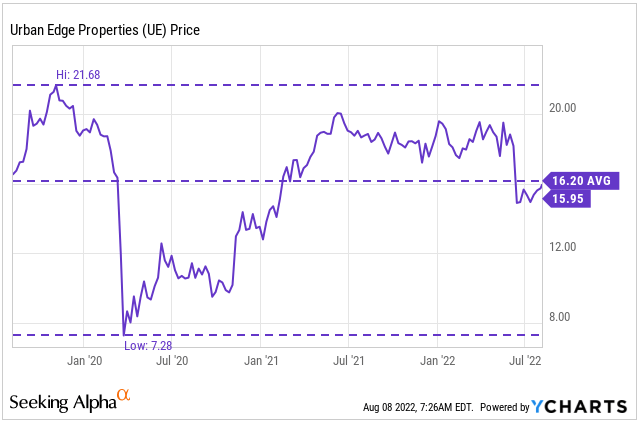
YTD, shares are down about 14.5%, despite posting better than expected quarterly results. At 13.6x forward FFO, there is some upside potential in the stock, which is likely to be realized through improving occupancy levels and the pending commencement of their large pipeline of signed but not yet occupied (“SNO”) leases. A reduction in net leverage from the resulting earnings growth will also support a modestly higher pricing multiple. For investors seeking another value addition to their long-term portfolios, UE provides solid coastal retail exposure at a reasonable price.
How UE Stacks Up Against The Competition
UE is a smaller shopping center REIT that is comparable in size to Saul Centers, Inc (BFS) and Acadia Realty Trust (AKR), with a current market cap of about +$2B.
Seeking Alpha Peer Comparison Tool – Market Cap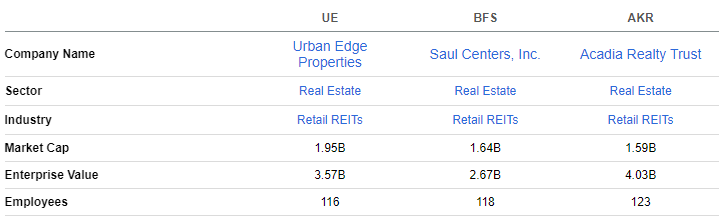
Though UE is down over the past year, they have still delivered double-digit returns over a three-year timespan. While their performance has lagged BFS, they have consistently outperformed shares in AKR, which has a three-year return rate of negative 34%.
This is reflected in the valuations of the three REITs. Currently, UE is valued more richly than AKR, who is trading at 12.9x forward FFO, but cheaper than the 15.8x fetched by BFS.
Seeking Alpha Peer Comparison Tool – Total Returns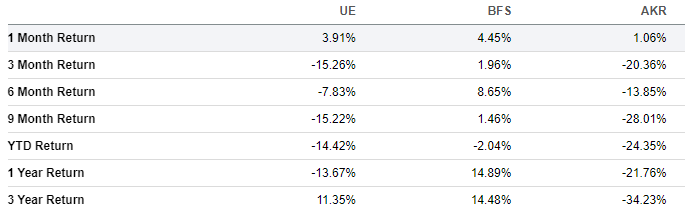
On dividends, UE most recently increased their quarterly payout from $0.15/share at the end of 2021 to $0.16/share, an increase of 6.7%. In contrast, BFS increased their dividend 3.6% from the end of 2021 to the start of 2022 and then another 3.5% in June. Both competitors, however, are trailing AKR, who reported an increase of 20% at the start of the year.
Seeking Alpha Peer Comparison Tool – Dividend Yield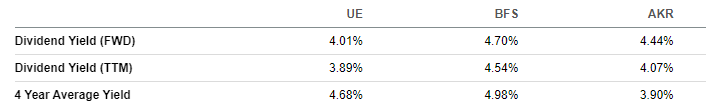
A Quality Portfolio Concentrated In The NY Suburbs
At the end of June 30, 2022, had interests in 69 shopping centers, five malls, and two industrial parks totaling 17.2M square feet. 90% of this portfolio was concentrated in the D.C. to Boston corridor, with heavy exposure to the first ring suburbs of the New York Metro. In recent periods, this market has benefitted from increased move-ins from younger populations seeking more spacious residences and outdoor spaces. The permanency of hybrid working arrangements has also provided the population with more flexibility to move outside of core urban markets.
June 2022 Investor Presentation – Geographic Concentration In NY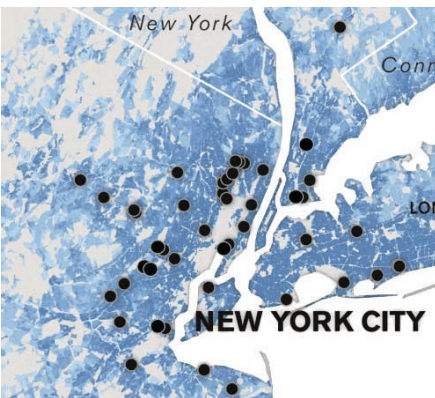
UE’s portfolio also benefits from the quality of their tenants, some of which include the largest publicly traded companies, such as The Home Depot (HD), The TJX Companies (TJX), Lowe’s (LOW), and Walmart (WMT), to name a few. Along with Best Buy (BBY), these five tenants represent 20% of total annualized base rents (“ABR”).
In addition, over 75% of the company’s asset values are anchored by either grocers, an HD or Lowe’s, or industrial assets. While the grocers provide downside protection due to the essential nature of their business, the home improvement centers and the industrial buildings provide upside exposure to industries with favorable long-term fundamentals. The balance between the two tenant mixes is a strength that benefits UE regardless of current market conditions.
Q2FY22 Investor Supplement – Summary of Top 5 Tenants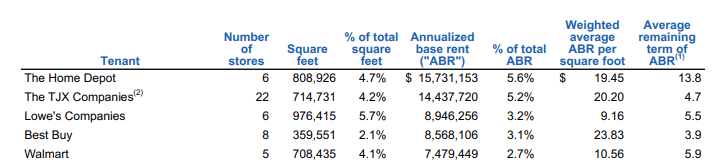
Positive Earnings Growth, Despite Difficult Comparisons
In the most recent filing period, UE reported better than expected results that included revenue growth of 4.1%, driven by the contributions of acquisitions, net of dispositions, and record levels of leasing activity. Overall expenses, however, were up about 7.6% and net income was lower by $0.01/share, weighed down by higher property expenses and general and administrative (“G&A”) costs. Despite these increases, UE still reported growth in both FFO and net operating income (“NOI”).
FFO was up 7% both YOY and YTD, while same-property NOI was up 1.2%. Though the 1.2% increase seems unimpressive at first glance, it’s worth noting that last year’s NOI benefited from approximately +$4.7M in bad debt reversals compared to +$2.3M this year. The prior year reversals translated to NOI growth of 25%, which made for difficult comparisons. When excluding the impact of the reversals, same-property NOI growth would have been 6%.
Record Leasing Activity Is Driving Occupancy To Above 95%
Driving results is strong leasing activity, which are at record levels. In the current period, UE executed 37 new leases at an average cash rent spread of 10%. This increased same-property occupancy to 94.9%, which represents a nearly 300 basis point (“bps”) increase from the prior year and 100bps on a sequential basis. In addition, UE’s leasing pipeline includes 1 million square feet under negotiation with spreads exceeding 20%. This is expected to raise occupancy to 96% by the end of the year.
With interest and cap rates on the rise, along with tightening conditions in the CMBS market, acquisition activity is expected to slow in future periods. UE does, however, have a significant SNO pipeline that is expected to contribute materially to future growth in NOI. At an estimated +$24.5M in future annual gross rent, their SNO is expected to represent 10% of their annualized NOI, which is among the highest in their peer set.
June 2022 Investor Presentation – Summary of SNO Pipeline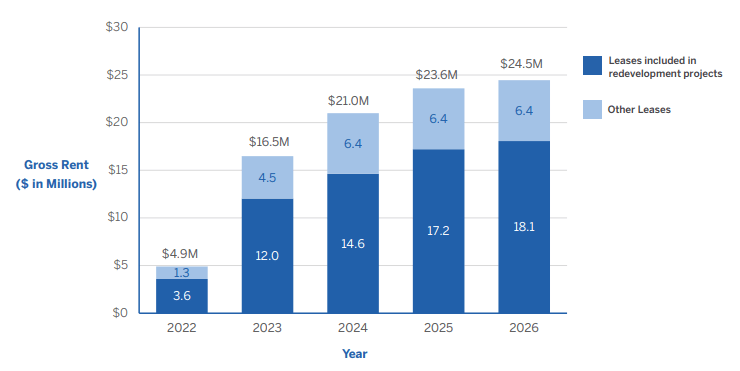
An Opportunity to De-Lever The Balance Sheet
The pullback in acquisition activity provides a beneficial opportunity to de-lever their balance sheet. Currently, net debt is running at 7.4x adjusted EBITDAre. This is on the high-end compared to their peers and to management’s own targets. Additionally, they have +$329M in debt maturing in 2023 and another +$144M due in 2024.
UE is currently exploring potential refinancing sources for the 2023 maturity and is also seeking a +$200M increase in their credit facility, in addition to extending the maturity out to 2027.
At present, total liquidity stood at +$771M, which includes +$171M in cash on hand and availability on their credit facility. As such, the company does have sufficient access to funds to address their near-term obligations. However, more will need to be done to bring leverage down to target levels. A pullback in acquisitions and the eventual commencement of leases in their SNO pipeline are two such catalysts that is likely to drive leverage lower in later periods.
Q2FY22 Investor Supplement – Debt Maturity Schedule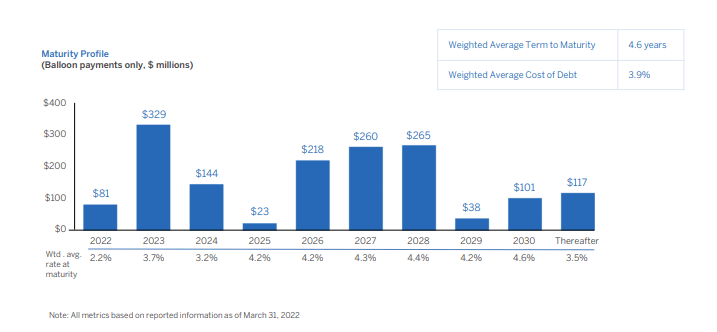
Pre-Pandemic Dividend Payouts Is Likely
For income investors, UE offers an annual dividend payout of $0.64/per share. At the current run-rate of adjusted FFO, coverage stands at about 53%. This indicates a strong degree of safety at present payout levels. Though interest expense is expected to track higher, UE still has enough cushion in earnings to cover both obligations.
From a growth perspective, the payout was last increased 6.7%. Prior to the pandemic, the company’s annual payout was $0.22/share. Continued strength in occupancy and leasing spreads should lend credence to an eventual return to pre-pandemic payout levels. At current pricing, that would result in a yield-on-cost of about 5.5%
UE Provides Reasonable Upside At A Moderate Level of Risk
UE is a smaller, retail-focused shopping center REIT that has a strong presence in the D.C. to Boston corridor, with over 90% of their portfolio NOI attributable to the region. While there have been concerns regarding the impacts of outbound migration, the corridor still has attractive fundamentals.
For one, it is the most heavily urbanized region in the U.S with a people per square mile ratio that is over 10x higher than the U.S. average. Households are also generally better capitalized with above-average incomes and better job security. This is reflected in foot traffic patterns in the company’s portfolio. Among their top 25 tenants, for example, foot traffic in UE’s markets ranks in the top 74th percentile amongst the tenants’ national portfolio of locations. Customer traffic patterns that are exceeding 2019 levels provides further support of the region’s continuing underlying strength.
Compared to related peers, AKR and BFS, UE trades at a mixed valuation. Shares are valued higher than AKR but lower than BFS. Given the company’s quality tenant mix, which includes The Home Depot, TJX, and Lowe’s among their top three tenants by ABR, in addition to steadily improving occupancy levels, appreciation to a 15x forward multiple is certainly plausible, especially when factoring in the favorable impact to earnings and leverage levels expected from their pipeline of SNO leases.
At this multiple, shares would be worth approximately $17.50, which would represent nearly 10% upside. In addition, investors would receive an annual dividend payout currently yielding 4% but likely to grow further in future periods. For investors seeking to add another REIT to their long-term portfolios, UE’s exposure to the resilient coastal markets provides reasonable upside at moderate risk.
Be the first to comment